| Param | Original file | Final file |
|---|---|---|
| Filename | modeM0/AS1C05_019T04_9000003838_26527cztM0_level2.evt | modeM0/AS1C05_019T04_9000003838_26527cztM0_level2_quad_clean.evt |
| Size (bytes) | 505,048,320 | 110,350,080 |
| Size | 481.7 MB | 105.2 MB |
| Events in quadrant A | 2,864,440 | 759,602 |
| Events in quadrant B | 2,876,611 | 769,476 |
| Events in quadrant C | 3,261,072 | 733,467 |
| Events in quadrant D | 5,888,098 | 662,239 |
| Mode M9 | |||
|---|---|---|---|
| Quadrant | BADHDUFLAG | Total packets | Discarded packets |
| A | 0 | 10 | 0 |
| B | 0 | 10 | 0 |
| C | 0 | 10 | 0 |
| D | 0 | 10 | 0 |
| Mode M0 | |||
|---|---|---|---|
| Quadrant | BADHDUFLAG | Total packets | Discarded packets |
| A | 0 | 12206 | 0 |
| B | 0 | 12336 | 0 |
| C | 0 | 13434 | 0 |
| D | 0 | 21558 | 0 |
| Quadrant | Total seconds | Saturated seconds | Saturation percentage |
|---|---|---|---|
| A | 5975 | 33 | 0.552301% |
| B | 5976 | 36 | 0.602410% |
| C | 5976 | 68 | 1.137885% |
| D | 5976 | 926 | 15.495315% |
Noise dominated data is calculated using 1-second bins in cleaned event files. If a bin has >2000 counts, and if more than 50% of those come from <1% of pixels, then it is considered to be noise-dominated and hence unusable.
| Quadrant | # 1 sec bins | Bins with >0 counts | Bins with >2000 counts | High rate bins dominated by noise | Noise dominated (total time) | Noise dominated (detector-on time) | Marked lightcurve |
|---|---|---|---|---|---|---|---|
| A | 6925 | 5975 | 0 | 0 | 0.00% | 0.00% | 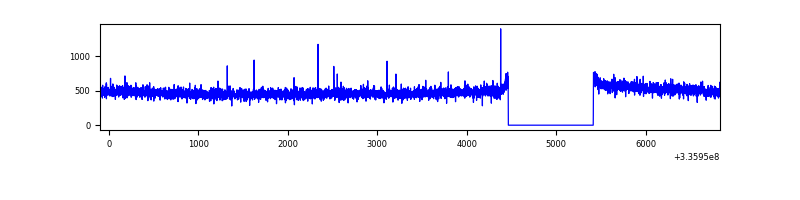 |
| B | 6926 | 5976 | 9 | 9 | 0.13% | 0.15% | 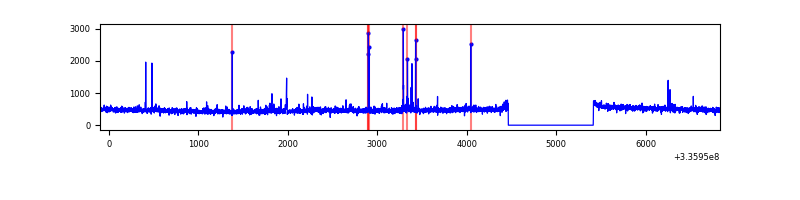 |
| C | 6926 | 5976 | 3 | 3 | 0.04% | 0.05% | 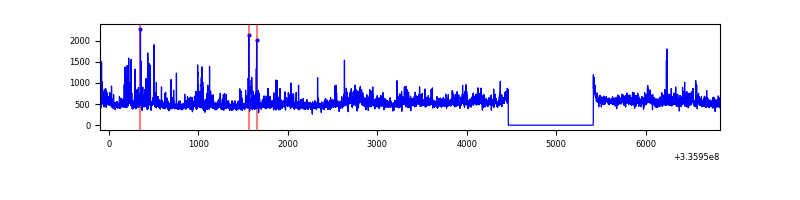 |
| D | 6926 | 5976 | 589 | 589 | 8.50% | 9.86% | 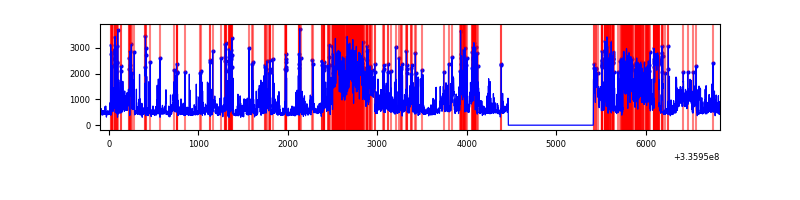 |
Top three noisy pixels from each quadrant. If the there are fewer than three noisy pixels in the level2.evt file, extra rows are filled as -1
| Pixel properties | Quadrant properties | ||||||
|---|---|---|---|---|---|---|---|
| Quadrant | DetID | PixID | Counts | Sigma | Mean | Median | Sigma |
| A | 5 | 168 | 87242 | 604.21 | 719 | 704 | 143.2 |
| A | 13 | 254 | 10116 | 65.71 | 719 | 704 | 143.2 |
| A | 3 | 137 | 6414 | 39.87 | 719 | 704 | 143.2 |
| B | 5 | 172 | 50831 | 375.66 | 710 | 694 | 133.5 |
| B | 12 | 111 | 16080 | 115.28 | 710 | 694 | 133.5 |
| B | 15 | 33 | 14848 | 106.05 | 710 | 694 | 133.5 |
| C | 3 | 233 | 442697 | 2801.6 | 681 | 685 | 157.8 |
| C | 14 | 238 | 109999 | 692.86 | 681 | 685 | 157.8 |
| C | 4 | 254 | 48469 | 302.87 | 681 | 685 | 157.8 |
| D | 1 | 52 | 1620296 | 10769.2 | 627 | 611 | 150.4 |
| D | 7 | 80 | 1448120 | 9624.41 | 627 | 611 | 150.4 |
| D | 12 | 233 | 284826 | 1889.73 | 627 | 611 | 150.4 |
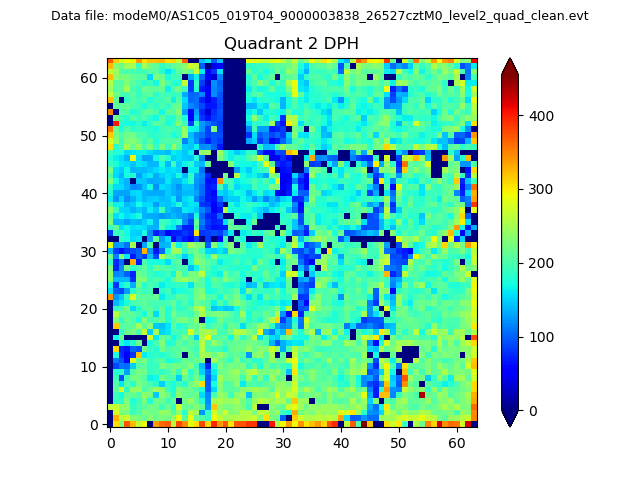
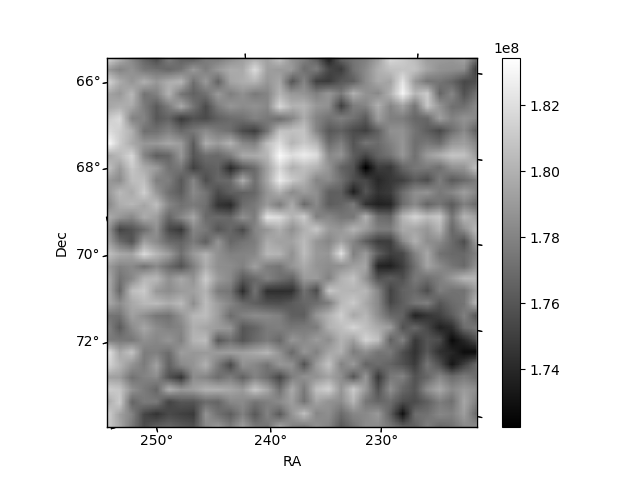
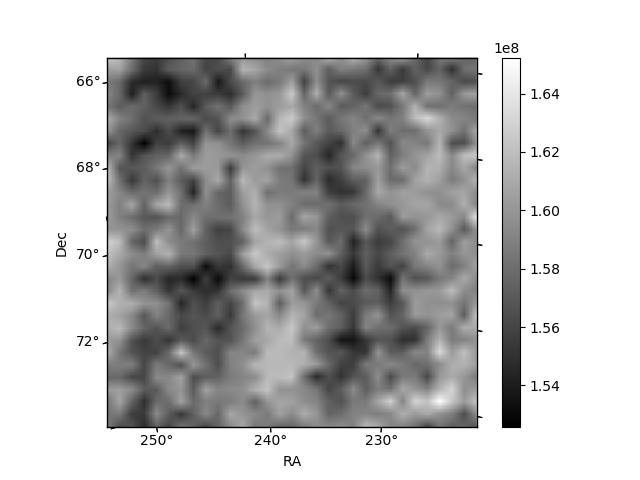
Histogram calculated using DETX and DETY for each event in the final _common_clean file
| Quadrant A | 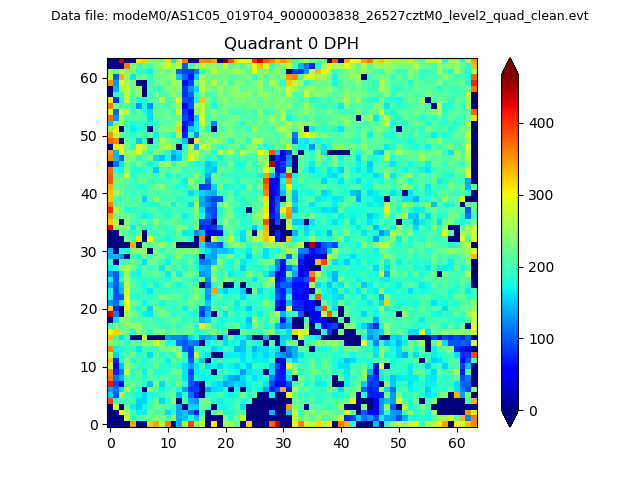 |
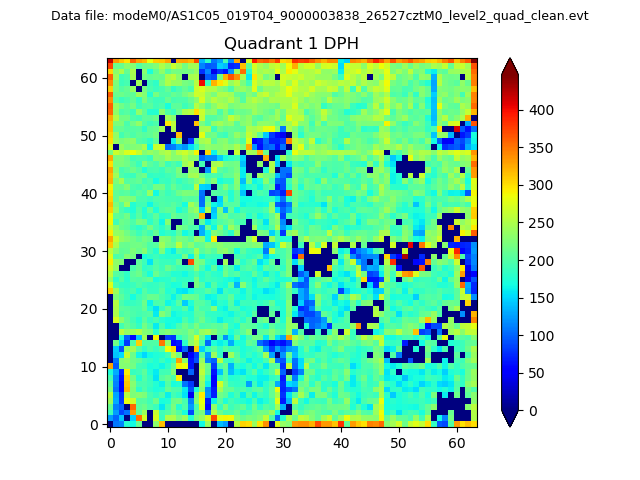 |
Quadrant B |
|---|---|---|---|
| Quadrant D | 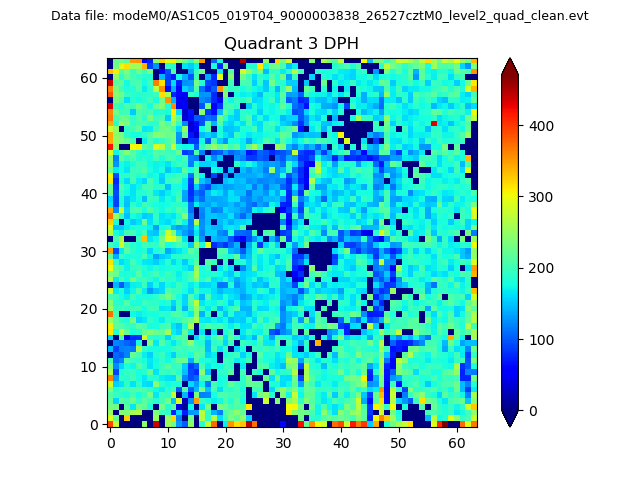 |
 |
Quadrant C |
| Plot type | Count rate plots | Images |
|---|---|---|
| Comparison with Poisson distribution Blue bars denote a histogram of data divided into 1 sec bins. Red curve is a Poisson curve with rate = median count rate of data. |
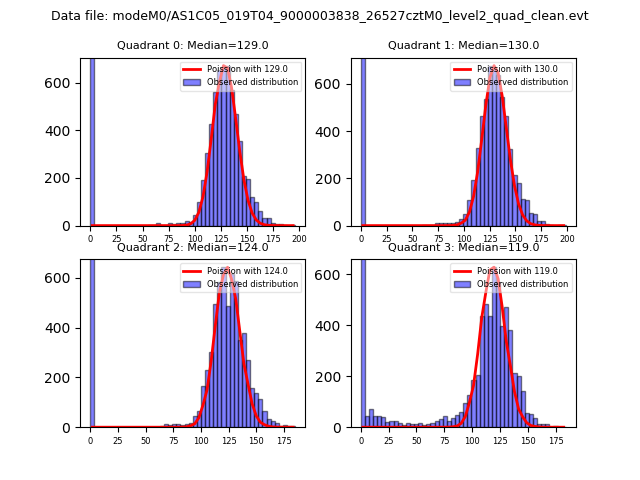 |
 |
| Quadrant-wise count rates Data is divided into 100 sec bins |
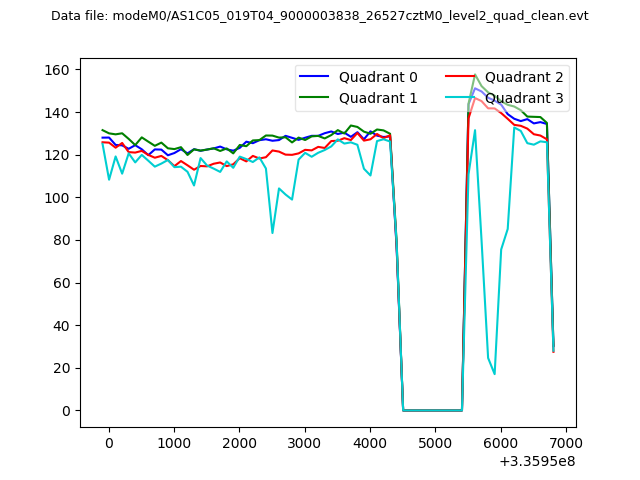 |
|
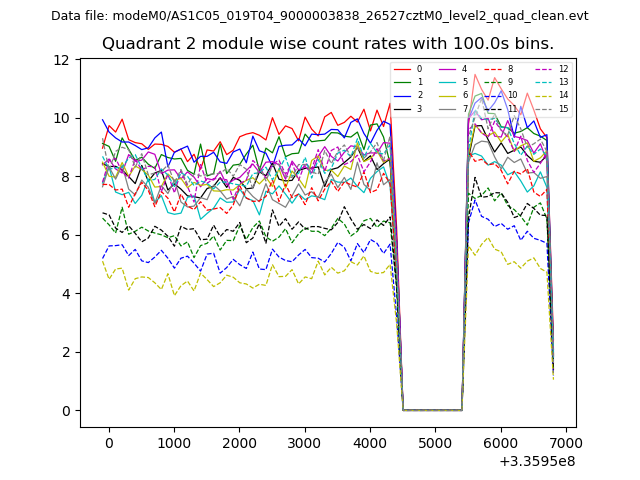
| Module-wise count rates for Quadrant A Data is divided into 100 sec bins |
 |
 |
| Module-wise count rates for Quadrant B Data is divided into 100 sec bins |
 |
 |
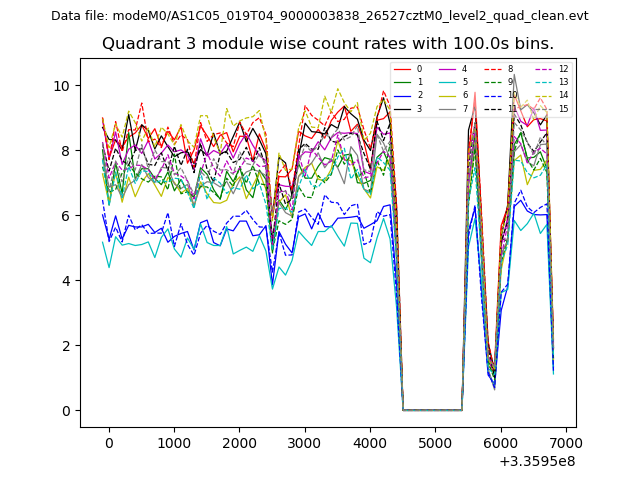
| Module-wise count rates for Quadrant C Data is divided into 100 sec bins |
 |
 |
| Module-wise count rates for Quadrant D Data is divided into 100 sec bins |
 |
 |
| Parameter | Plot |
|---|---|
| CZT HV Monitor | 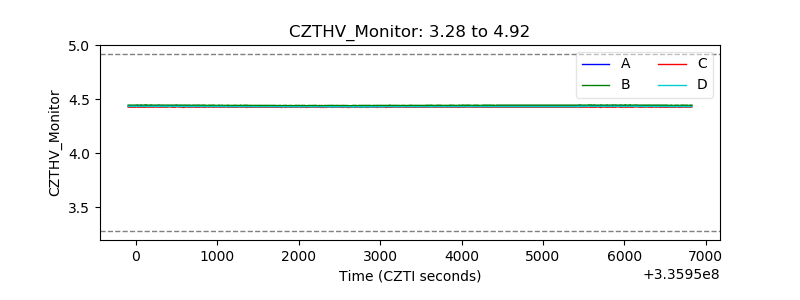 |
| D_VDD | 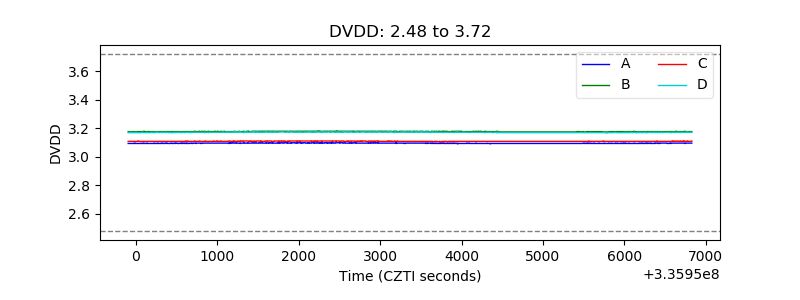 |
| Temperature 1 |  |
| Veto HV Monitor | 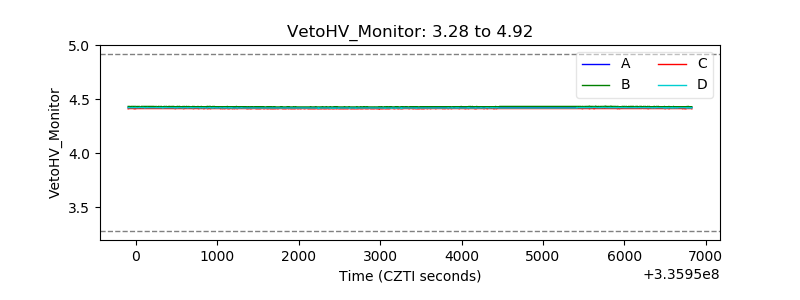 |
| Veto LLD | 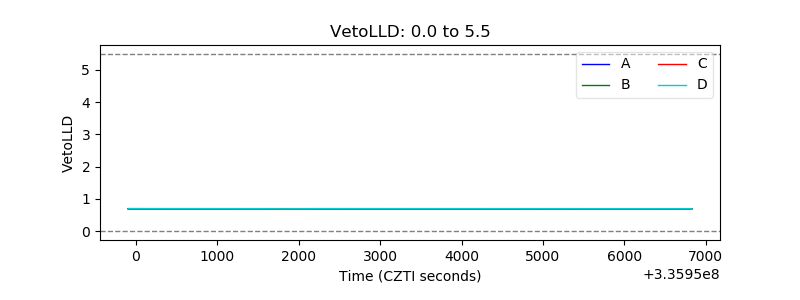 |
| Alpha Counter | 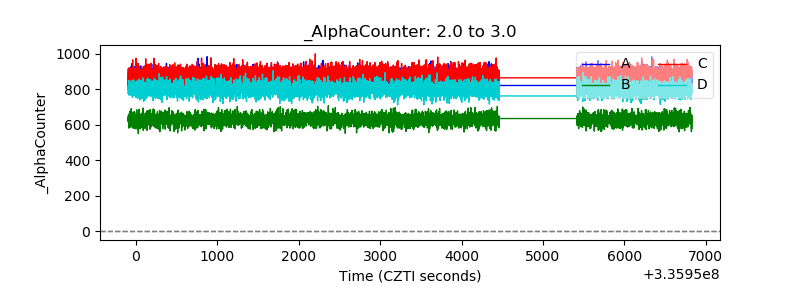 |
| _CPM_Rate | 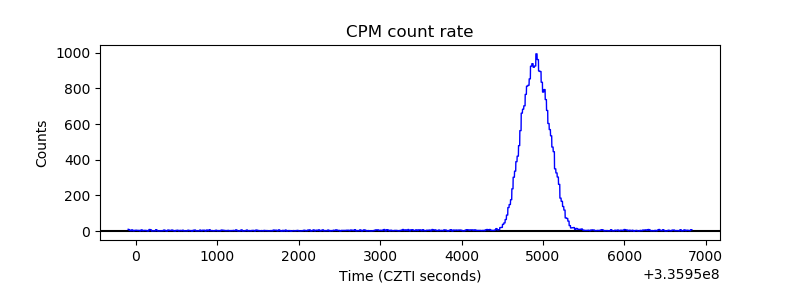 |
| CZT Counter | 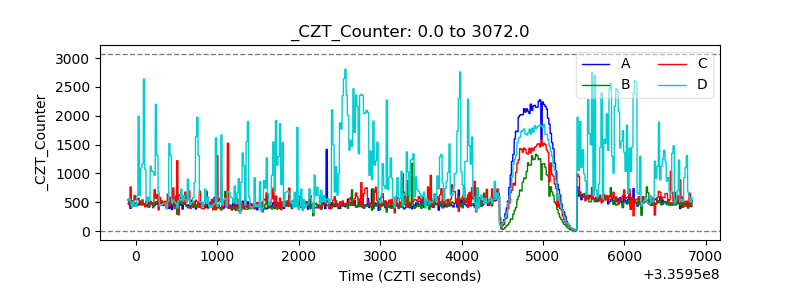 |
| +2.5 Volts monitor |  |
| +5 Volts monitor |  |
| _ROLL_ROT | 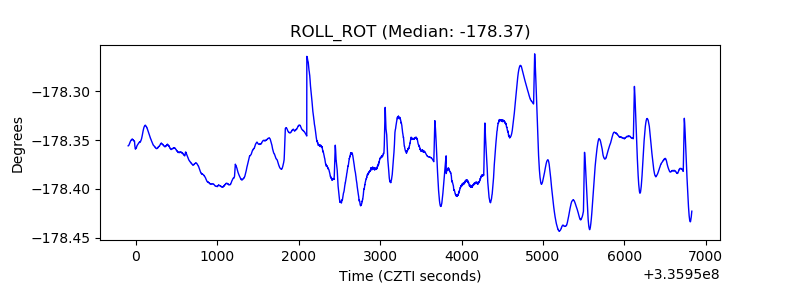 |
| _Roll_DEC |  |
| _Roll_RA | 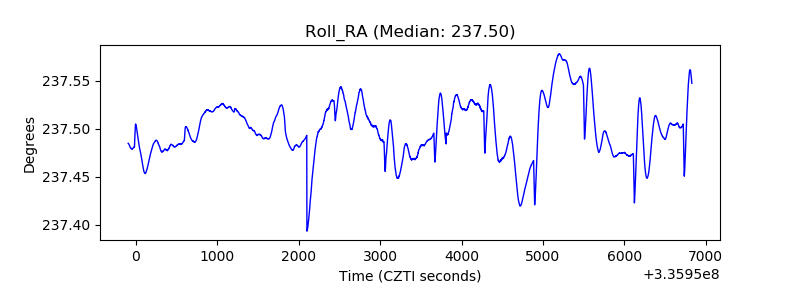 |
| Veto Counter | 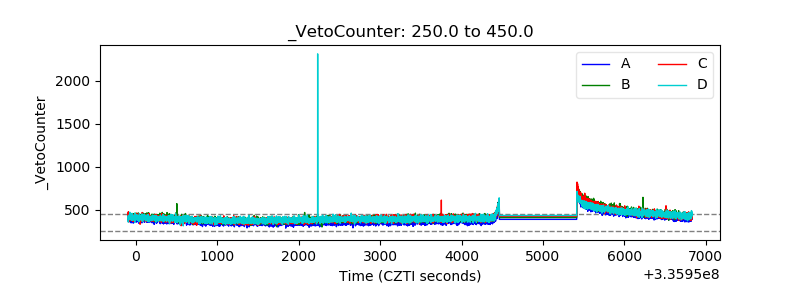 |