| Param | Original file | Final file |
|---|---|---|
| Filename | modeM0/AS1C05_019T04_9000003838_26529cztM0_level2.evt | modeM0/AS1C05_019T04_9000003838_26529cztM0_level2_quad_clean.evt |
| Size (bytes) | 572,077,440 | 108,967,680 |
| Size | 545.6 MB | 103.9 MB |
| Events in quadrant A | 2,782,509 | 770,886 |
| Events in quadrant B | 3,026,284 | 767,988 |
| Events in quadrant C | 3,074,252 | 731,846 |
| Events in quadrant D | 8,053,954 | 628,047 |
| Mode M9 | |||
|---|---|---|---|
| Quadrant | BADHDUFLAG | Total packets | Discarded packets |
| A | 0 | 11 | 0 |
| B | 0 | 11 | 0 |
| C | 0 | 11 | 0 |
| D | 0 | 11 | 0 |
| Mode M0 | |||
|---|---|---|---|
| Quadrant | BADHDUFLAG | Total packets | Discarded packets |
| A | 0 | 12031 | 0 |
| B | 0 | 12623 | 0 |
| C | 0 | 12691 | 0 |
| D | 0 | 27885 | 0 |
| Quadrant | Total seconds | Saturated seconds | Saturation percentage |
|---|---|---|---|
| A | 5737 | 45 | 0.784382% |
| B | 5737 | 91 | 1.586195% |
| C | 5737 | 58 | 1.010981% |
| D | 5737 | 1559 | 27.174481% |
Noise dominated data is calculated using 1-second bins in cleaned event files. If a bin has >2000 counts, and if more than 50% of those come from <1% of pixels, then it is considered to be noise-dominated and hence unusable.
| Quadrant | # 1 sec bins | Bins with >0 counts | Bins with >2000 counts | High rate bins dominated by noise | Noise dominated (total time) | Noise dominated (detector-on time) | Marked lightcurve |
|---|---|---|---|---|---|---|---|
| A | 6817 | 5737 | 0 | 0 | 0.00% | 0.00% |  |
| B | 6817 | 5738 | 46 | 46 | 0.67% | 0.80% | 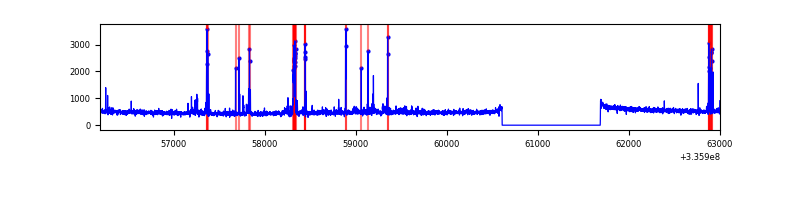 |
| C | 6817 | 5738 | 10 | 10 | 0.15% | 0.17% | 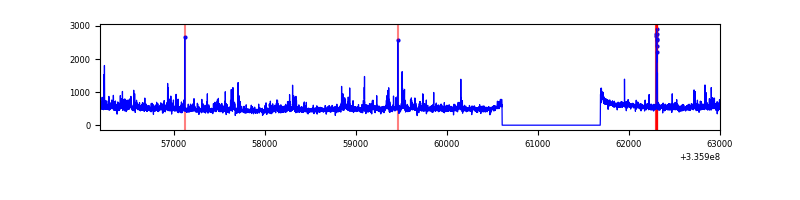 |
| D | 6817 | 5737 | 1362 | 1362 | 19.98% | 23.74% | 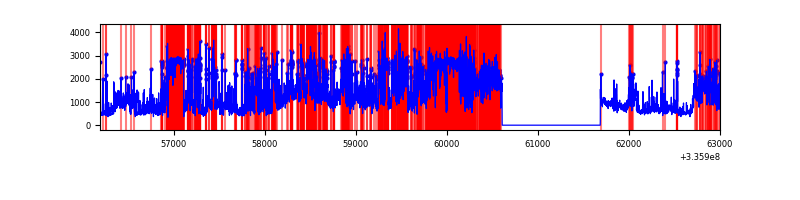 |
Top three noisy pixels from each quadrant. If the there are fewer than three noisy pixels in the level2.evt file, extra rows are filled as -1
| Pixel properties | Quadrant properties | ||||||
|---|---|---|---|---|---|---|---|
| Quadrant | DetID | PixID | Counts | Sigma | Mean | Median | Sigma |
| A | 5 | 168 | 40406 | 280.85 | 710 | 697 | 141.4 |
| A | 13 | 254 | 9506 | 62.3 | 710 | 697 | 141.4 |
| A | 3 | 137 | 6045 | 37.83 | 710 | 697 | 141.4 |
| B | 5 | 172 | 214712 | 1649.68 | 696 | 679 | 129.7 |
| B | 3 | 112 | 58516 | 445.79 | 696 | 679 | 129.7 |
| B | 12 | 111 | 15038 | 110.67 | 696 | 679 | 129.7 |
| C | 3 | 233 | 319840 | 2054.43 | 670 | 672 | 155.4 |
| C | 14 | 238 | 106350 | 680.23 | 670 | 672 | 155.4 |
| C | 4 | 254 | 33072 | 208.55 | 670 | 672 | 155.4 |
| D | 7 | 80 | 3613259 | 25085.38 | 601 | 588 | 144.0 |
| D | 1 | 52 | 1805293 | 12531.37 | 601 | 588 | 144.0 |
| D | 13 | 104 | 153334 | 1060.62 | 601 | 588 | 144.0 |
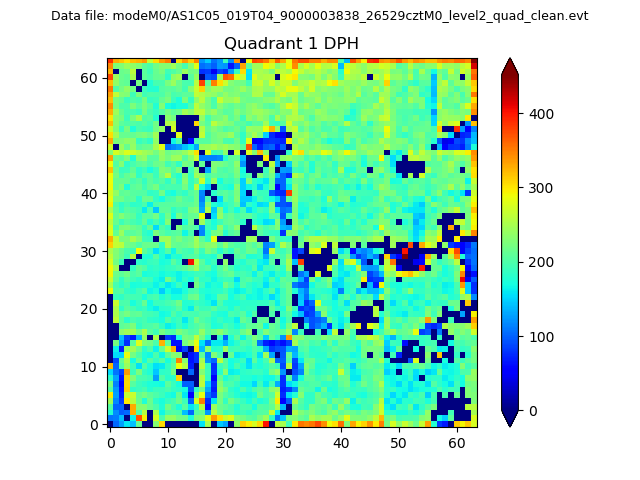
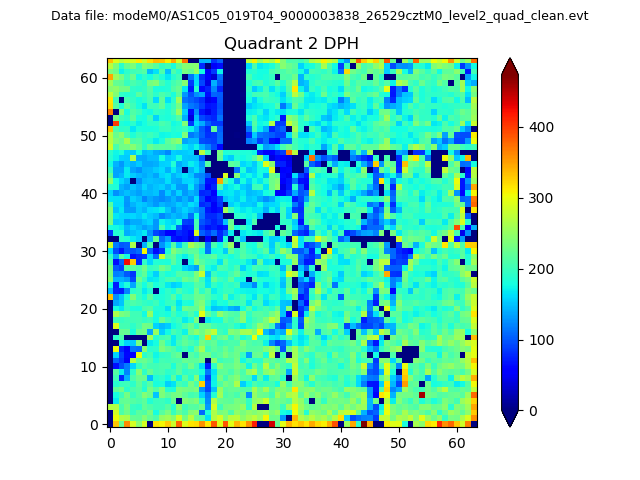
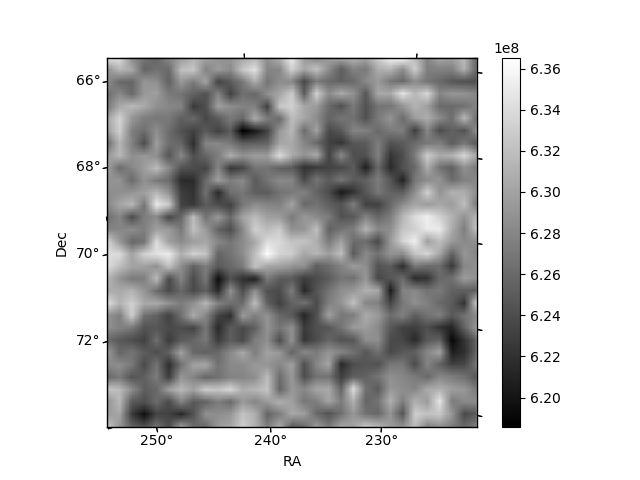
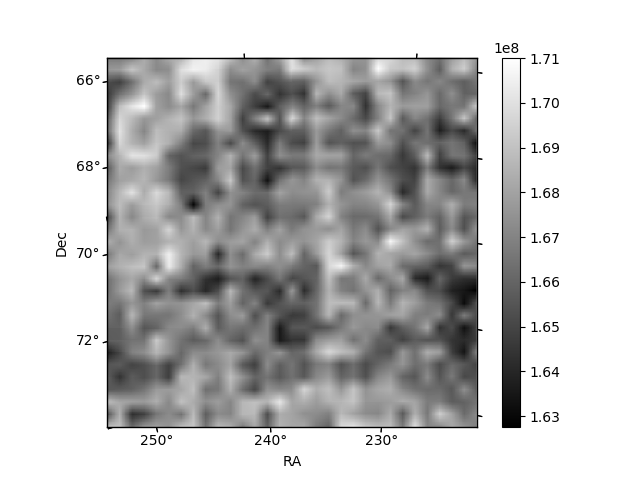
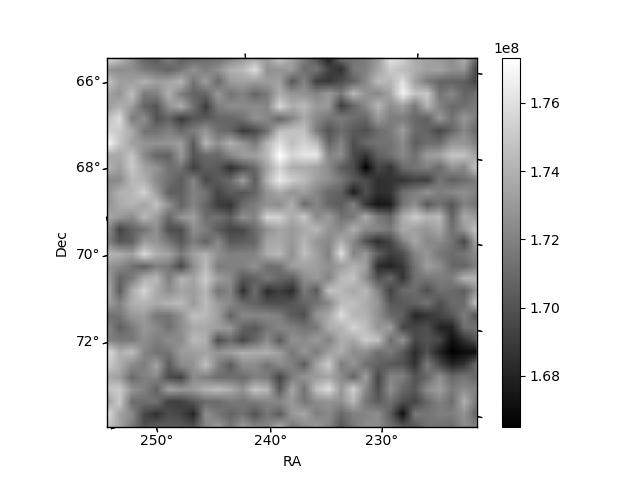
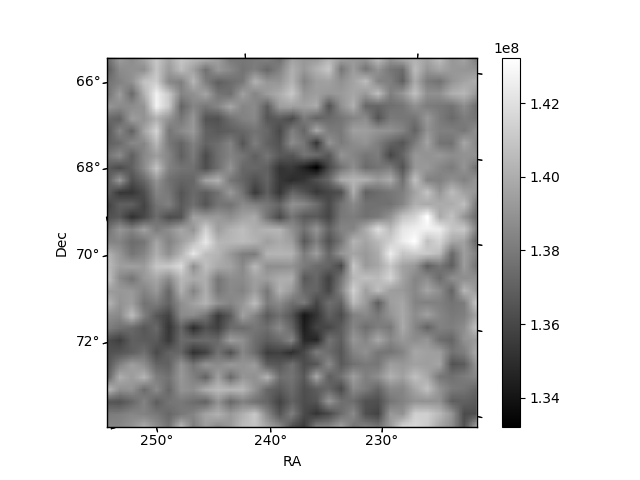
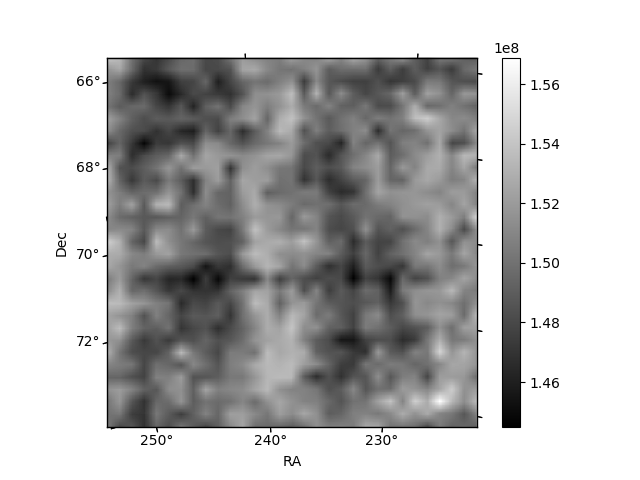
Histogram calculated using DETX and DETY for each event in the final _common_clean file
| Quadrant A | 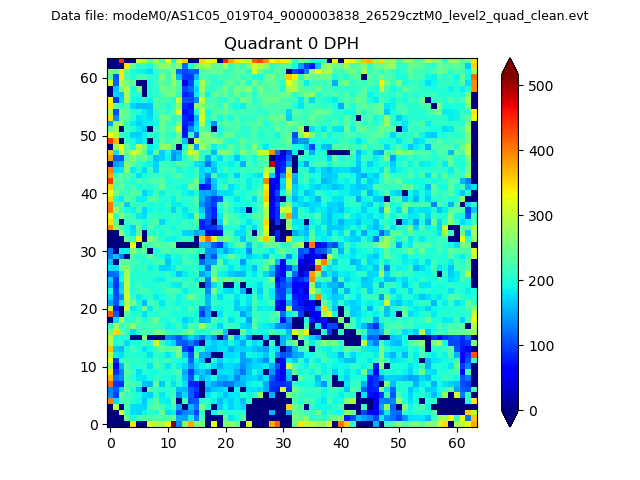 |
 |
Quadrant B |
|---|---|---|---|
| Quadrant D | 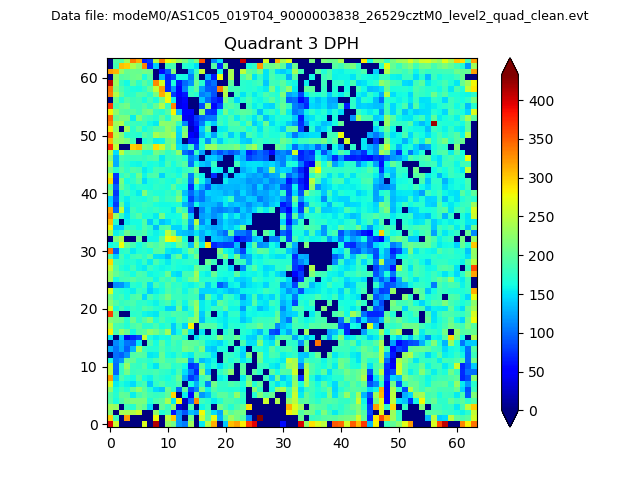 |
 |
Quadrant C |
| Plot type | Count rate plots | Images |
|---|---|---|
| Comparison with Poisson distribution Blue bars denote a histogram of data divided into 1 sec bins. Red curve is a Poisson curve with rate = median count rate of data. |
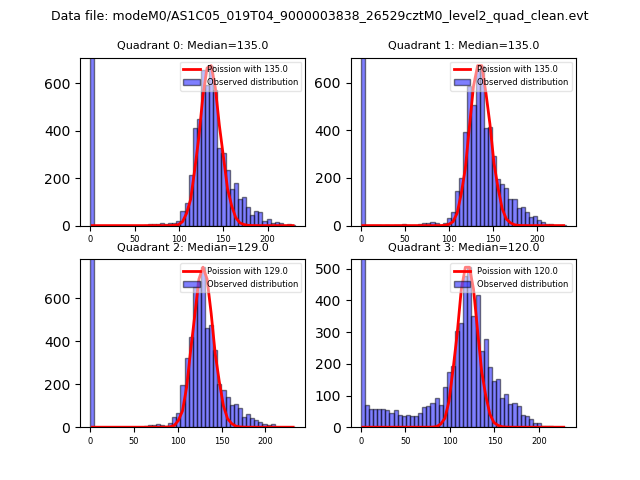 |
 |
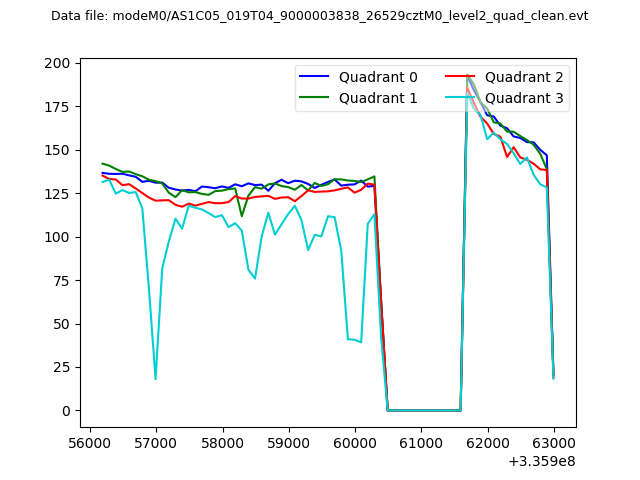
| Quadrant-wise count rates Data is divided into 100 sec bins |
 |
|
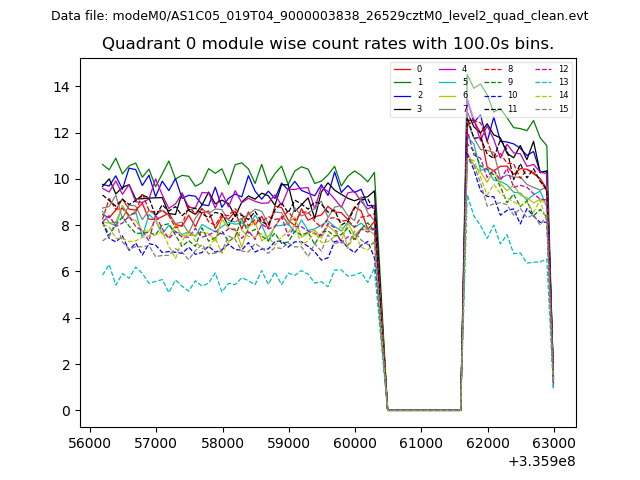
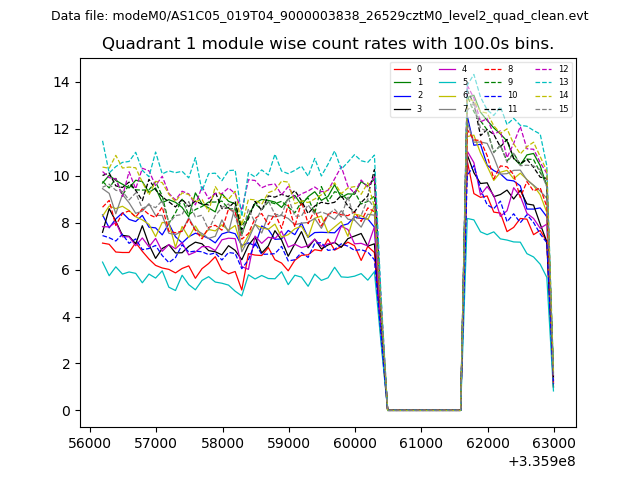
| Module-wise count rates for Quadrant A Data is divided into 100 sec bins |
 |
 |
| Module-wise count rates for Quadrant B Data is divided into 100 sec bins |
 |
 |
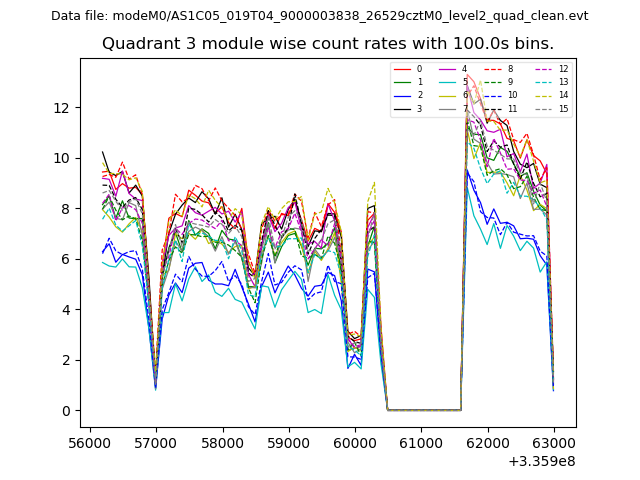
| Module-wise count rates for Quadrant C Data is divided into 100 sec bins |
 |
 |
| Module-wise count rates for Quadrant D Data is divided into 100 sec bins |
 |
 |
| Parameter | Plot |
|---|---|
| CZT HV Monitor | 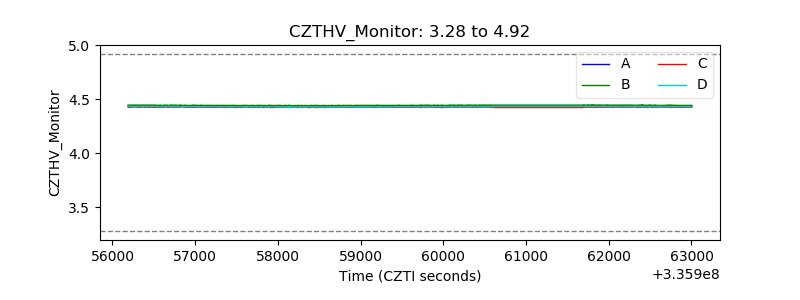 |
| D_VDD | 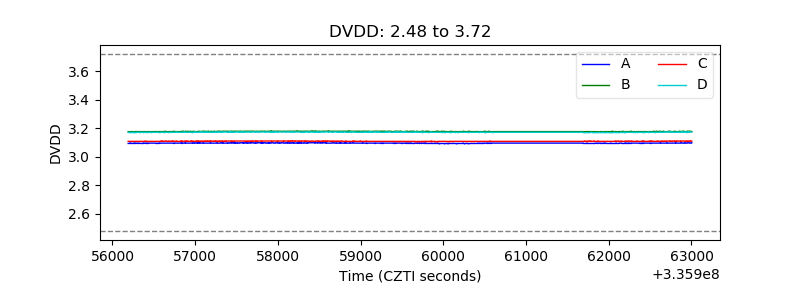 |
| Temperature 1 | 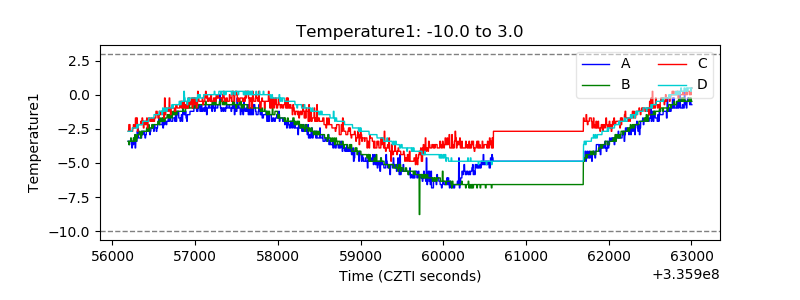 |
| Veto HV Monitor | 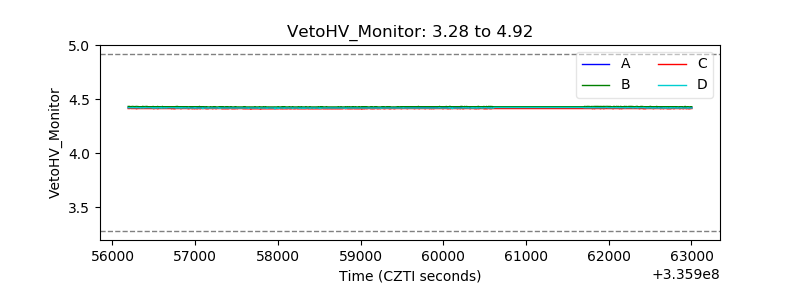 |
| Veto LLD |  |
| Alpha Counter | 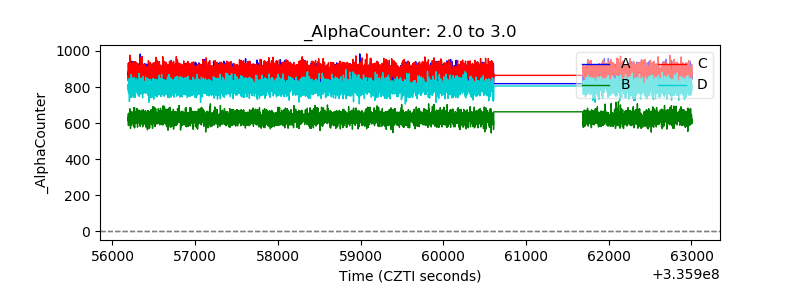 |
| _CPM_Rate | 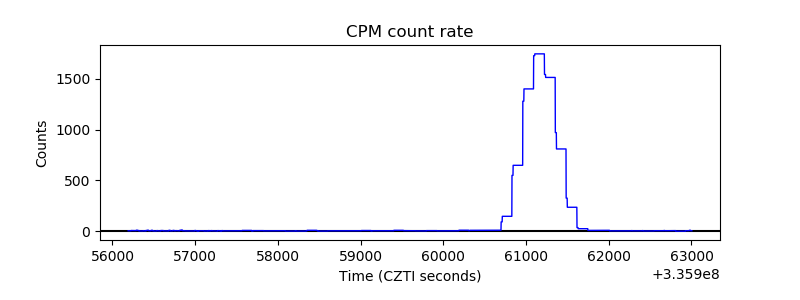 |
| CZT Counter | 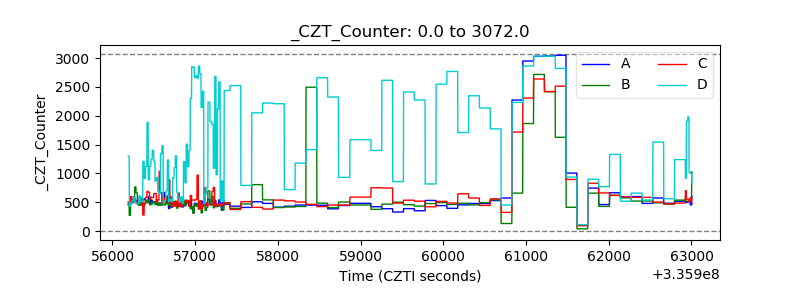 |
| +2.5 Volts monitor |  |
| +5 Volts monitor |  |
| _ROLL_ROT | 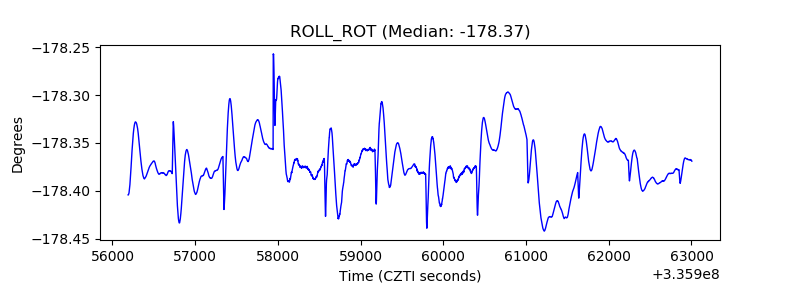 |
| _Roll_DEC | 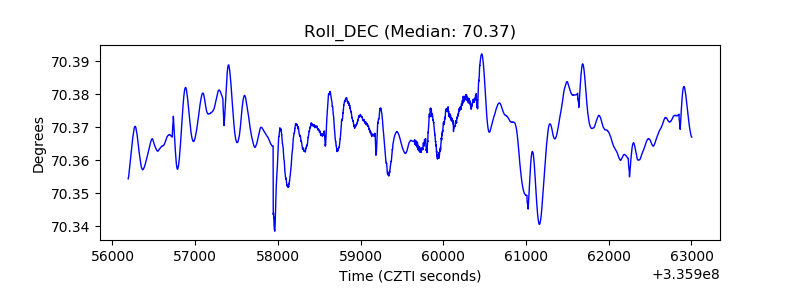 |
| _Roll_RA | 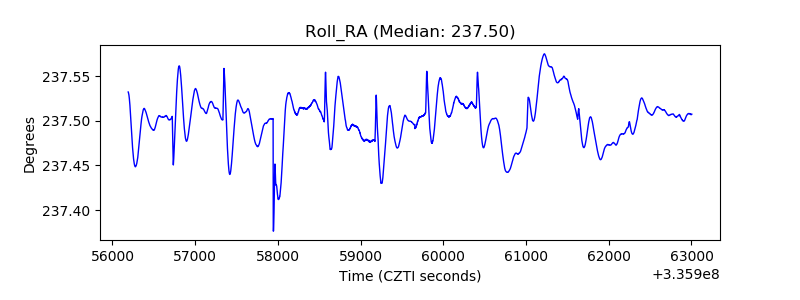 |
| Veto Counter | 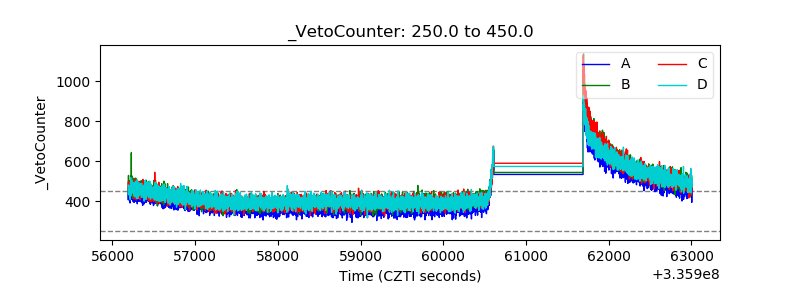 |