| Param | Original file | Final file |
|---|---|---|
| Filename | modeM0/AS1C05_019T04_9000003838_26530cztM0_level2.evt | modeM0/AS1C05_019T04_9000003838_26530cztM0_level2_quad_clean.evt |
| Size (bytes) | 538,873,920 | 117,671,040 |
| Size | 513.9 MB | 112.2 MB |
| Events in quadrant A | 3,029,645 | 821,256 |
| Events in quadrant B | 3,318,930 | 814,332 |
| Events in quadrant C | 3,330,263 | 775,553 |
| Events in quadrant D | 6,237,521 | 736,549 |
| Mode M9 | |||
|---|---|---|---|
| Quadrant | BADHDUFLAG | Total packets | Discarded packets |
| A | 0 | 12 | 0 |
| B | 0 | 12 | 0 |
| C | 0 | 12 | 0 |
| D | 0 | 12 | 0 |
| Mode M0 | |||
|---|---|---|---|
| Quadrant | BADHDUFLAG | Total packets | Discarded packets |
| A | 0 | 12827 | 0 |
| B | 0 | 13626 | 0 |
| C | 0 | 13660 | 0 |
| D | 0 | 22713 | 0 |
| Quadrant | Total seconds | Saturated seconds | Saturation percentage |
|---|---|---|---|
| A | 5954 | 45 | 0.755794% |
| B | 5954 | 104 | 1.746725% |
| C | 5954 | 84 | 1.410816% |
| D | 5954 | 722 | 12.126302% |
Noise dominated data is calculated using 1-second bins in cleaned event files. If a bin has >2000 counts, and if more than 50% of those come from <1% of pixels, then it is considered to be noise-dominated and hence unusable.
| Quadrant | # 1 sec bins | Bins with >0 counts | Bins with >2000 counts | High rate bins dominated by noise | Noise dominated (total time) | Noise dominated (detector-on time) | Marked lightcurve |
|---|---|---|---|---|---|---|---|
| A | 7144 | 5954 | 0 | 0 | 0.00% | 0.00% |  |
| B | 7144 | 5954 | 43 | 43 | 0.60% | 0.72% | 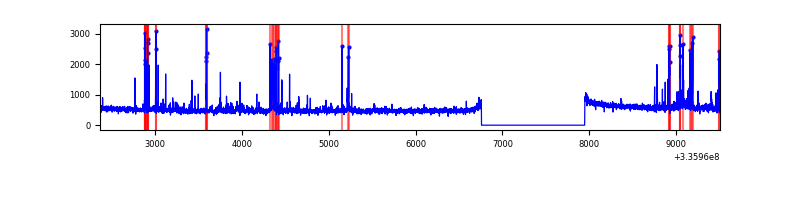 |
| C | 7144 | 5955 | 2 | 2 | 0.03% | 0.03% | 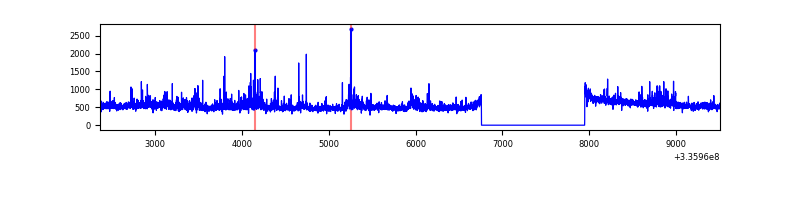 |
| D | 7144 | 5954 | 598 | 598 | 8.37% | 10.04% | 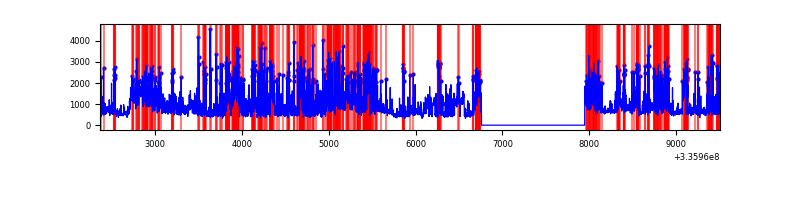 |
Top three noisy pixels from each quadrant. If the there are fewer than three noisy pixels in the level2.evt file, extra rows are filled as -1
| Pixel properties | Quadrant properties | ||||||
|---|---|---|---|---|---|---|---|
| Quadrant | DetID | PixID | Counts | Sigma | Mean | Median | Sigma |
| A | 5 | 168 | 61687 | 400.05 | 768 | 754 | 152.3 |
| A | 13 | 254 | 10277 | 62.52 | 768 | 754 | 152.3 |
| A | 0 | 226 | 6879 | 40.21 | 768 | 754 | 152.3 |
| B | 5 | 172 | 177390 | 1283.78 | 751 | 733 | 137.6 |
| B | 3 | 112 | 72651 | 522.63 | 751 | 733 | 137.6 |
| B | 3 | 64 | 67689 | 486.57 | 751 | 733 | 137.6 |
| C | 3 | 233 | 357683 | 2135.04 | 726 | 733 | 167.2 |
| C | 14 | 238 | 116603 | 693.06 | 726 | 733 | 167.2 |
| C | 4 | 254 | 21833 | 126.21 | 726 | 733 | 167.2 |
| D | 7 | 80 | 1970111 | 11384.28 | 714 | 697 | 173.0 |
| D | 1 | 52 | 1074219 | 6205.54 | 714 | 697 | 173.0 |
| D | 12 | 233 | 261812 | 1509.39 | 714 | 697 | 173.0 |
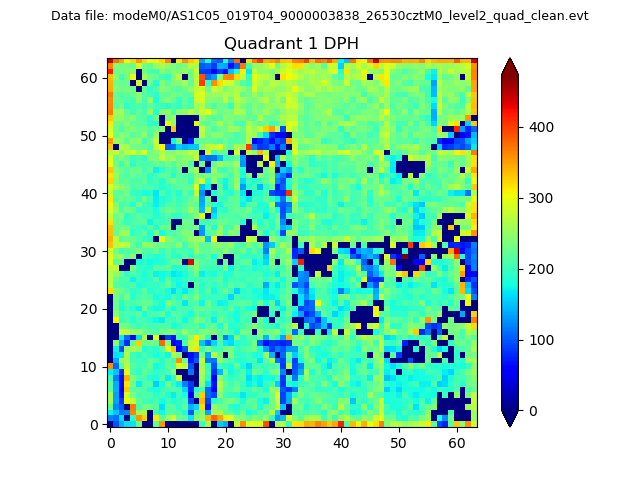
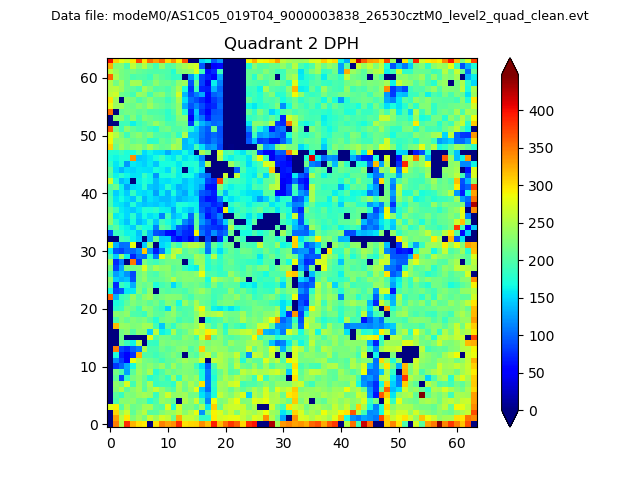
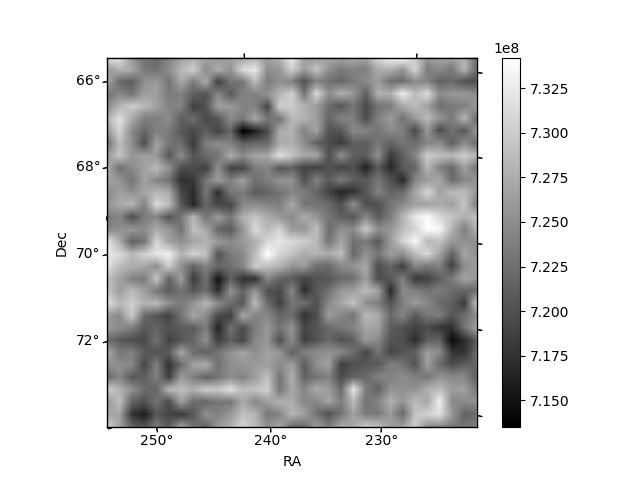
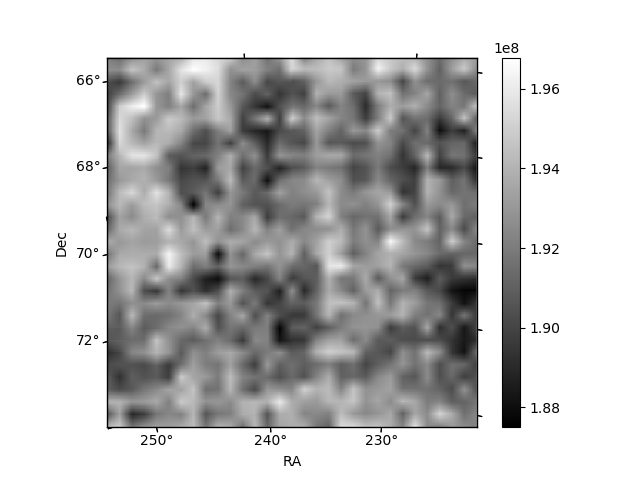
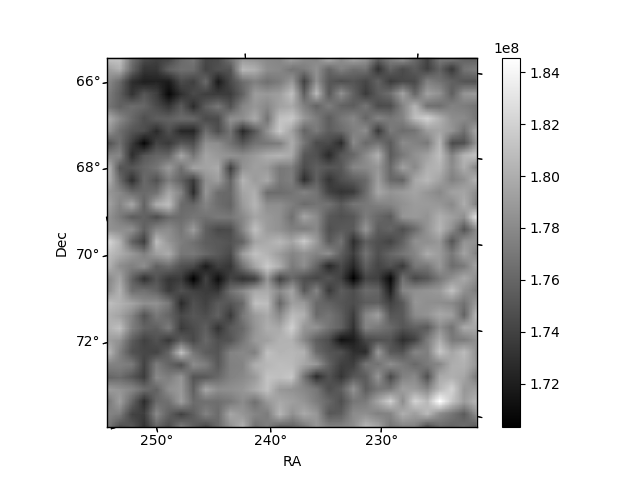
Histogram calculated using DETX and DETY for each event in the final _common_clean file
| Quadrant A | 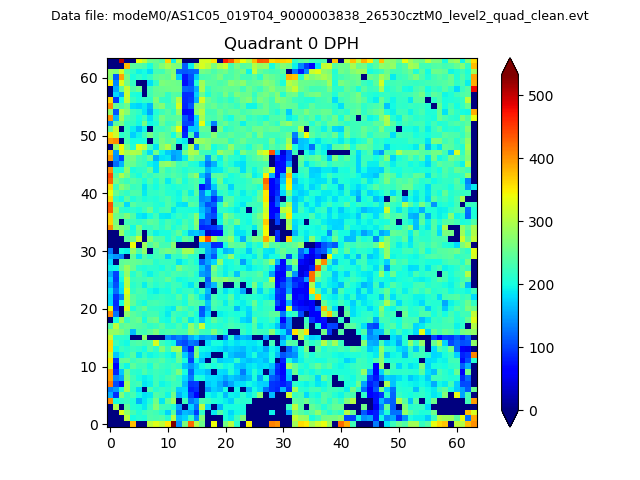 |
 |
Quadrant B |
|---|---|---|---|
| Quadrant D | 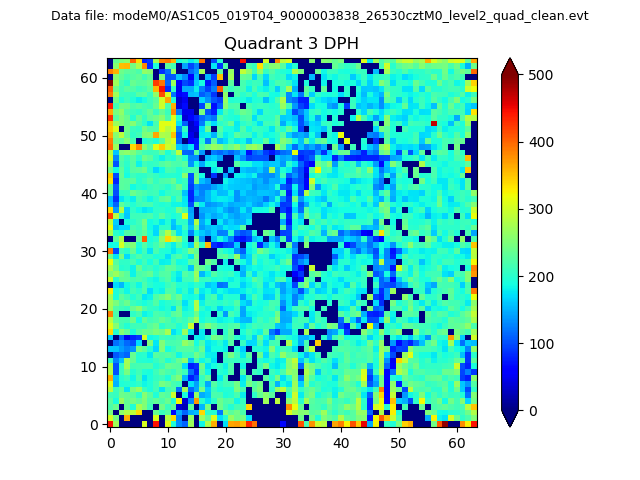 |
 |
Quadrant C |
| Plot type | Count rate plots | Images |
|---|---|---|
| Comparison with Poisson distribution Blue bars denote a histogram of data divided into 1 sec bins. Red curve is a Poisson curve with rate = median count rate of data. |
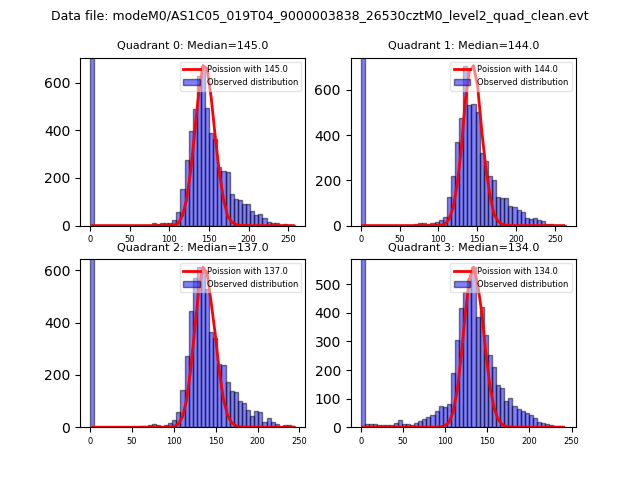 |
 |
| Quadrant-wise count rates Data is divided into 100 sec bins |
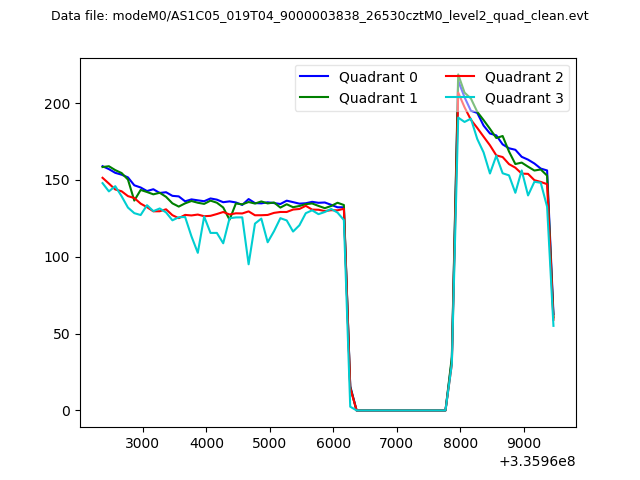 |
|
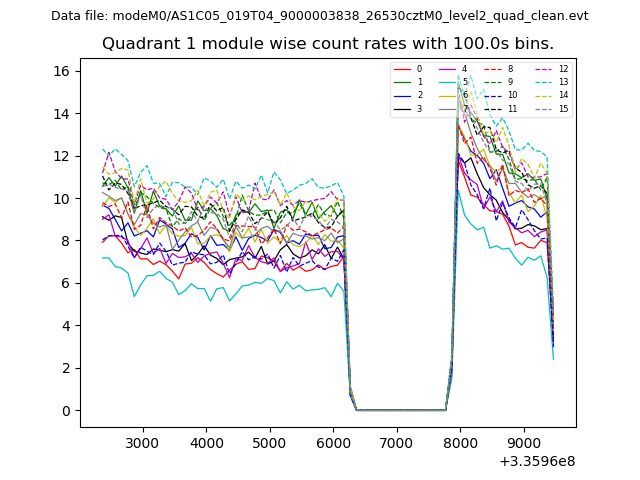
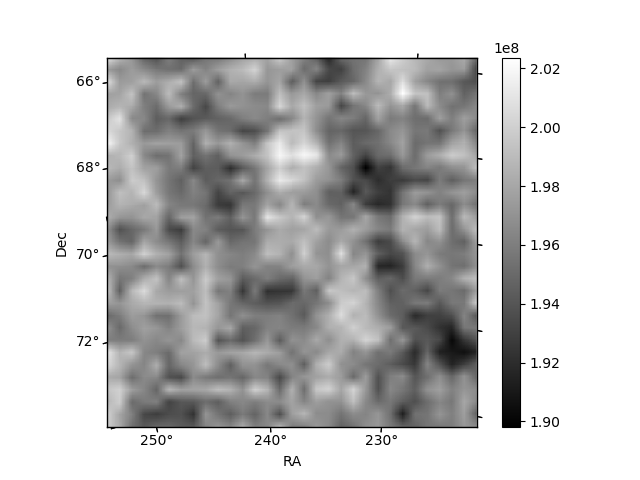
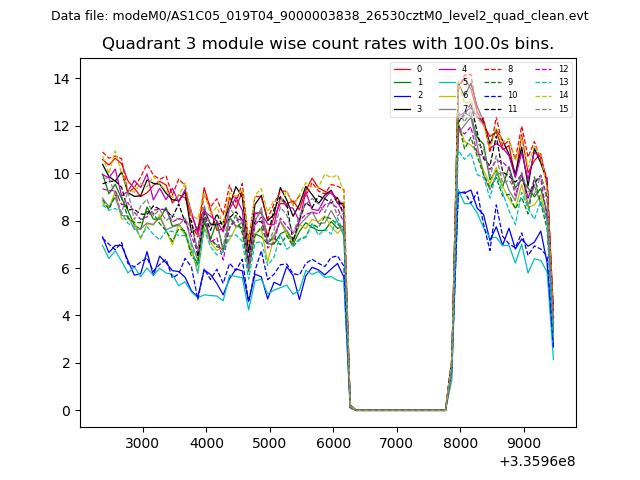
| Module-wise count rates for Quadrant A Data is divided into 100 sec bins |
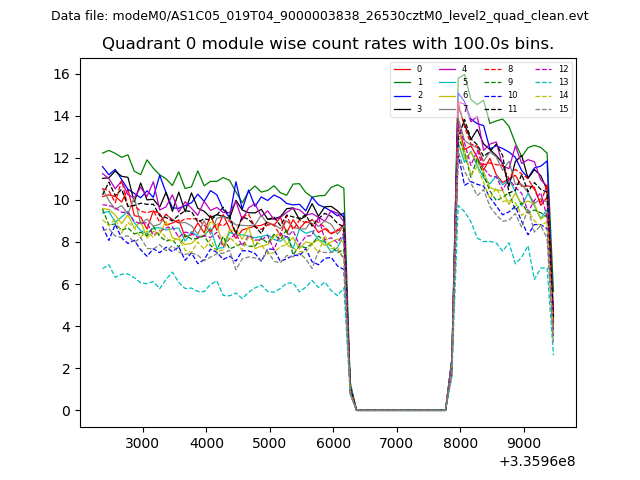 |
 |
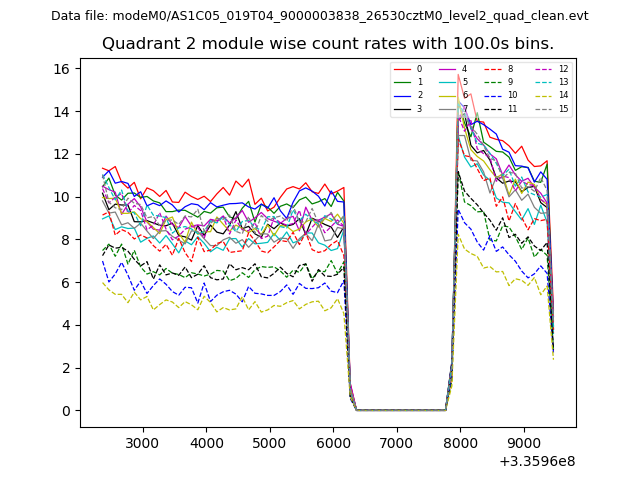
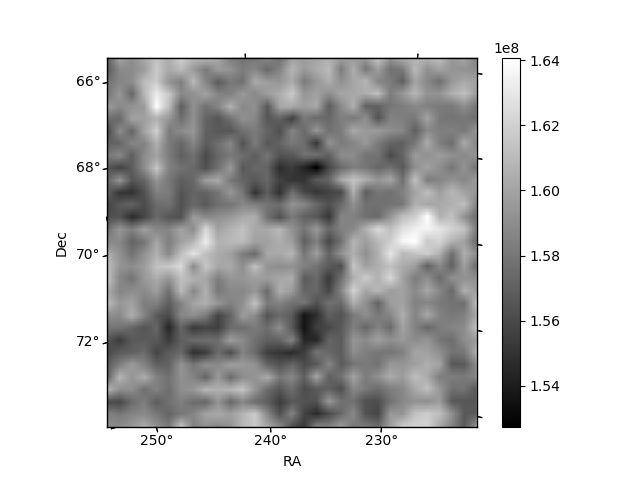
| Module-wise count rates for Quadrant B Data is divided into 100 sec bins |
 |
 |
| Module-wise count rates for Quadrant C Data is divided into 100 sec bins |
 |
 |
| Module-wise count rates for Quadrant D Data is divided into 100 sec bins |
 |
 |
| Parameter | Plot |
|---|---|
| CZT HV Monitor | 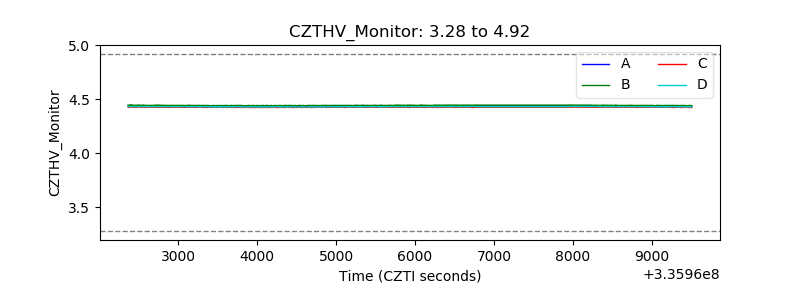 |
| D_VDD | 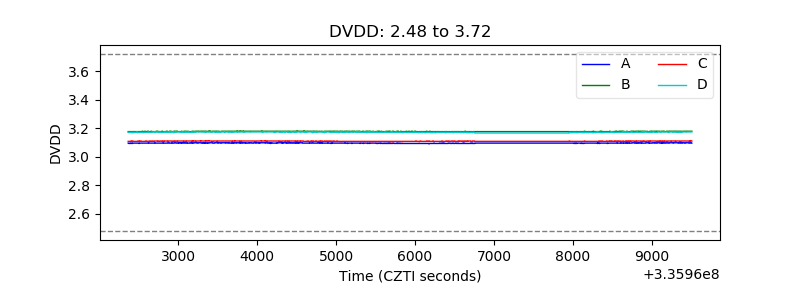 |
| Temperature 1 | 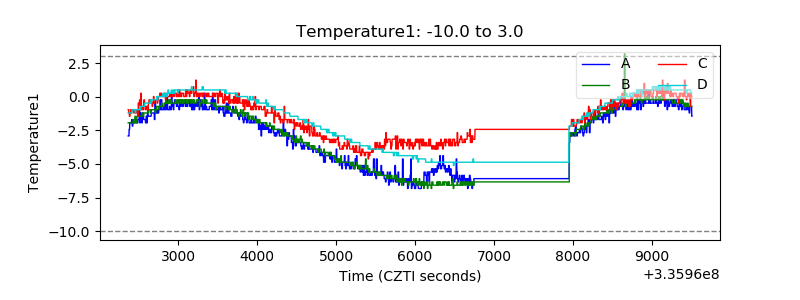 |
| Veto HV Monitor | 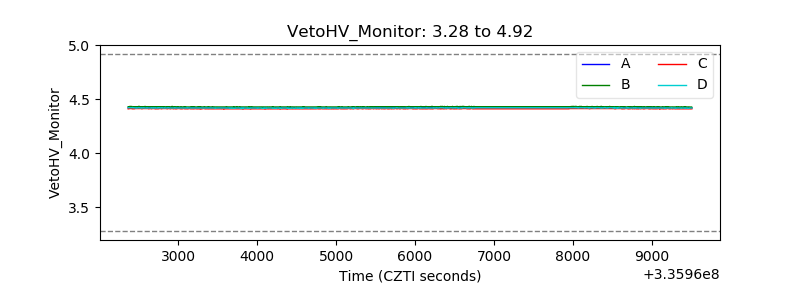 |
| Veto LLD |  |
| Alpha Counter | 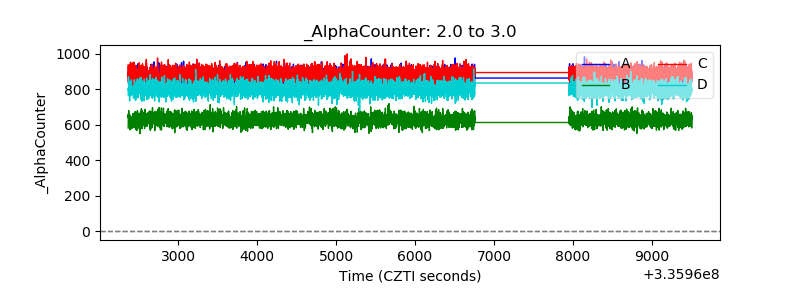 |
| _CPM_Rate | 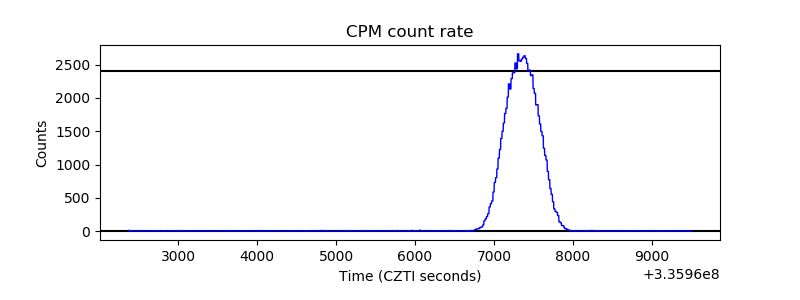 |
| CZT Counter | 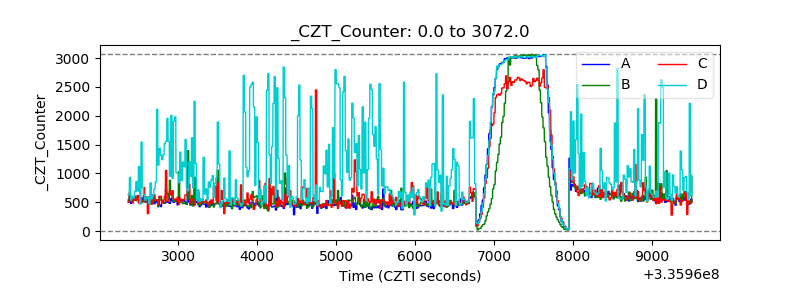 |
| +2.5 Volts monitor |  |
| +5 Volts monitor | 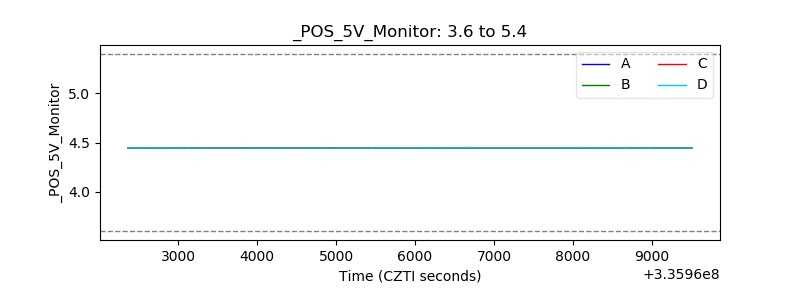 |
| _ROLL_ROT | 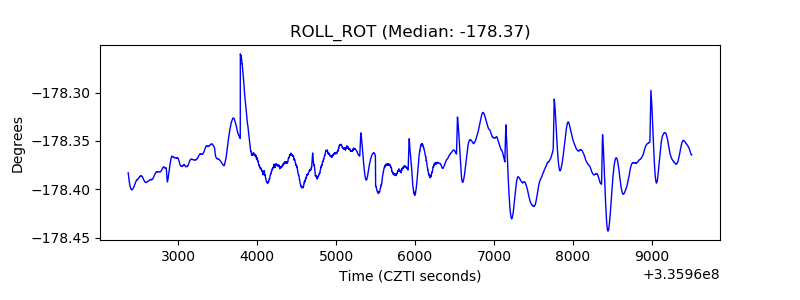 |
| _Roll_DEC | 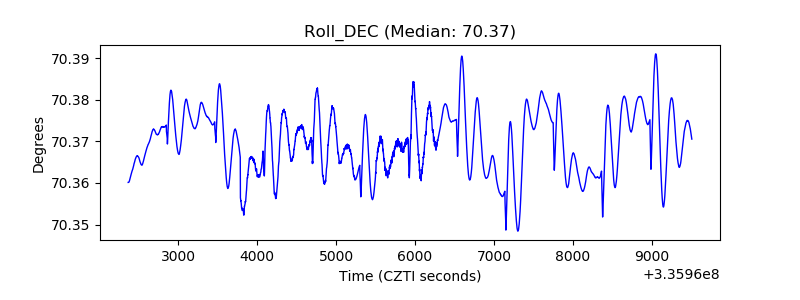 |
| _Roll_RA | 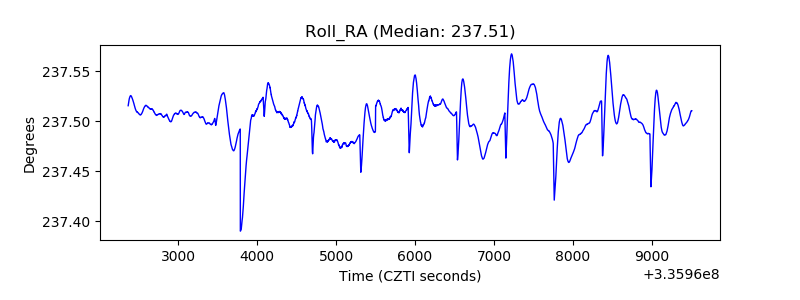 |
| Veto Counter | 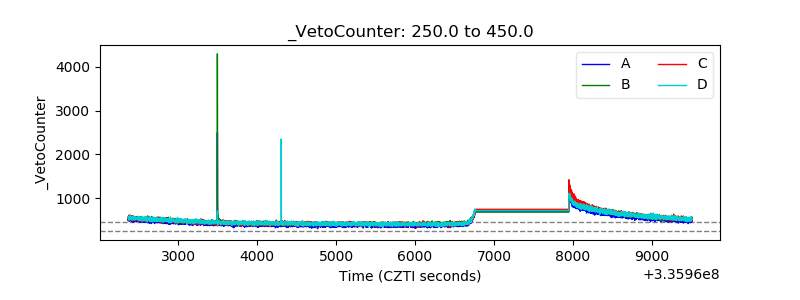 |