| Param | Original file | Final file |
|---|---|---|
| Filename | modeM0/AS1C05_019T04_9000003838_26531cztM0_level2.evt | modeM0/AS1C05_019T04_9000003838_26531cztM0_level2_quad_clean.evt |
| Size (bytes) | 609,353,280 | 103,487,040 |
| Size | 581.1 MB | 98.7 MB |
| Events in quadrant A | 2,907,958 | 754,885 |
| Events in quadrant B | 3,474,224 | 744,833 |
| Events in quadrant C | 3,289,258 | 722,357 |
| Events in quadrant D | 8,404,033 | 520,024 |
| Mode M9 | |||
|---|---|---|---|
| Quadrant | BADHDUFLAG | Total packets | Discarded packets |
| A | 0 | 13 | 0 |
| B | 0 | 13 | 0 |
| C | 0 | 13 | 0 |
| D | 0 | 13 | 0 |
| Mode M0 | |||
|---|---|---|---|
| Quadrant | BADHDUFLAG | Total packets | Discarded packets |
| A | 0 | 12130 | 0 |
| B | 0 | 13951 | 0 |
| C | 0 | 13343 | 0 |
| D | 0 | 28837 | 0 |
| Quadrant | Total seconds | Saturated seconds | Saturation percentage |
|---|---|---|---|
| A | 5589 | 48 | 0.858830% |
| B | 5589 | 149 | 2.665951% |
| C | 5590 | 98 | 1.753131% |
| D | 5590 | 2478 | 44.329159% |
Noise dominated data is calculated using 1-second bins in cleaned event files. If a bin has >2000 counts, and if more than 50% of those come from <1% of pixels, then it is considered to be noise-dominated and hence unusable.
| Quadrant | # 1 sec bins | Bins with >0 counts | Bins with >2000 counts | High rate bins dominated by noise | Noise dominated (total time) | Noise dominated (detector-on time) | Marked lightcurve |
|---|---|---|---|---|---|---|---|
| A | 6909 | 5589 | 0 | 0 | 0.00% | 0.00% | 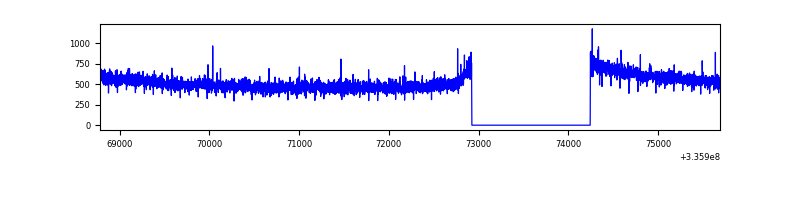 |
| B | 6909 | 5589 | 97 | 97 | 1.40% | 1.74% | 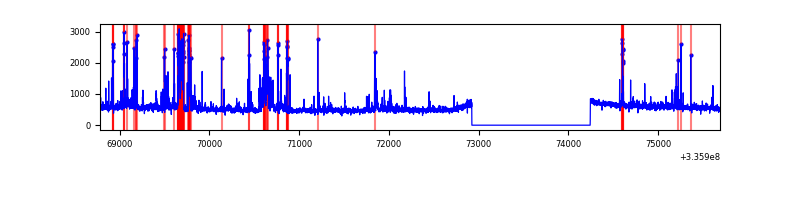 |
| C | 6910 | 5590 | 9 | 9 | 0.13% | 0.16% | 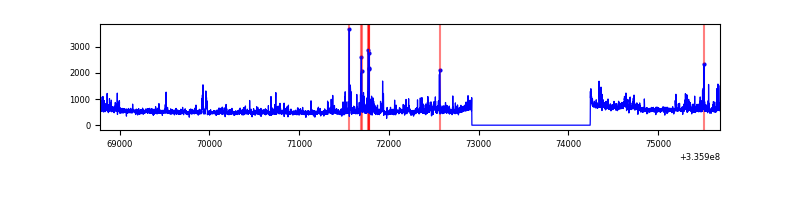 |
| D | 6909 | 5589 | 1943 | 1943 | 28.12% | 34.76% | 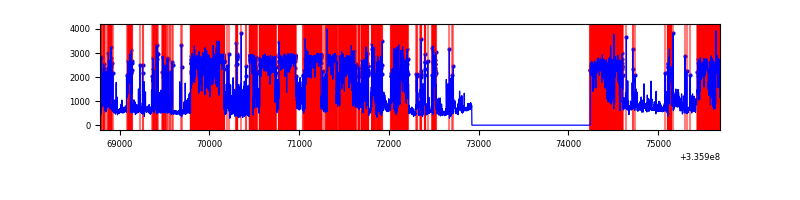 |
Top three noisy pixels from each quadrant. If the there are fewer than three noisy pixels in the level2.evt file, extra rows are filled as -1
| Pixel properties | Quadrant properties | ||||||
|---|---|---|---|---|---|---|---|
| Quadrant | DetID | PixID | Counts | Sigma | Mean | Median | Sigma |
| A | 5 | 168 | 61163 | 417.57 | 735 | 723 | 144.7 |
| A | 13 | 254 | 9829 | 62.91 | 735 | 723 | 144.7 |
| A | 0 | 226 | 6691 | 41.23 | 735 | 723 | 144.7 |
| B | 3 | 64 | 355305 | 2707.31 | 718 | 702 | 131.0 |
| B | 15 | 222 | 105710 | 801.71 | 718 | 702 | 131.0 |
| B | 3 | 112 | 74657 | 564.63 | 718 | 702 | 131.0 |
| C | 3 | 233 | 368638 | 2287.32 | 705 | 713 | 160.9 |
| C | 14 | 238 | 113290 | 699.87 | 705 | 713 | 160.9 |
| C | 4 | 254 | 38887 | 237.32 | 705 | 713 | 160.9 |
| D | 7 | 80 | 5112155 | 37080.61 | 566 | 552 | 137.9 |
| D | 1 | 52 | 577059 | 4182.1 | 566 | 552 | 137.9 |
| D | 12 | 233 | 454014 | 3289.51 | 566 | 552 | 137.9 |
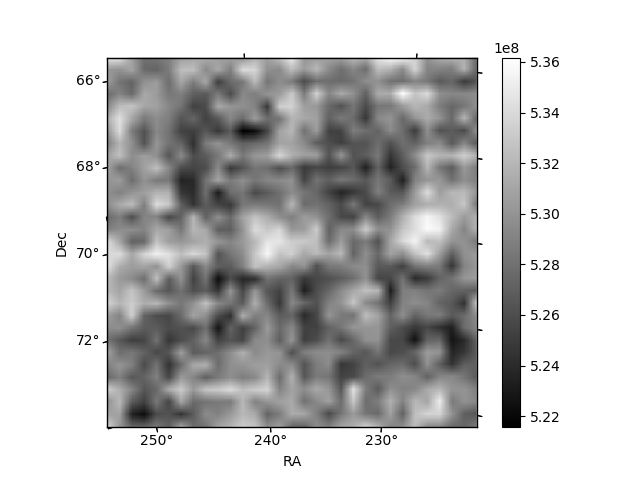
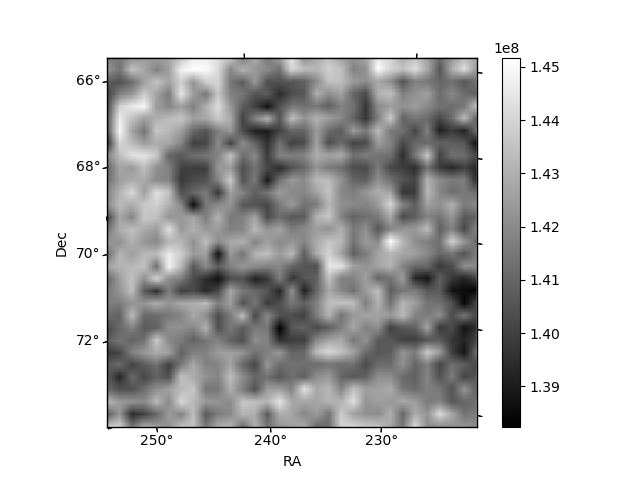
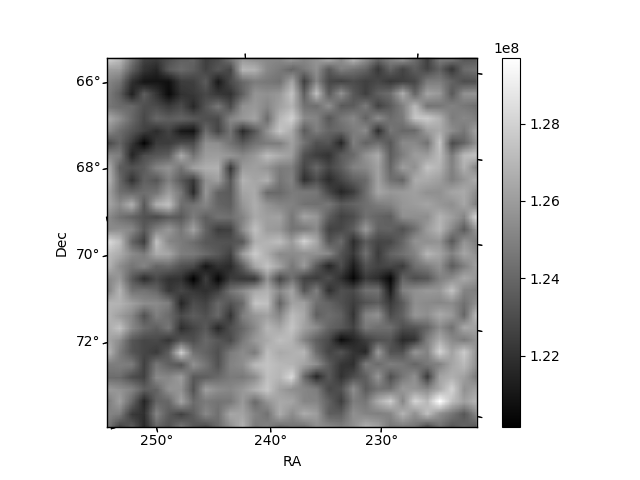
Histogram calculated using DETX and DETY for each event in the final _common_clean file
| Quadrant A | 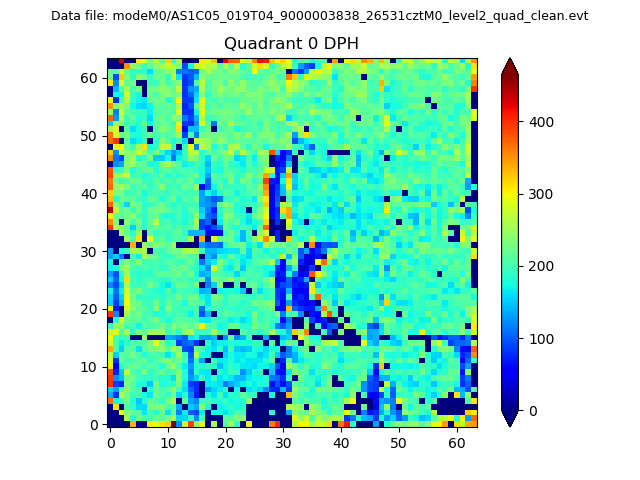 |
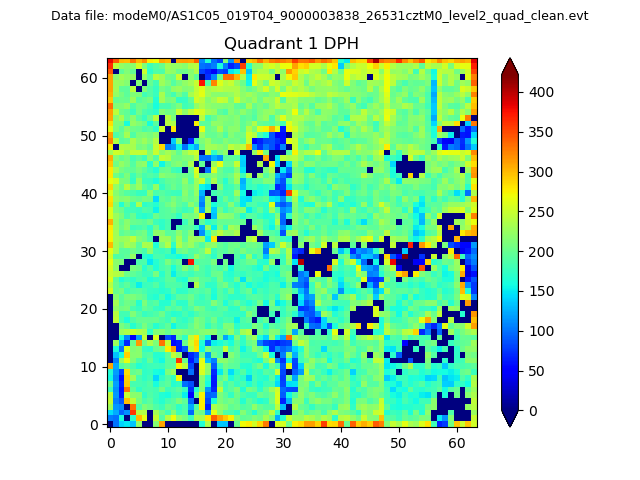 |
Quadrant B |
|---|---|---|---|
| Quadrant D |  |
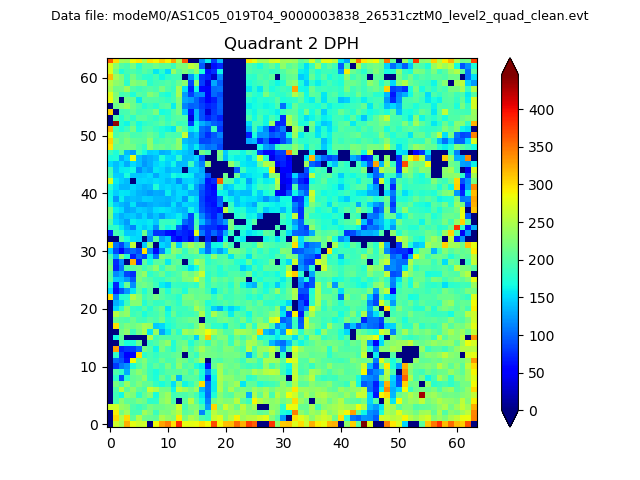 |
Quadrant C |
| Plot type | Count rate plots | Images |
|---|---|---|
| Comparison with Poisson distribution Blue bars denote a histogram of data divided into 1 sec bins. Red curve is a Poisson curve with rate = median count rate of data. |
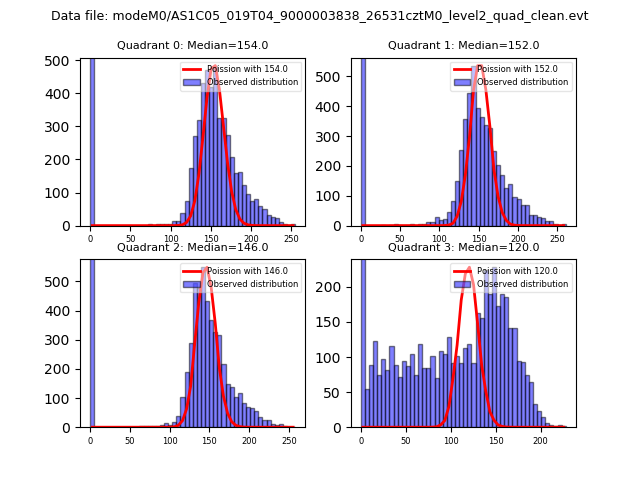 |
 |
| Quadrant-wise count rates Data is divided into 100 sec bins |
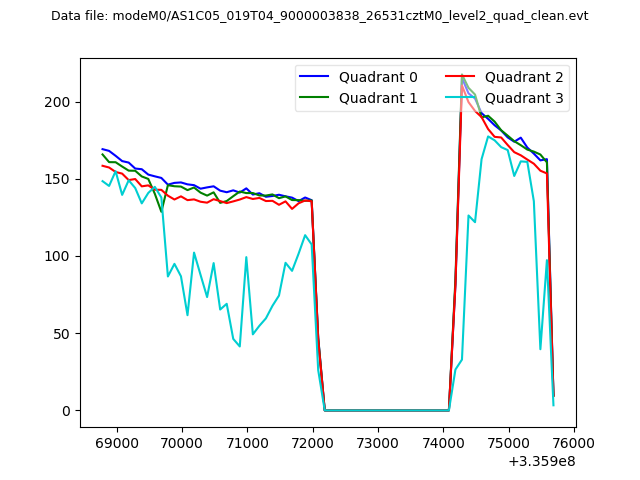 |
|
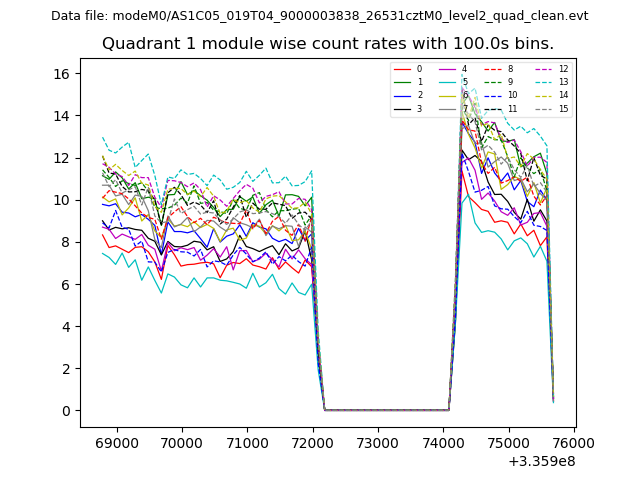
| Module-wise count rates for Quadrant A Data is divided into 100 sec bins |
 |
 |
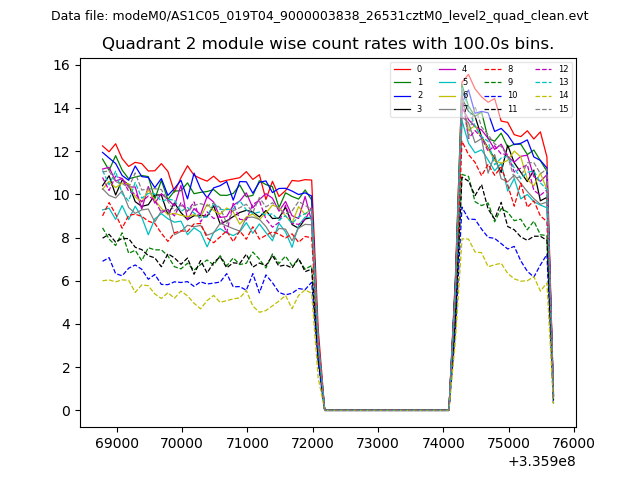
| Module-wise count rates for Quadrant B Data is divided into 100 sec bins |
 |
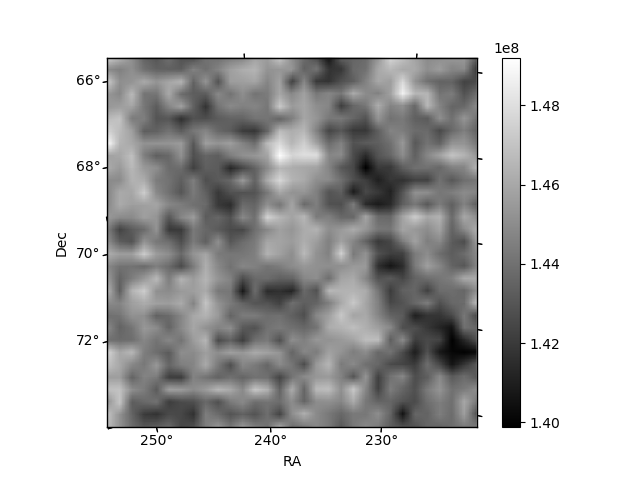 |
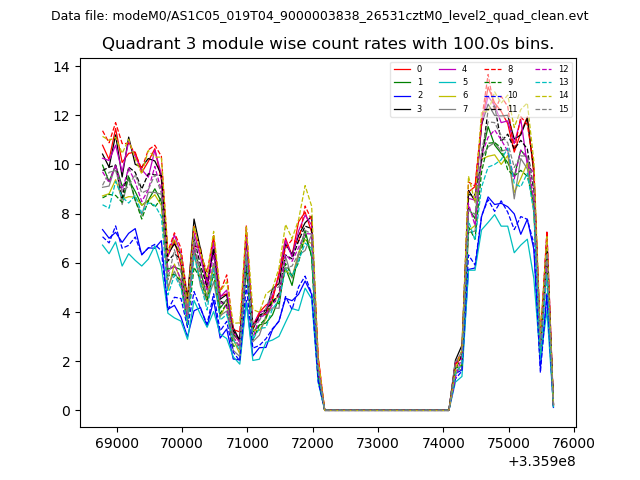
| Module-wise count rates for Quadrant C Data is divided into 100 sec bins |
 |
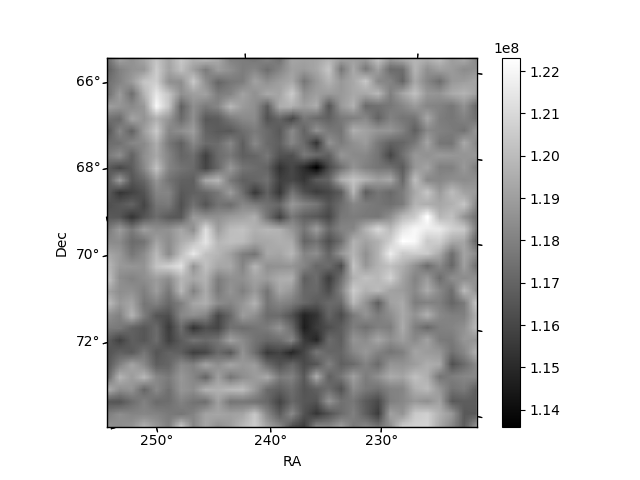 |
| Module-wise count rates for Quadrant D Data is divided into 100 sec bins |
 |
 |
| Parameter | Plot |
|---|---|
| CZT HV Monitor |  |
| D_VDD | 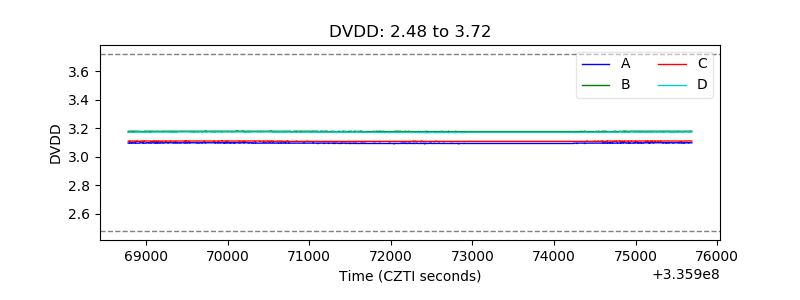 |
| Temperature 1 | 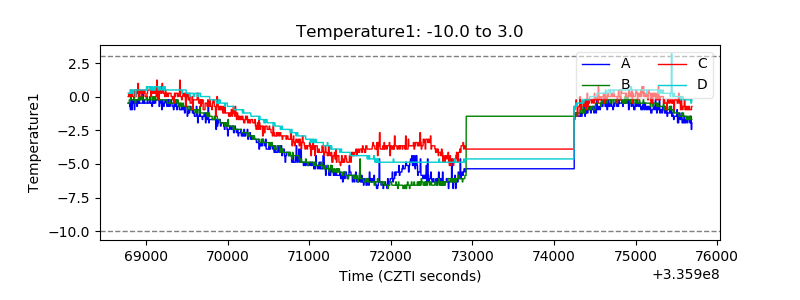 |
| Veto HV Monitor | 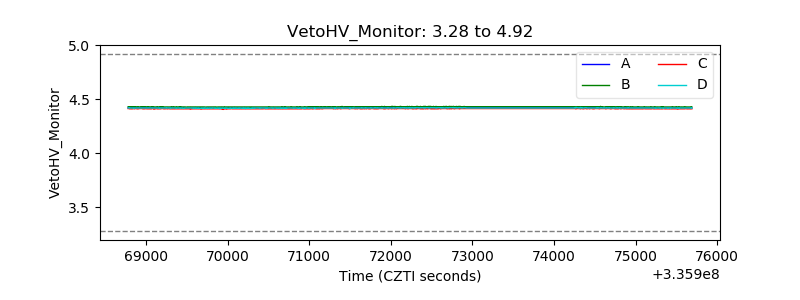 |
| Veto LLD |  |
| Alpha Counter | 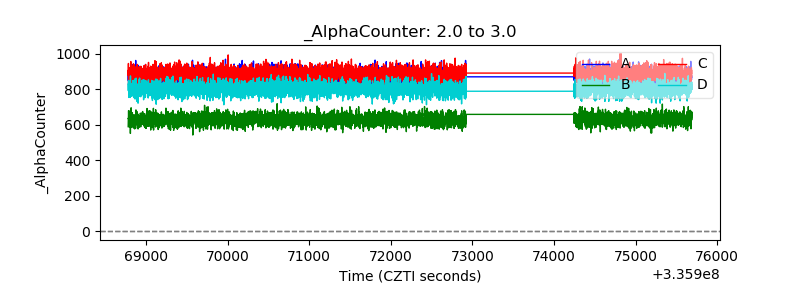 |
| _CPM_Rate | 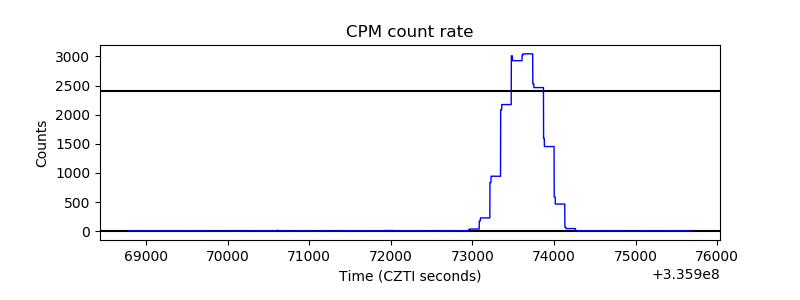 |
| CZT Counter | 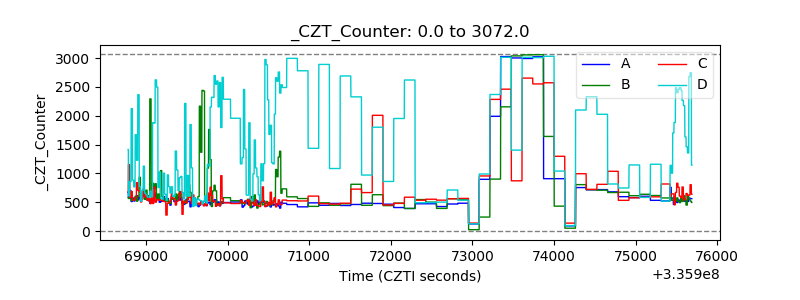 |
| +2.5 Volts monitor | 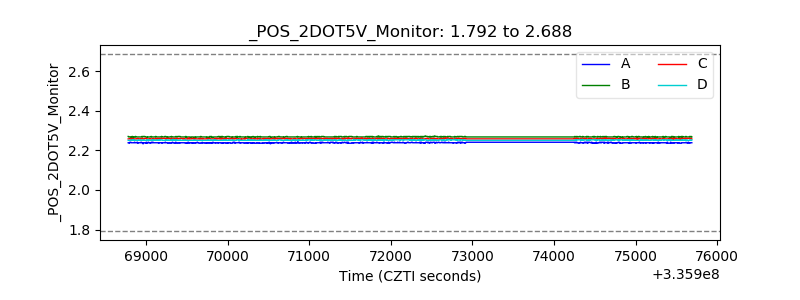 |
| +5 Volts monitor |  |
| _ROLL_ROT |  |
| _Roll_DEC | 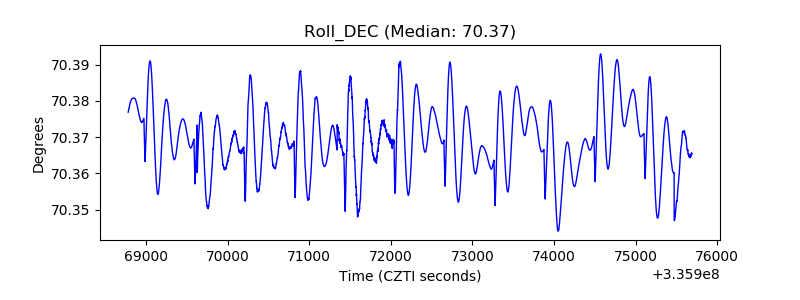 |
| _Roll_RA | 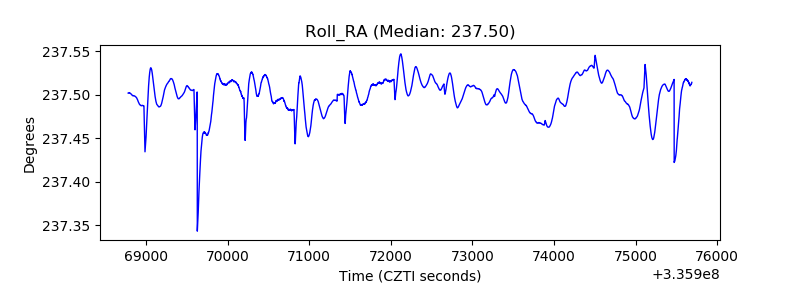 |
| Veto Counter |  |