| Param | Original file | Final file |
|---|---|---|
| Filename | modeM0/AS1C05_019T04_9000003838_26532cztM0_level2.evt | modeM0/AS1C05_019T04_9000003838_26532cztM0_level2_quad_clean.evt |
| Size (bytes) | 310,409,280 | 64,051,200 |
| Size | 296.0 MB | 61.1 MB |
| Events in quadrant A | 1,514,153 | 467,519 |
| Events in quadrant B | 1,667,863 | 466,692 |
| Events in quadrant C | 1,694,520 | 451,024 |
| Events in quadrant D | 4,326,471 | 347,564 |
| Mode M0 | |||
|---|---|---|---|
| Quadrant | BADHDUFLAG | Total packets | Discarded packets |
| A | 0 | 6313 | 0 |
| B | 0 | 6797 | 0 |
| C | 0 | 6916 | 0 |
| D | 0 | 14908 | 0 |
| Quadrant | Total seconds | Saturated seconds | Saturation percentage |
|---|---|---|---|
| A | 2892 | 2 | 0.069156% |
| B | 2892 | 29 | 1.002766% |
| C | 2892 | 24 | 0.829876% |
| D | 2892 | 1096 | 37.897649% |
Noise dominated data is calculated using 1-second bins in cleaned event files. If a bin has >2000 counts, and if more than 50% of those come from <1% of pixels, then it is considered to be noise-dominated and hence unusable.
| Quadrant | # 1 sec bins | Bins with >0 counts | Bins with >2000 counts | High rate bins dominated by noise | Noise dominated (total time) | Noise dominated (detector-on time) | Marked lightcurve |
|---|---|---|---|---|---|---|---|
| A | 2892 | 2892 | 0 | 0 | 0.00% | 0.00% | 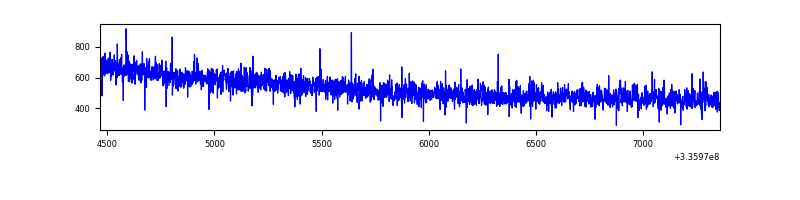 |
| B | 2892 | 2892 | 23 | 23 | 0.80% | 0.80% | 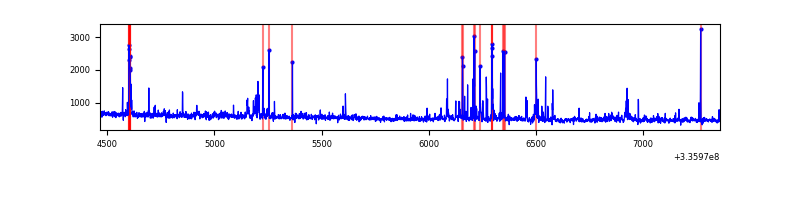 |
| C | 2892 | 2892 | 3 | 3 | 0.10% | 0.10% | 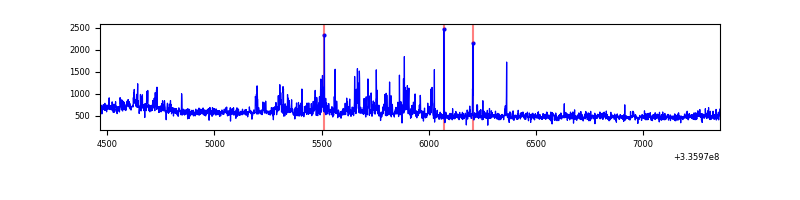 |
| D | 2892 | 2892 | 952 | 952 | 32.92% | 32.92% | 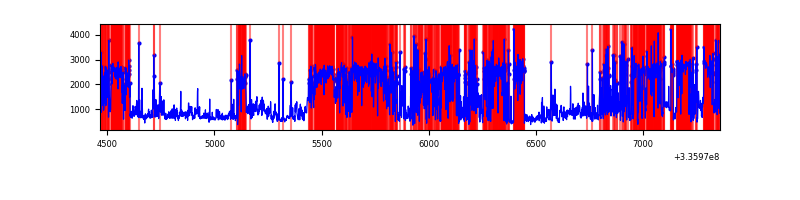 |
Top three noisy pixels from each quadrant. If the there are fewer than three noisy pixels in the level2.evt file, extra rows are filled as -1
| Pixel properties | Quadrant properties | ||||||
|---|---|---|---|---|---|---|---|
| Quadrant | DetID | PixID | Counts | Sigma | Mean | Median | Sigma |
| A | 5 | 168 | 38231 | 499.89 | 380 | 375 | 75.7 |
| A | 13 | 254 | 5286 | 64.85 | 380 | 375 | 75.7 |
| A | 6 | 16 | 4418 | 53.39 | 380 | 375 | 75.7 |
| B | 5 | 172 | 85862 | 1248.83 | 372 | 364 | 68.5 |
| B | 3 | 112 | 61179 | 888.3 | 372 | 364 | 68.5 |
| B | 3 | 64 | 20522 | 294.44 | 372 | 364 | 68.5 |
| C | 3 | 233 | 166877 | 1936.75 | 370 | 374 | 86.0 |
| C | 14 | 238 | 60421 | 698.46 | 370 | 374 | 86.0 |
| C | 4 | 254 | 13814 | 156.33 | 370 | 374 | 86.0 |
| D | 7 | 80 | 2511146 | 32125.62 | 305 | 299 | 78.2 |
| D | 12 | 233 | 363950 | 4652.81 | 305 | 299 | 78.2 |
| D | 1 | 52 | 249379 | 3186.91 | 305 | 299 | 78.2 |
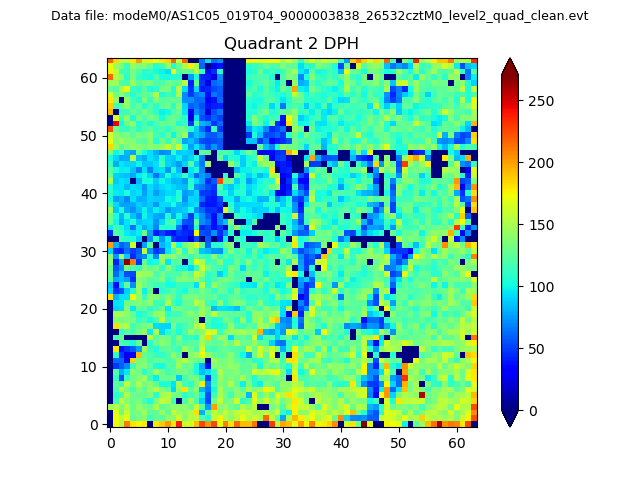
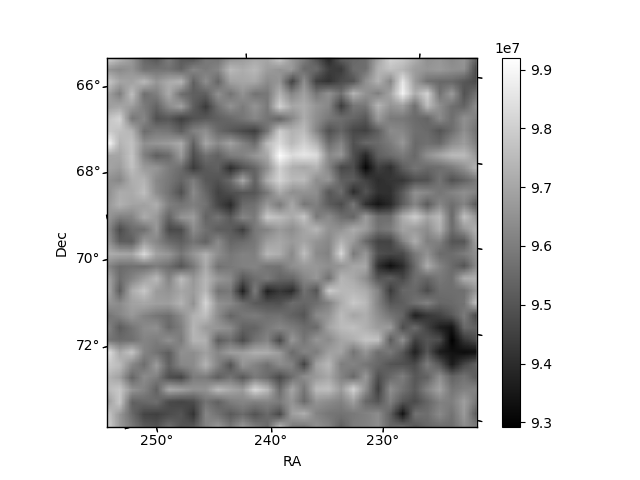
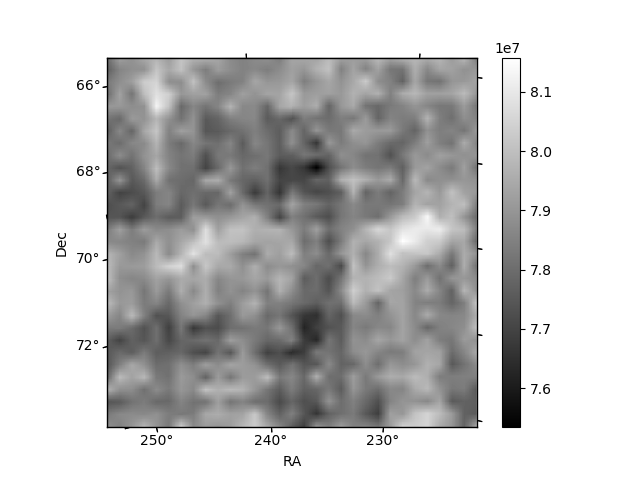
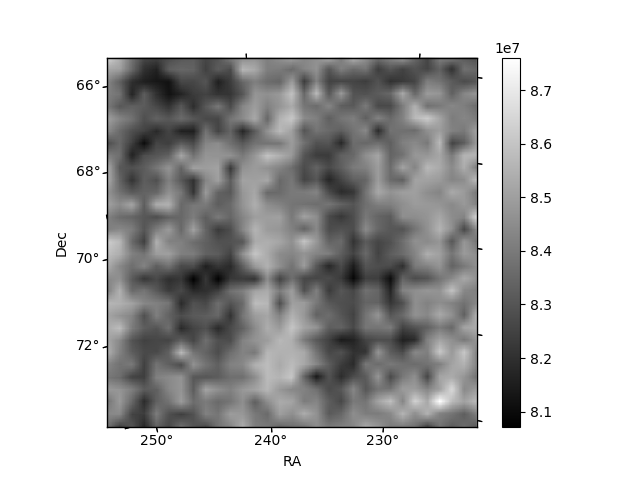
Histogram calculated using DETX and DETY for each event in the final _common_clean file
| Quadrant A | 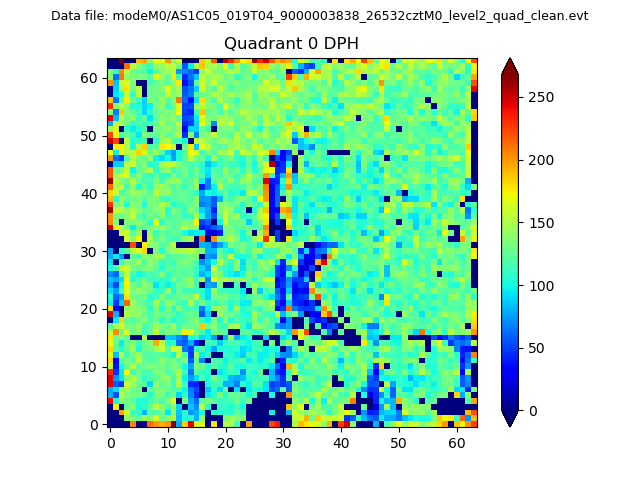 |
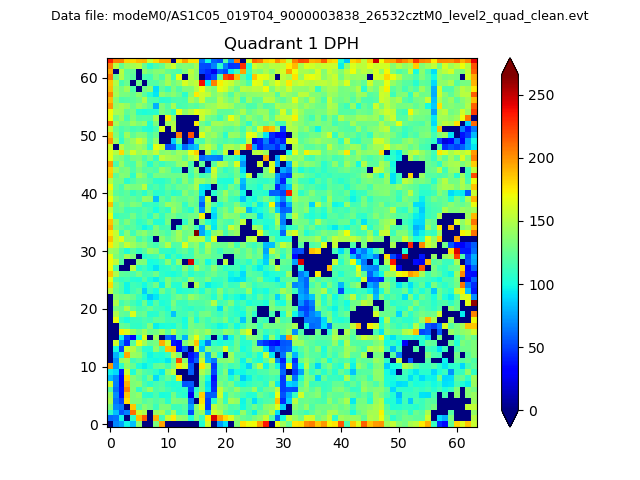 |
Quadrant B |
|---|---|---|---|
| Quadrant D | 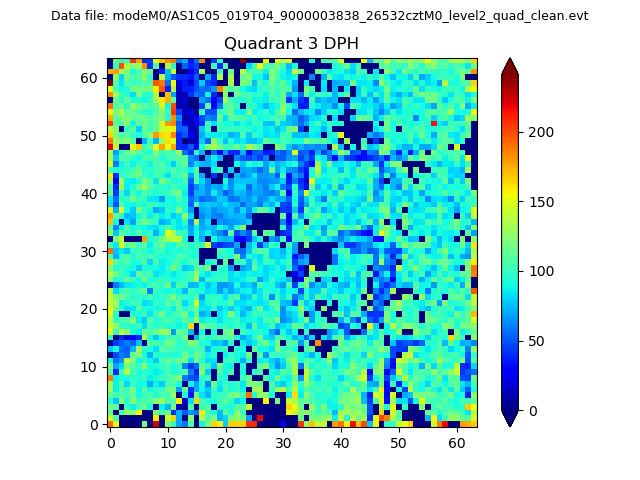 |
 |
Quadrant C |
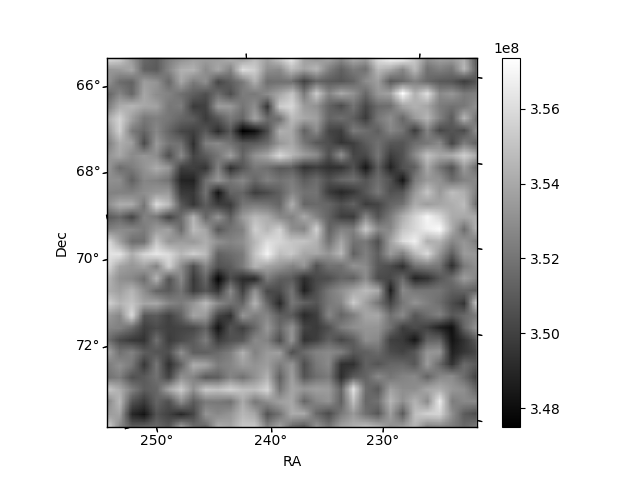
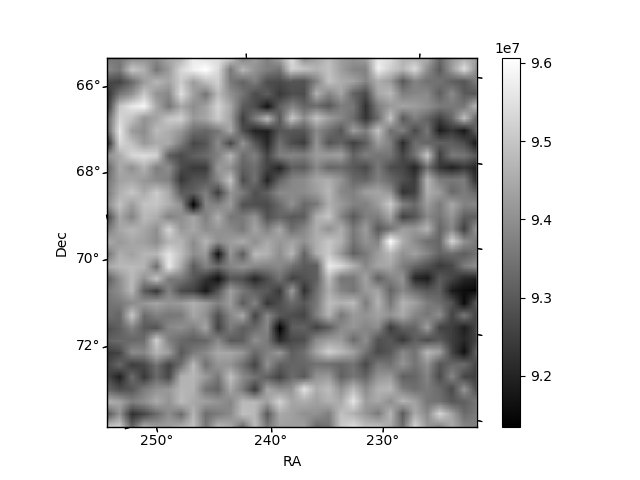
| Plot type | Count rate plots | Images |
|---|---|---|
| Comparison with Poisson distribution Blue bars denote a histogram of data divided into 1 sec bins. Red curve is a Poisson curve with rate = median count rate of data. |
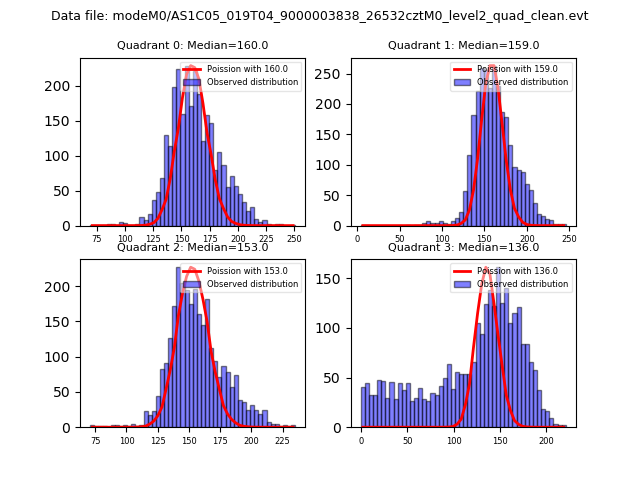 |
 |
| Quadrant-wise count rates Data is divided into 100 sec bins |
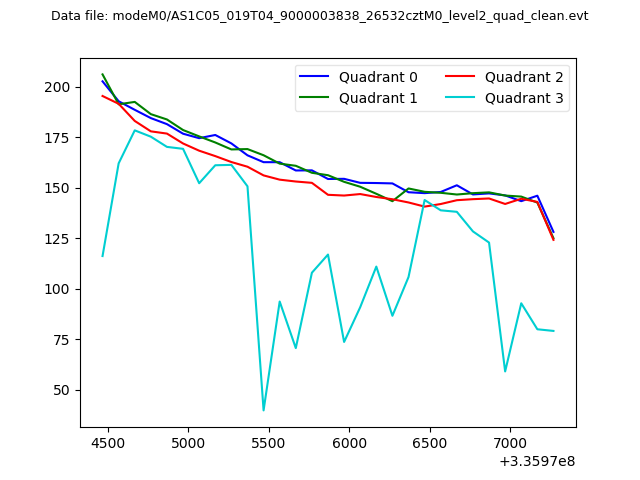 |
|
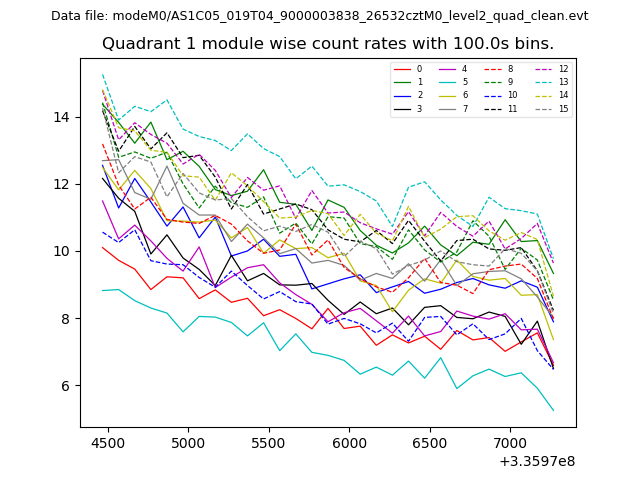
| Module-wise count rates for Quadrant A Data is divided into 100 sec bins |
 |
 |
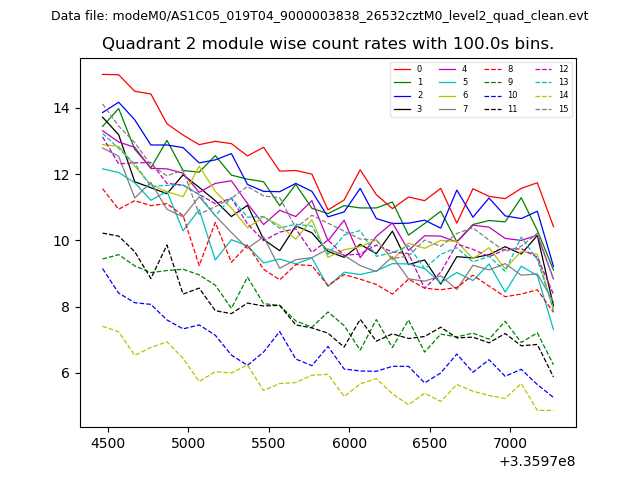
| Module-wise count rates for Quadrant B Data is divided into 100 sec bins |
 |
 |
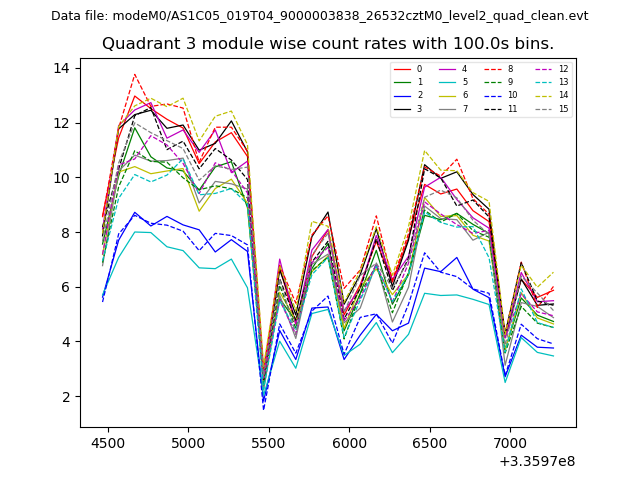
| Module-wise count rates for Quadrant C Data is divided into 100 sec bins |
 |
 |
| Module-wise count rates for Quadrant D Data is divided into 100 sec bins |
 |
 |
| Parameter | Plot |
|---|---|
| CZT HV Monitor | 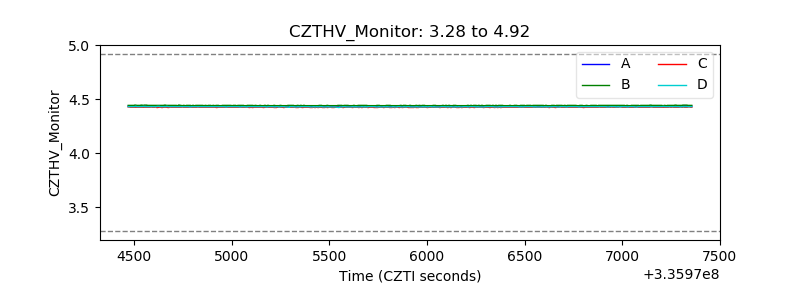 |
| D_VDD | 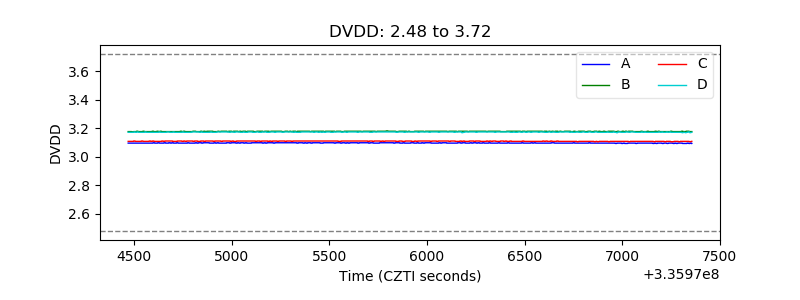 |
| Temperature 1 | 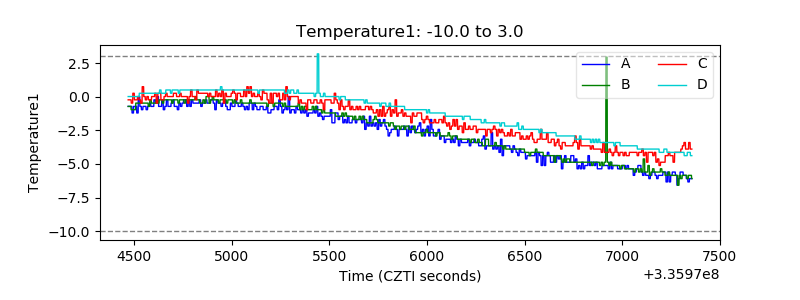 |
| Veto HV Monitor | 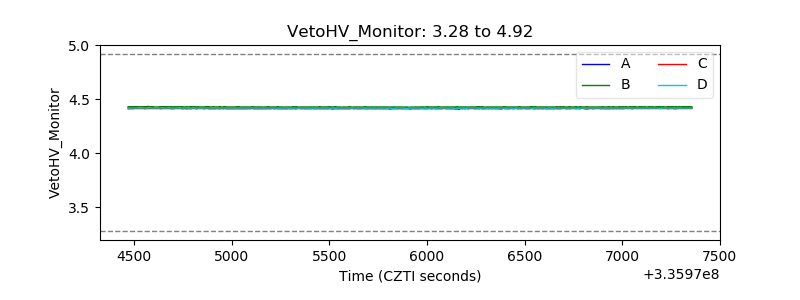 |
| Veto LLD |  |
| Alpha Counter | 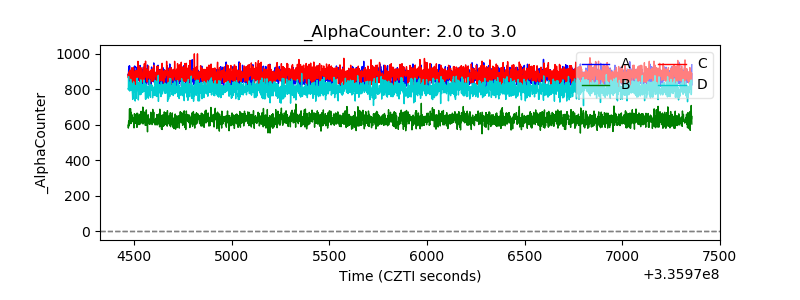 |
| _CPM_Rate | 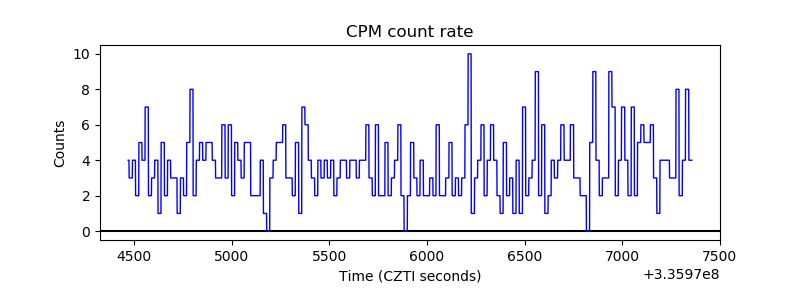 |
| CZT Counter | 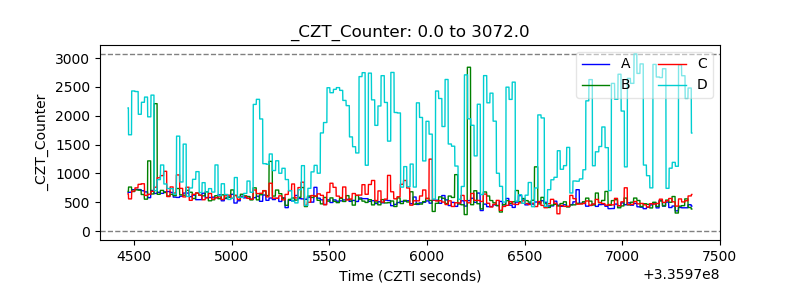 |
| +2.5 Volts monitor |  |
| +5 Volts monitor |  |
| _ROLL_ROT |  |
| _Roll_DEC | 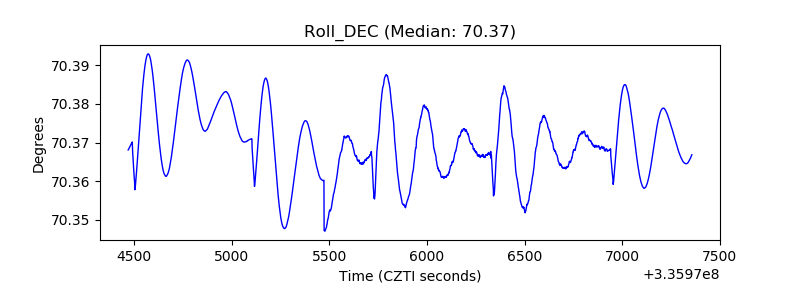 |
| _Roll_RA | 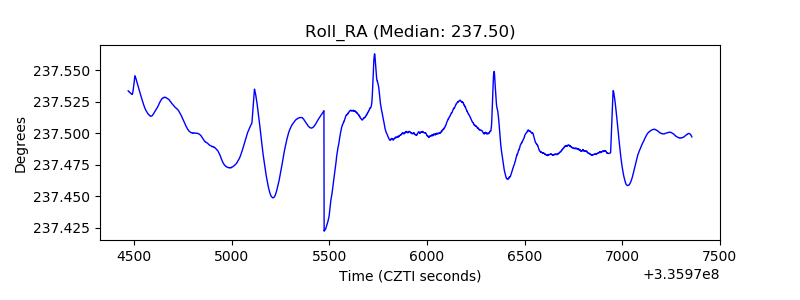 |
| Veto Counter |  |