| Param | Original file | Final file |
|---|---|---|
| Filename | modeM0/AS1C05_019T04_9000003838_26707cztM0_level2.evt | modeM0/AS1C05_019T04_9000003838_26707cztM0_level2_quad_clean.evt |
| Size (bytes) | 538,614,720 | 108,028,800 |
| Size | 513.7 MB | 103.0 MB |
| Events in quadrant A | 3,430,434 | 747,679 |
| Events in quadrant B | 3,308,313 | 745,631 |
| Events in quadrant C | 3,434,174 | 703,255 |
| Events in quadrant D | 5,734,384 | 657,736 |
| Mode M9 | |||
|---|---|---|---|
| Quadrant | BADHDUFLAG | Total packets | Discarded packets |
| A | 0 | 13 | 0 |
| B | 0 | 13 | 0 |
| C | 0 | 13 | 0 |
| D | 0 | 13 | 0 |
| Mode M0 | |||
|---|---|---|---|
| Quadrant | BADHDUFLAG | Total packets | Discarded packets |
| A | 0 | 13667 | 0 |
| B | 0 | 13160 | 0 |
| C | 0 | 13744 | 0 |
| D | 0 | 21007 | 0 |
| Quadrant | Total seconds | Saturated seconds | Saturation percentage |
|---|---|---|---|
| A | 5971 | 76 | 1.272819% |
| B | 5972 | 59 | 0.987944% |
| C | 5971 | 94 | 1.574276% |
| D | 5971 | 739 | 12.376486% |
Noise dominated data is calculated using 1-second bins in cleaned event files. If a bin has >2000 counts, and if more than 50% of those come from <1% of pixels, then it is considered to be noise-dominated and hence unusable.
| Quadrant | # 1 sec bins | Bins with >0 counts | Bins with >2000 counts | High rate bins dominated by noise | Noise dominated (total time) | Noise dominated (detector-on time) | Marked lightcurve |
|---|---|---|---|---|---|---|---|
| A | 7266 | 5972 | 11 | 11 | 0.15% | 0.18% | 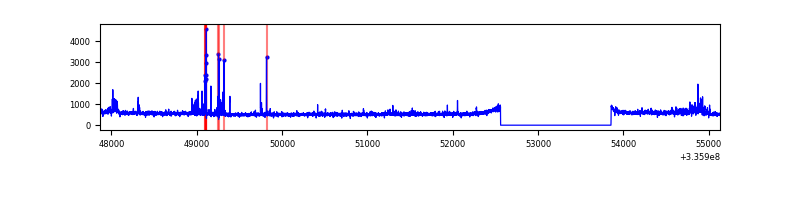 |
| B | 7267 | 5973 | 1 | 1 | 0.01% | 0.02% | 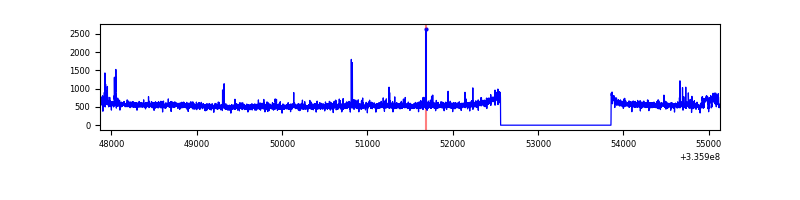 |
| C | 7266 | 5972 | 11 | 11 | 0.15% | 0.18% | 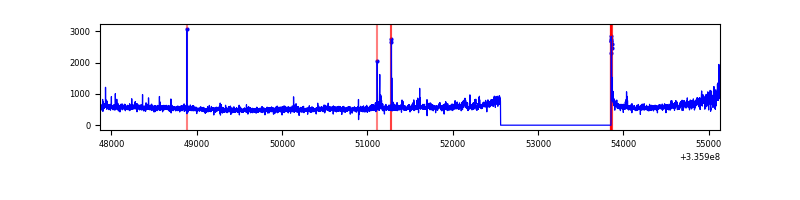 |
| D | 7266 | 5972 | 548 | 548 | 7.54% | 9.18% | 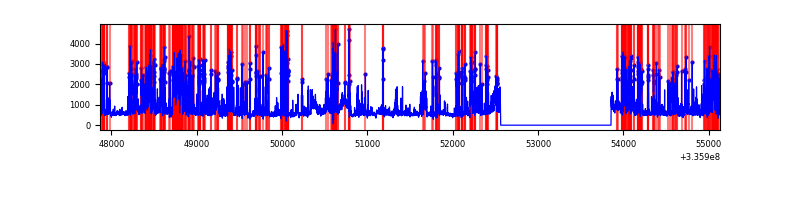 |
Top three noisy pixels from each quadrant. If the there are fewer than three noisy pixels in the level2.evt file, extra rows are filled as -1
| Pixel properties | Quadrant properties | ||||||
|---|---|---|---|---|---|---|---|
| Quadrant | DetID | PixID | Counts | Sigma | Mean | Median | Sigma |
| A | 0 | 13 | 182188 | 1097.61 | 830 | 817 | 165.2 |
| A | 2 | 79 | 33691 | 198.94 | 830 | 817 | 165.2 |
| A | 13 | 254 | 10134 | 56.38 | 830 | 817 | 165.2 |
| B | 0 | 189 | 36397 | 231.27 | 810 | 793 | 154.0 |
| B | 3 | 112 | 31899 | 202.05 | 810 | 793 | 154.0 |
| B | 4 | 200 | 30063 | 190.12 | 810 | 793 | 154.0 |
| C | 3 | 233 | 205971 | 1130.03 | 778 | 785 | 181.6 |
| C | 14 | 238 | 126943 | 694.8 | 778 | 785 | 181.6 |
| C | 15 | 208 | 67286 | 366.24 | 778 | 785 | 181.6 |
| D | 7 | 80 | 2350871 | 11933.55 | 755 | 738 | 196.9 |
| D | 15 | 35 | 143408 | 724.45 | 755 | 738 | 196.9 |
| D | 1 | 52 | 141896 | 716.78 | 755 | 738 | 196.9 |
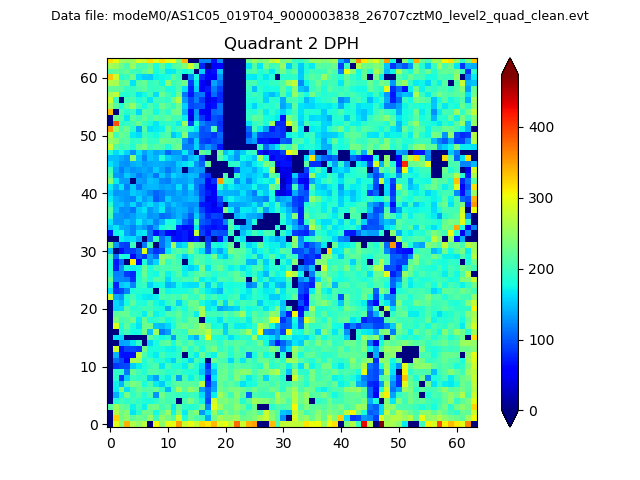
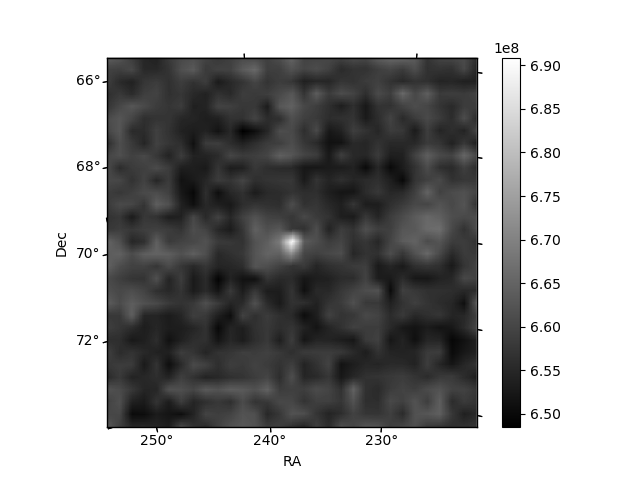
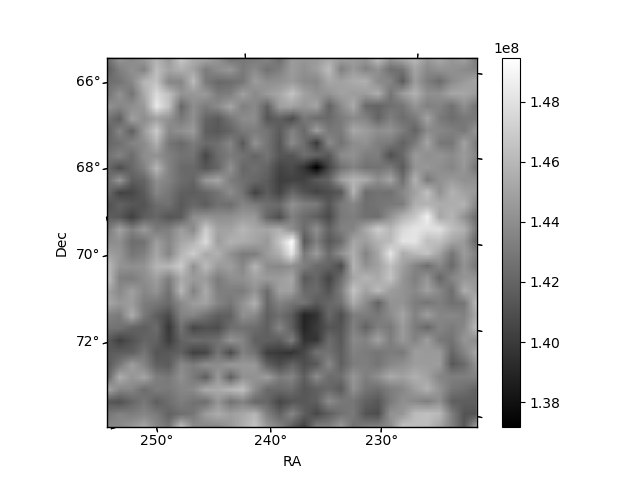
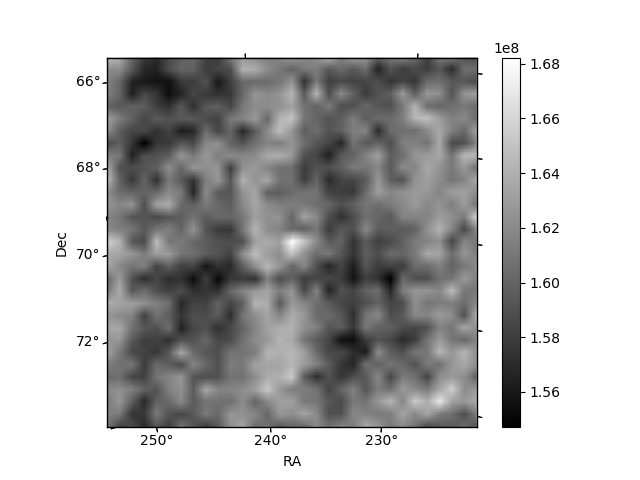
Histogram calculated using DETX and DETY for each event in the final _common_clean file
| Quadrant A | 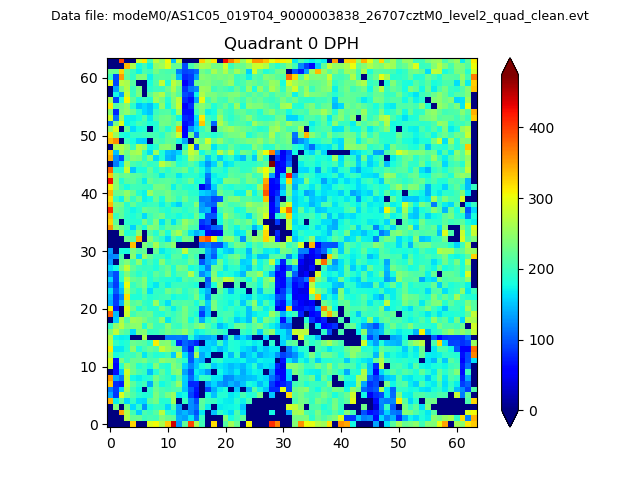 |
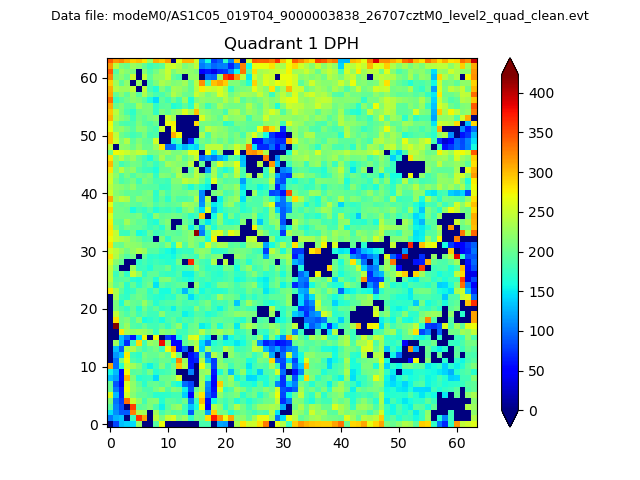 |
Quadrant B |
|---|---|---|---|
| Quadrant D | 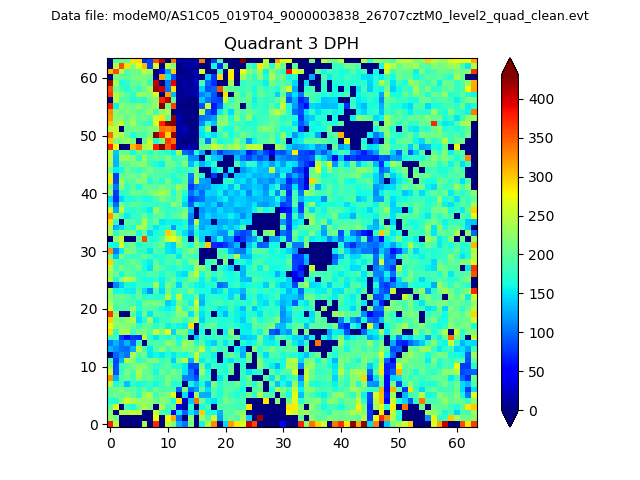 |
 |
Quadrant C |
| Plot type | Count rate plots | Images |
|---|---|---|
| Comparison with Poisson distribution Blue bars denote a histogram of data divided into 1 sec bins. Red curve is a Poisson curve with rate = median count rate of data. |
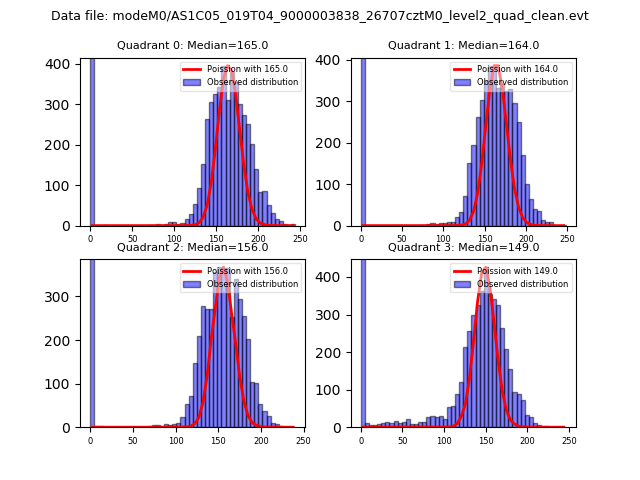 |
 |
| Quadrant-wise count rates Data is divided into 100 sec bins |
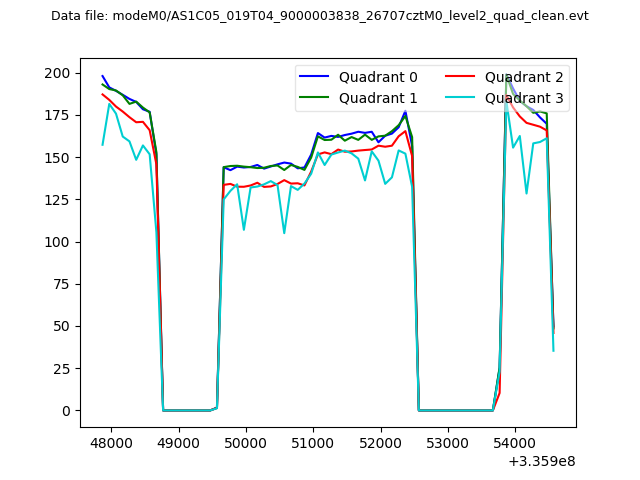 |
|
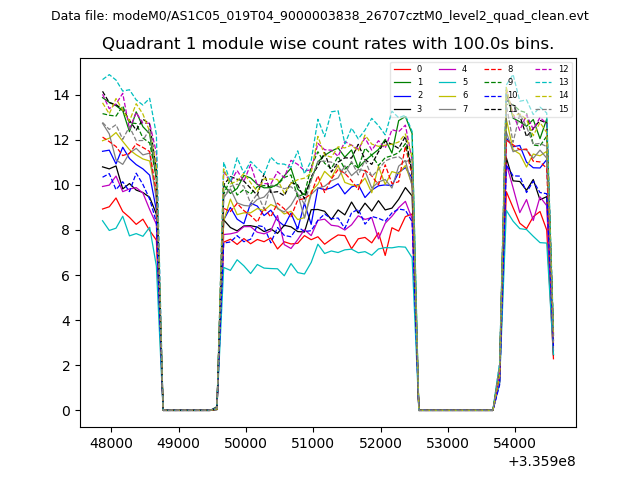
| Module-wise count rates for Quadrant A Data is divided into 100 sec bins |
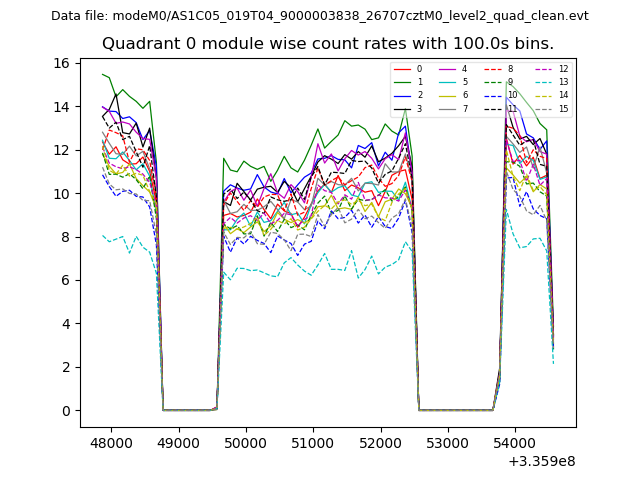 |
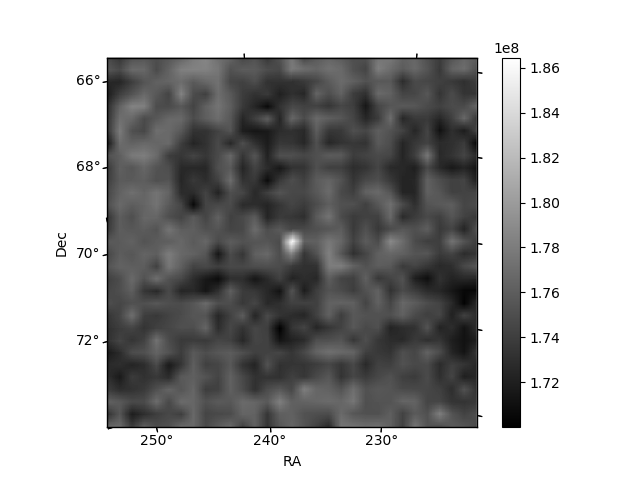 |
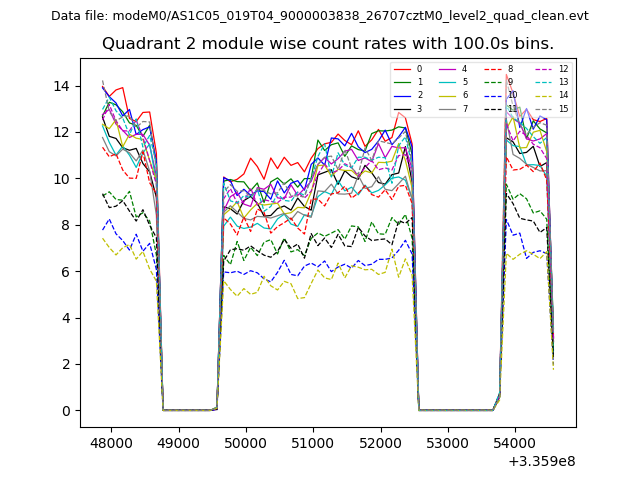
| Module-wise count rates for Quadrant B Data is divided into 100 sec bins |
 |
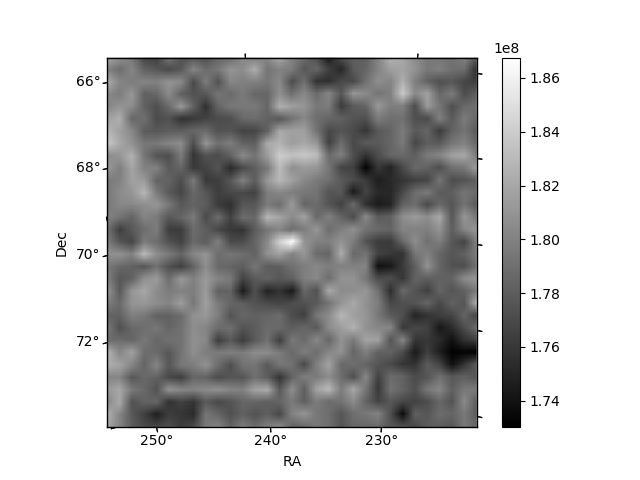 |
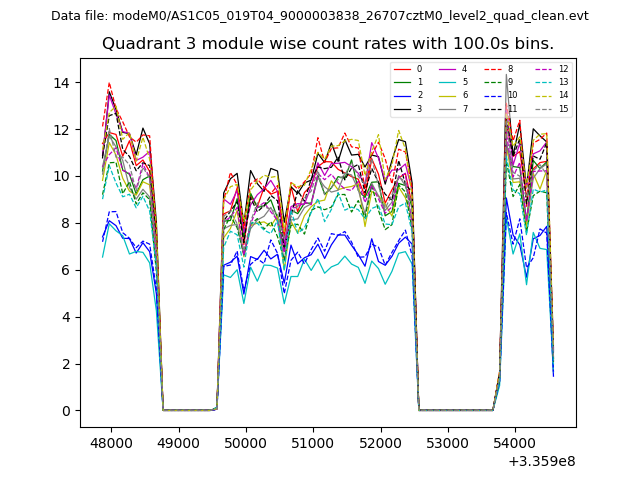
| Module-wise count rates for Quadrant C Data is divided into 100 sec bins |
 |
 |
| Module-wise count rates for Quadrant D Data is divided into 100 sec bins |
 |
 |
| Parameter | Plot |
|---|---|
| CZT HV Monitor | 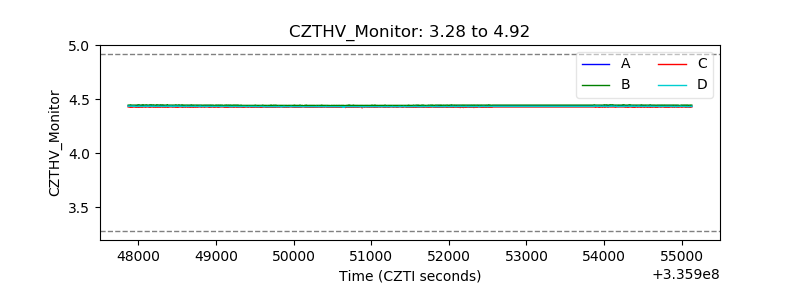 |
| D_VDD | 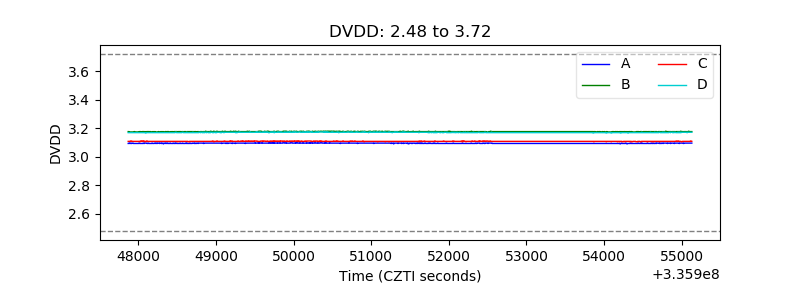 |
| Temperature 1 | 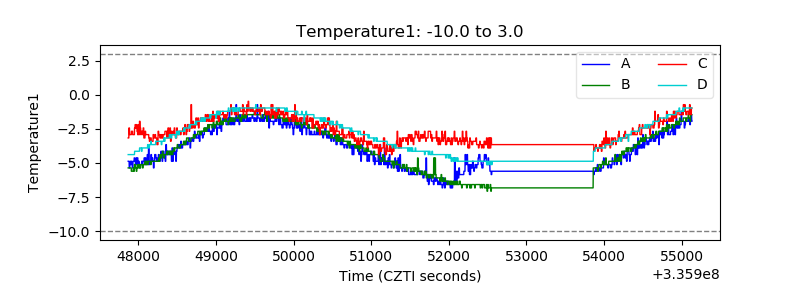 |
| Veto HV Monitor | 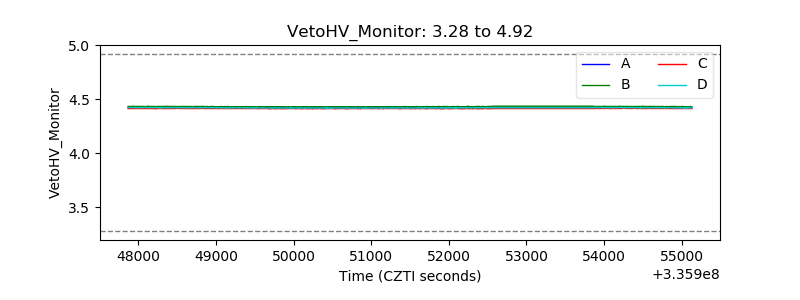 |
| Veto LLD | 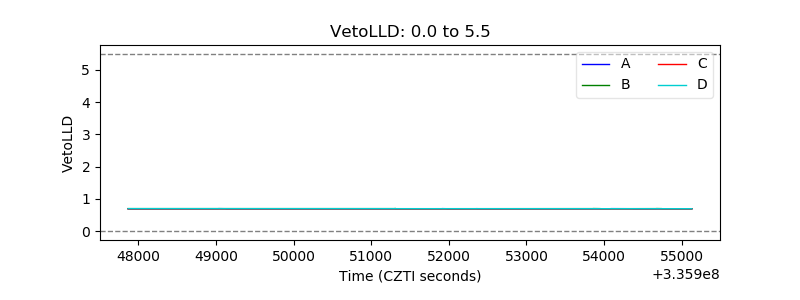 |
| Alpha Counter | 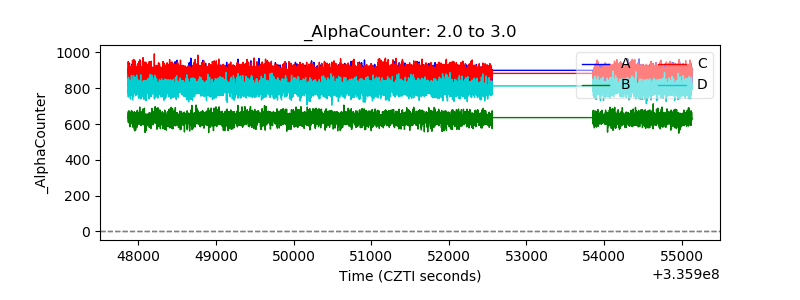 |
| _CPM_Rate | 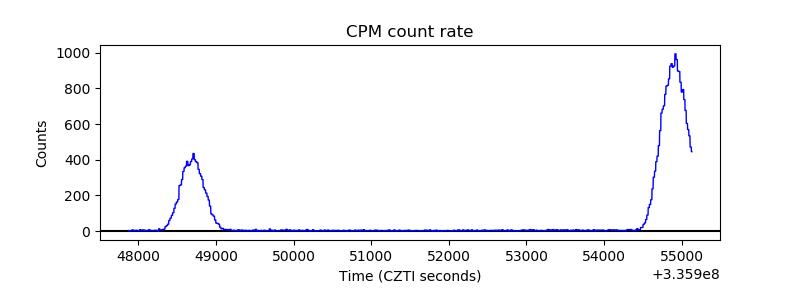 |
| CZT Counter | 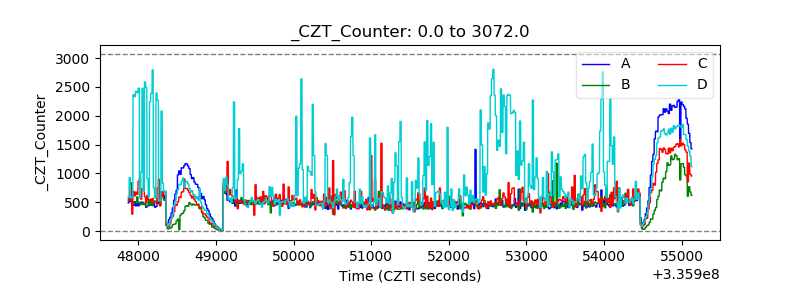 |
| +2.5 Volts monitor | 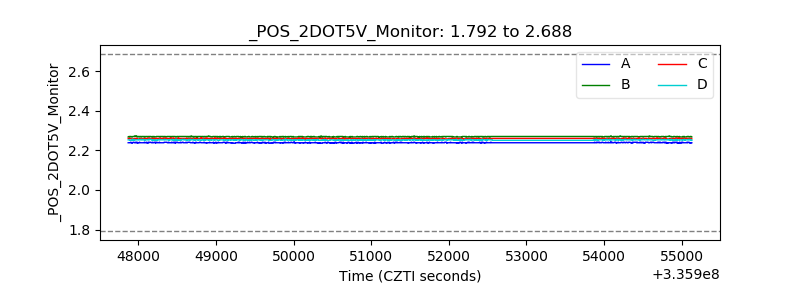 |
| +5 Volts monitor |  |
| _ROLL_ROT | 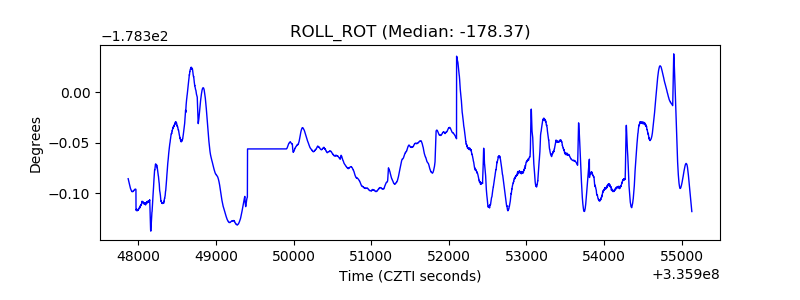 |
| _Roll_DEC |  |
| _Roll_RA | 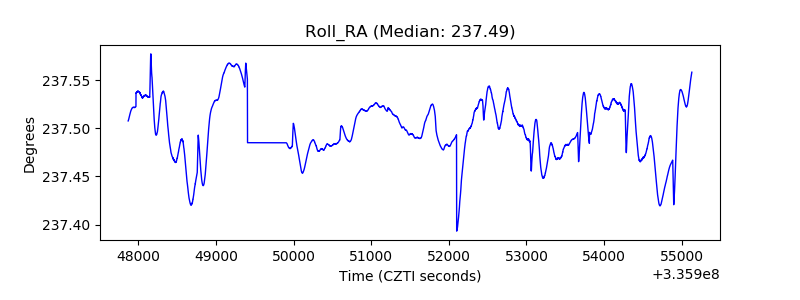 |
| Veto Counter |  |