| Param | Original file | Final file |
|---|---|---|
| Filename | modeM0/AS1A09_095T02_9000003840_26532cztM0_level2.evt | modeM0/AS1A09_095T02_9000003840_26532cztM0_level2_quad_clean.evt |
| Size (bytes) | 180,043,200 | 25,171,200 |
| Size | 171.7 MB | 24.0 MB |
| Events in quadrant A | 973,368 | 168,082 |
| Events in quadrant B | 1,077,065 | 170,088 |
| Events in quadrant C | 1,227,869 | 159,529 |
| Events in quadrant D | 2,065,684 | 148,210 |
| Mode M9 | |||
|---|---|---|---|
| Quadrant | BADHDUFLAG | Total packets | Discarded packets |
| A | 0 | 13 | 0 |
| B | 0 | 13 | 0 |
| C | 0 | 13 | 0 |
| D | 0 | 13 | 0 |
| Mode M0 | |||
|---|---|---|---|
| Quadrant | BADHDUFLAG | Total packets | Discarded packets |
| A | 0 | 4043 | 0 |
| B | 0 | 4342 | 0 |
| C | 0 | 4827 | 0 |
| D | 0 | 7253 | 0 |
| Quadrant | Total seconds | Saturated seconds | Saturation percentage |
|---|---|---|---|
| A | 1559 | 65 | 4.169339% |
| B | 1559 | 103 | 6.606799% |
| C | 1559 | 103 | 6.606799% |
| D | 1558 | 364 | 23.363286% |
Noise dominated data is calculated using 1-second bins in cleaned event files. If a bin has >2000 counts, and if more than 50% of those come from <1% of pixels, then it is considered to be noise-dominated and hence unusable.
| Quadrant | # 1 sec bins | Bins with >0 counts | Bins with >2000 counts | High rate bins dominated by noise | Noise dominated (total time) | Noise dominated (detector-on time) | Marked lightcurve |
|---|---|---|---|---|---|---|---|
| A | 2924 | 1559 | 0 | 0 | 0.00% | 0.00% | 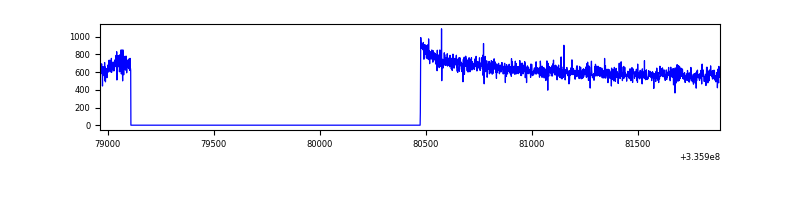 |
| B | 2924 | 1559 | 3 | 3 | 0.10% | 0.19% | 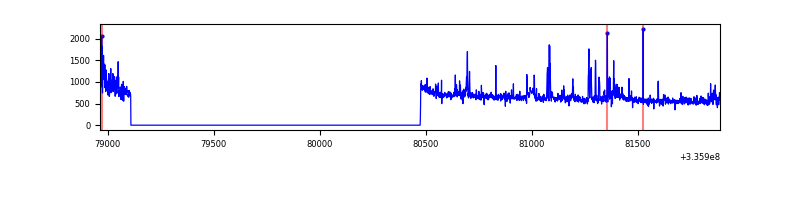 |
| C | 2924 | 1559 | 8 | 8 | 0.27% | 0.51% | 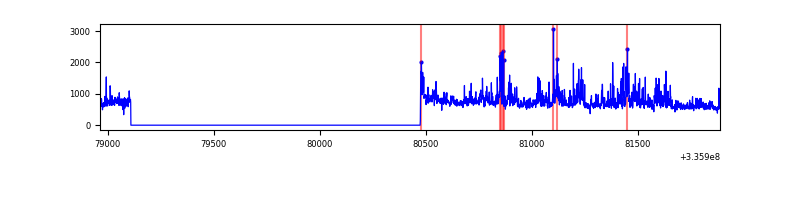 |
| D | 2923 | 1558 | 258 | 258 | 8.83% | 16.56% | 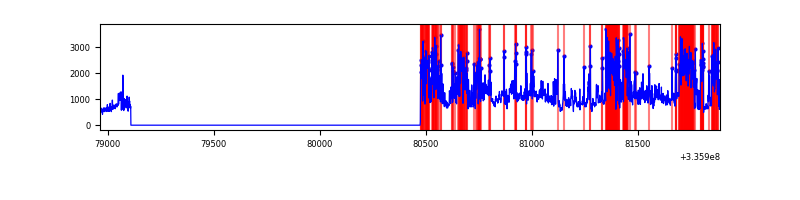 |
Top three noisy pixels from each quadrant. If the there are fewer than three noisy pixels in the level2.evt file, extra rows are filled as -1
| Pixel properties | Quadrant properties | ||||||
|---|---|---|---|---|---|---|---|
| Quadrant | DetID | PixID | Counts | Sigma | Mean | Median | Sigma |
| A | 5 | 168 | 16957 | 339.26 | 245 | 241 | 49.3 |
| A | 9 | 130 | 10162 | 201.35 | 245 | 241 | 49.3 |
| A | 13 | 254 | 2526 | 46.37 | 245 | 241 | 49.3 |
| B | 3 | 64 | 90273 | 1996.46 | 239 | 235 | 45.1 |
| B | 3 | 112 | 26650 | 585.71 | 239 | 235 | 45.1 |
| B | 5 | 172 | 25198 | 553.52 | 239 | 235 | 45.1 |
| C | 3 | 233 | 301070 | 5776.44 | 224 | 225 | 52.1 |
| C | 14 | 238 | 37922 | 723.81 | 224 | 225 | 52.1 |
| C | 4 | 254 | 7776 | 144.98 | 224 | 225 | 52.1 |
| D | 7 | 80 | 593533 | 11287.77 | 218 | 213 | 52.6 |
| D | 1 | 52 | 553173 | 10519.93 | 218 | 213 | 52.6 |
| D | 12 | 233 | 72674 | 1378.55 | 218 | 213 | 52.6 |
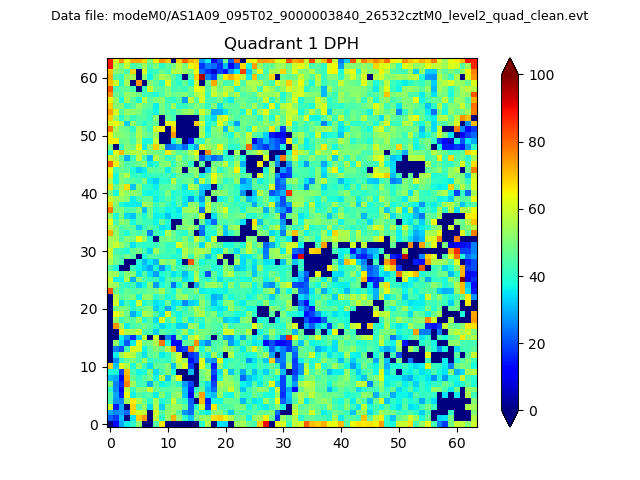
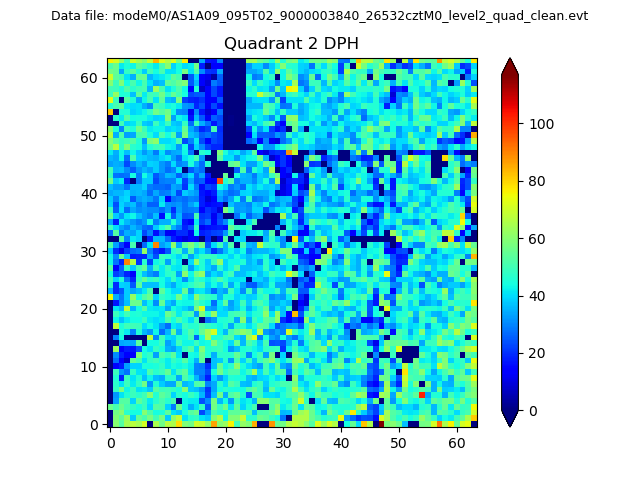
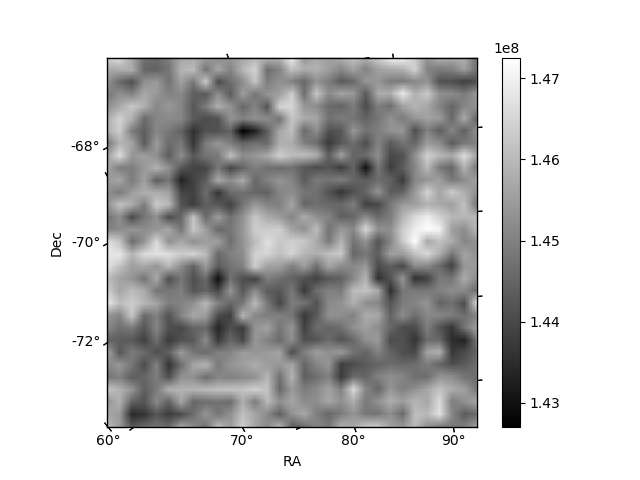
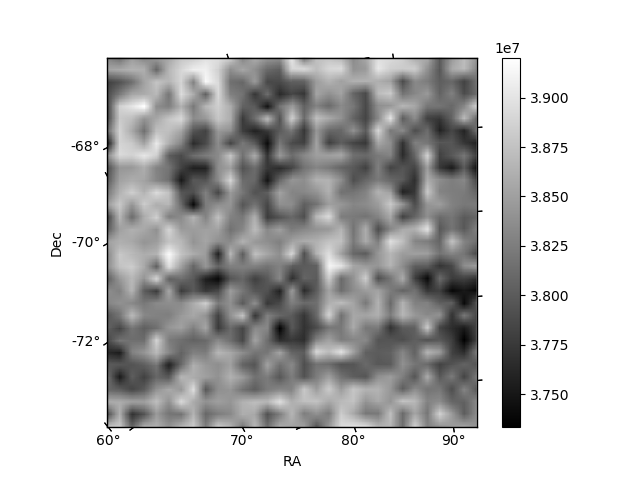
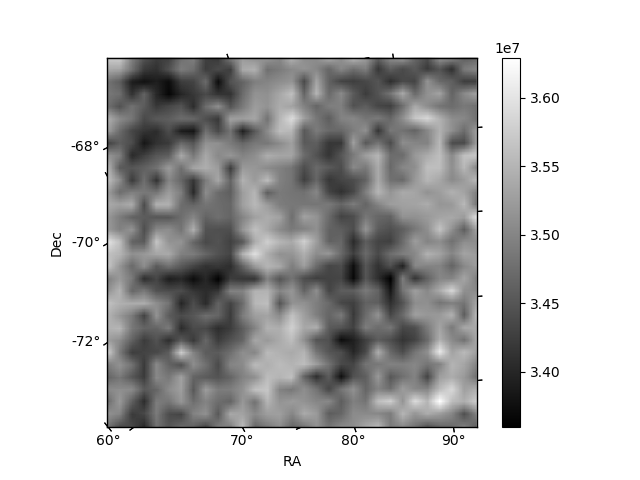
Histogram calculated using DETX and DETY for each event in the final _common_clean file
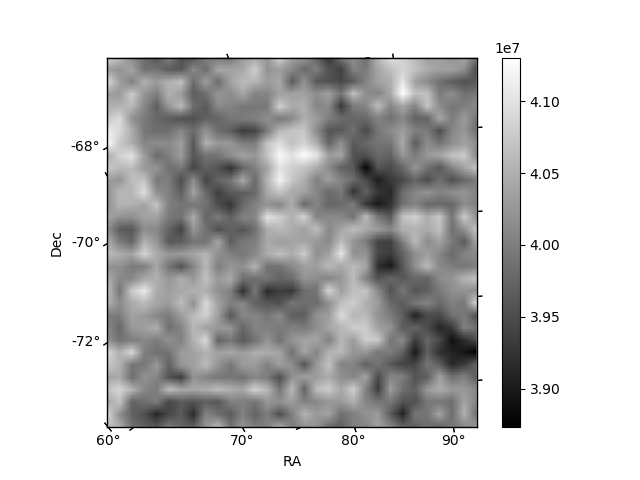
| Quadrant A |  |
 |
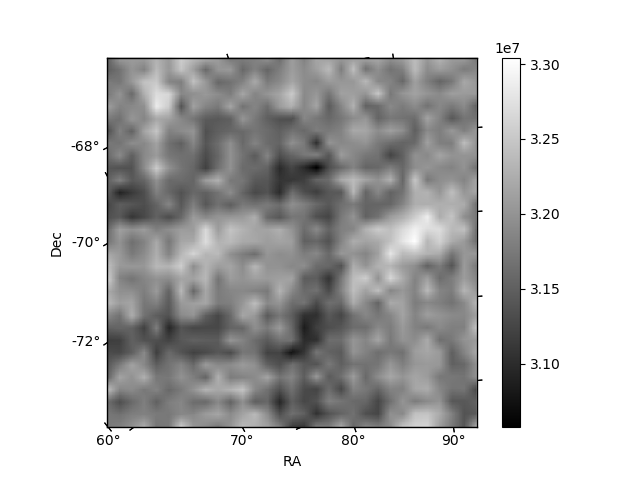
Quadrant B |
|---|---|---|---|
| Quadrant D | 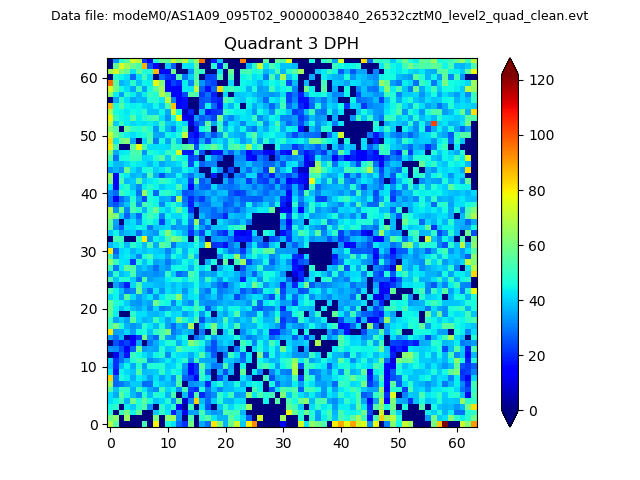 |
 |
Quadrant C |
| Plot type | Count rate plots | Images |
|---|---|---|
| Comparison with Poisson distribution Blue bars denote a histogram of data divided into 1 sec bins. Red curve is a Poisson curve with rate = median count rate of data. |
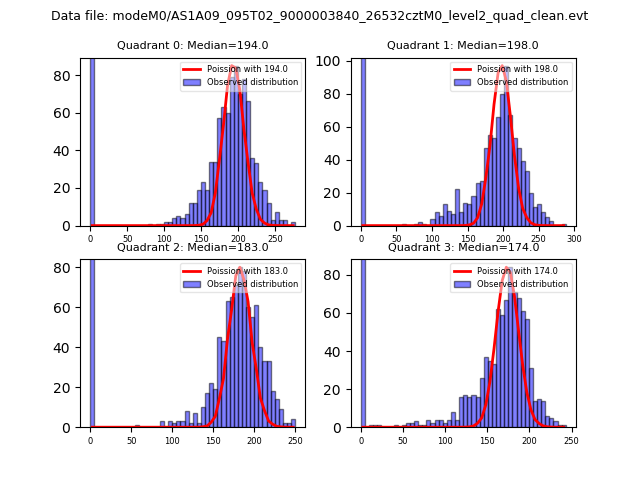 |
 |
| Quadrant-wise count rates Data is divided into 100 sec bins |
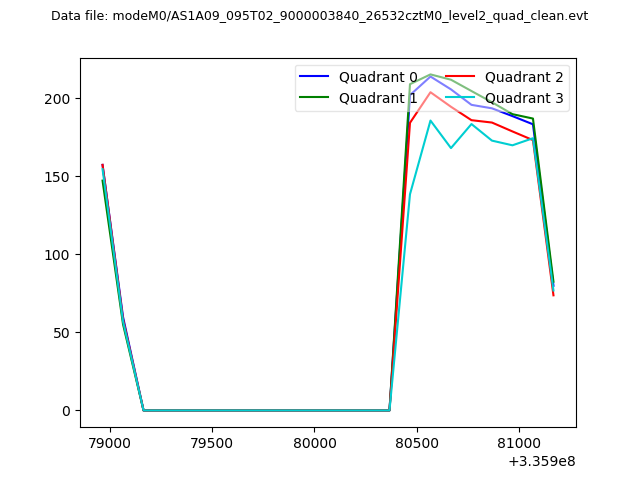 |
|
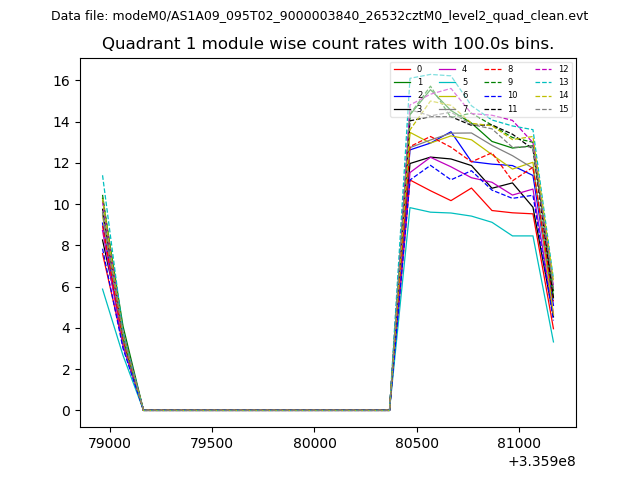
| Module-wise count rates for Quadrant A Data is divided into 100 sec bins |
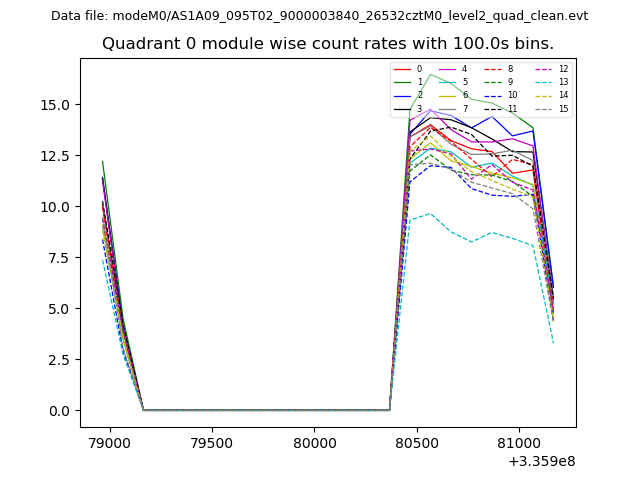 |
 |
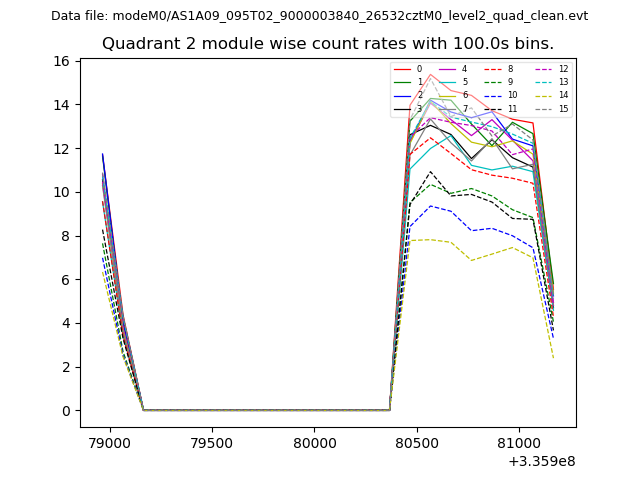
| Module-wise count rates for Quadrant B Data is divided into 100 sec bins |
 |
 |
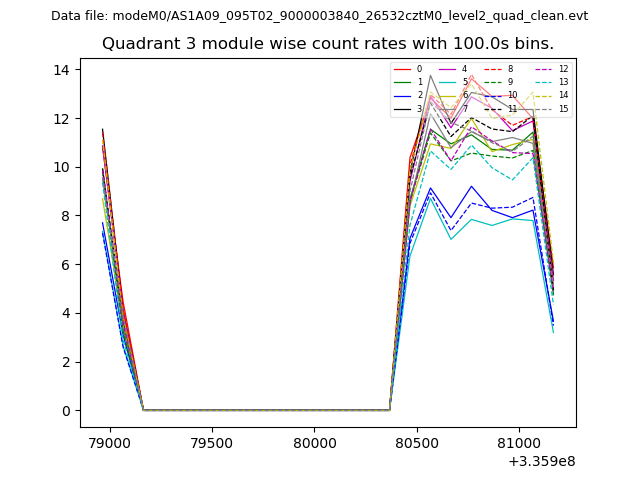
| Module-wise count rates for Quadrant C Data is divided into 100 sec bins |
 |
 |
| Module-wise count rates for Quadrant D Data is divided into 100 sec bins |
 |
 |
| Parameter | Plot |
|---|---|
| CZT HV Monitor | 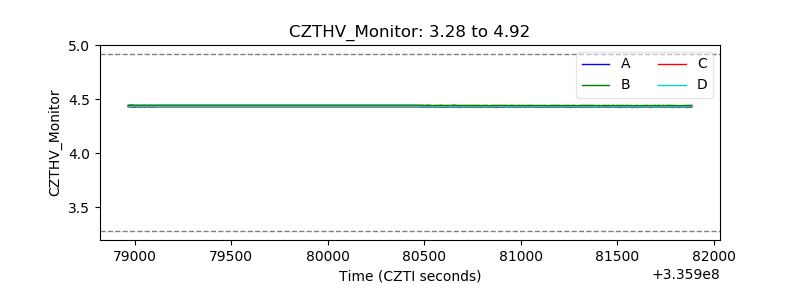 |
| D_VDD | 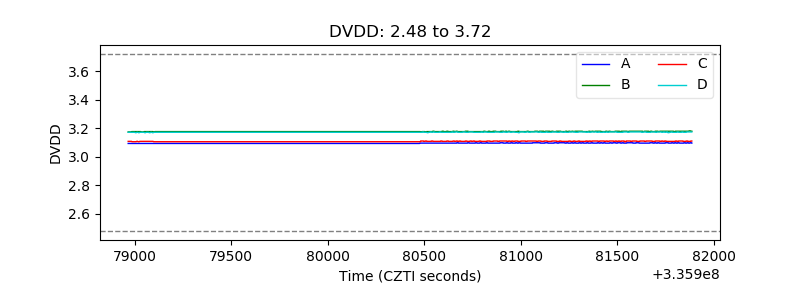 |
| Temperature 1 | 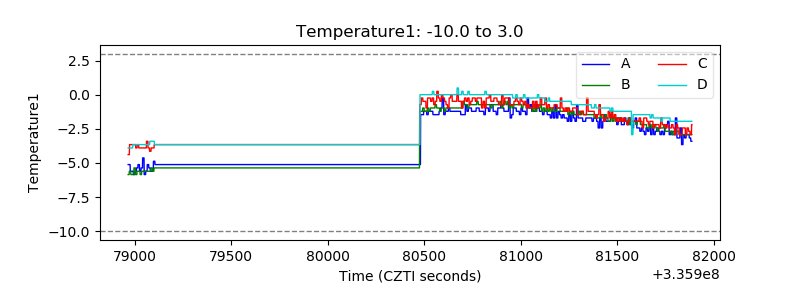 |
| Veto HV Monitor |  |
| Veto LLD | 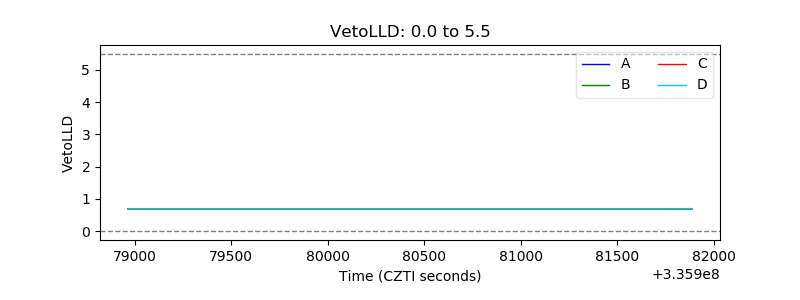 |
| Alpha Counter | 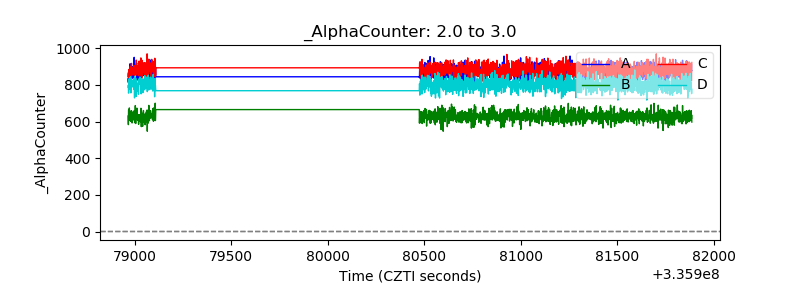 |
| _CPM_Rate |  |
| CZT Counter | 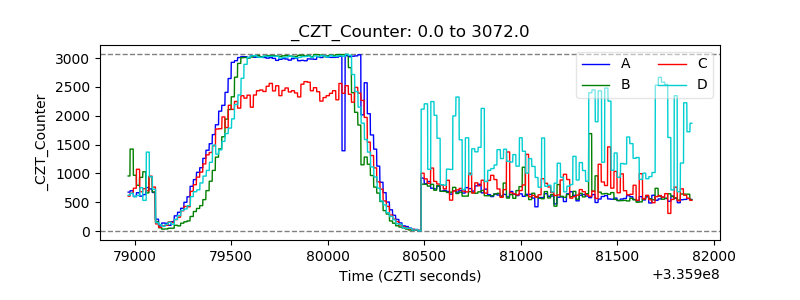 |
| +2.5 Volts monitor |  |
| +5 Volts monitor |  |
| _ROLL_ROT | 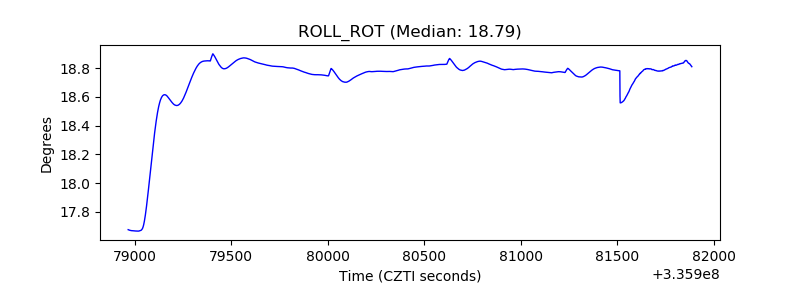 |
| _Roll_DEC | 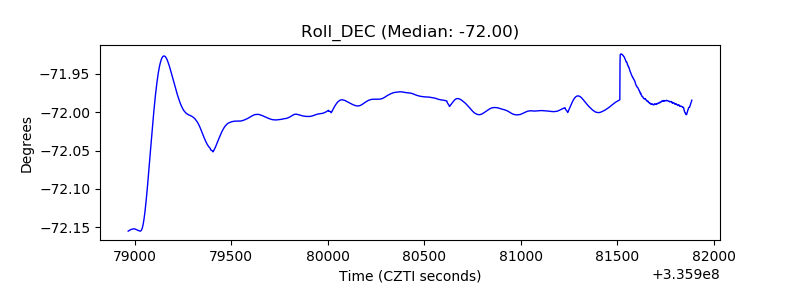 |
| _Roll_RA | 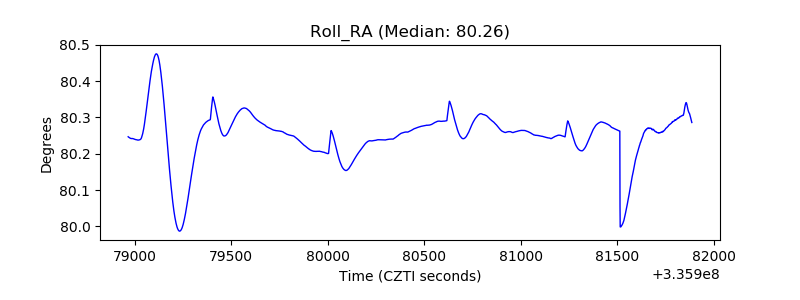 |
| Veto Counter | 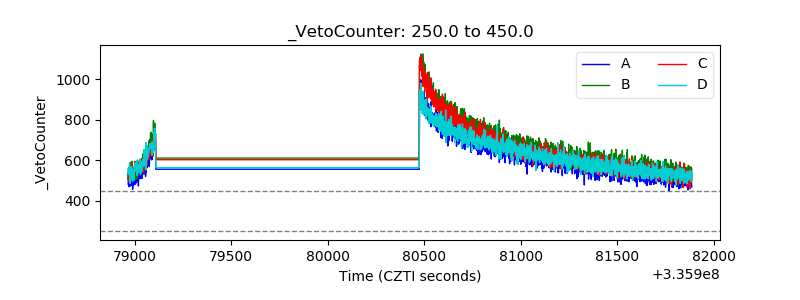 |