| Param | Original file | Final file |
|---|---|---|
| Filename | modeM0/AS1A09_095T02_9000003840_26533cztM0_level2.evt | modeM0/AS1A09_095T02_9000003840_26533cztM0_level2_quad_clean.evt |
| Size (bytes) | 521,481,600 | 90,866,880 |
| Size | 497.3 MB | 86.7 MB |
| Events in quadrant A | 3,071,455 | 605,013 |
| Events in quadrant B | 3,287,875 | 612,299 |
| Events in quadrant C | 3,335,389 | 576,995 |
| Events in quadrant D | 5,709,357 | 555,921 |
| Mode M9 | |||
|---|---|---|---|
| Quadrant | BADHDUFLAG | Total packets | Discarded packets |
| A | 0 | 14 | 0 |
| B | 0 | 14 | 0 |
| C | 0 | 14 | 0 |
| D | 0 | 14 | 0 |
| Mode M0 | |||
|---|---|---|---|
| Quadrant | BADHDUFLAG | Total packets | Discarded packets |
| A | 0 | 12702 | 0 |
| B | 0 | 13383 | 0 |
| C | 0 | 13549 | 0 |
| D | 0 | 21051 | 0 |
| Quadrant | Total seconds | Saturated seconds | Saturation percentage |
|---|---|---|---|
| A | 5745 | 85 | 1.479547% |
| B | 5746 | 113 | 1.966585% |
| C | 5746 | 152 | 2.645318% |
| D | 5746 | 629 | 10.946746% |
Noise dominated data is calculated using 1-second bins in cleaned event files. If a bin has >2000 counts, and if more than 50% of those come from <1% of pixels, then it is considered to be noise-dominated and hence unusable.
| Quadrant | # 1 sec bins | Bins with >0 counts | Bins with >2000 counts | High rate bins dominated by noise | Noise dominated (total time) | Noise dominated (detector-on time) | Marked lightcurve |
|---|---|---|---|---|---|---|---|
| A | 7095 | 5745 | 0 | 0 | 0.00% | 0.00% | 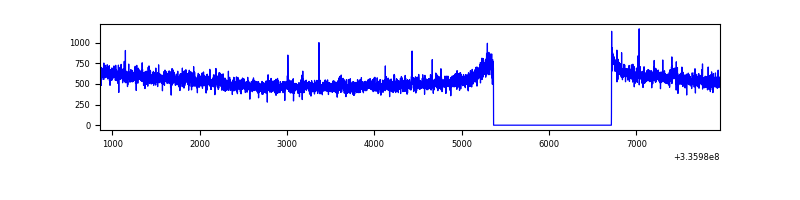 |
| B | 7096 | 5746 | 14 | 14 | 0.20% | 0.24% | 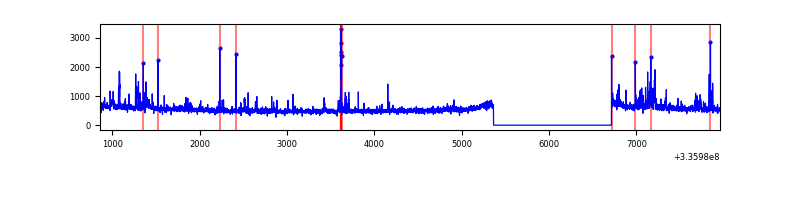 |
| C | 7096 | 5747 | 11 | 11 | 0.16% | 0.19% | 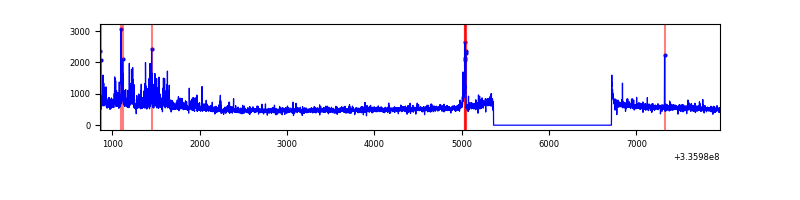 |
| D | 7096 | 5746 | 518 | 518 | 7.30% | 9.01% | 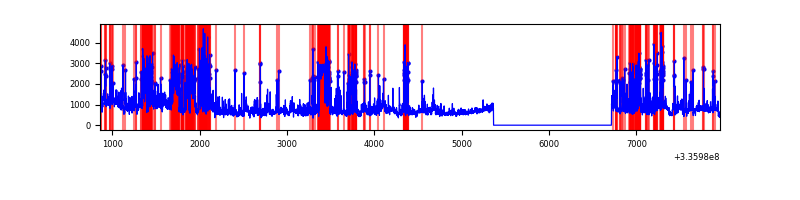 |
Top three noisy pixels from each quadrant. If the there are fewer than three noisy pixels in the level2.evt file, extra rows are filled as -1
| Pixel properties | Quadrant properties | ||||||
|---|---|---|---|---|---|---|---|
| Quadrant | DetID | PixID | Counts | Sigma | Mean | Median | Sigma |
| A | 5 | 168 | 42401 | 272.66 | 775 | 763 | 152.7 |
| A | 9 | 130 | 35518 | 227.59 | 775 | 763 | 152.7 |
| A | 13 | 254 | 9867 | 59.62 | 775 | 763 | 152.7 |
| B | 3 | 64 | 81071 | 575.7 | 767 | 751 | 139.5 |
| B | 3 | 112 | 74528 | 528.8 | 767 | 751 | 139.5 |
| B | 5 | 172 | 61639 | 436.42 | 767 | 751 | 139.5 |
| C | 3 | 233 | 307048 | 1845.53 | 730 | 735 | 166.0 |
| C | 14 | 238 | 122843 | 735.7 | 730 | 735 | 166.0 |
| C | 4 | 254 | 49061 | 291.16 | 730 | 735 | 166.0 |
| D | 7 | 80 | 1405543 | 8308.92 | 717 | 699 | 169.1 |
| D | 1 | 52 | 1362122 | 8052.11 | 717 | 699 | 169.1 |
| D | 12 | 233 | 119131 | 700.46 | 717 | 699 | 169.1 |
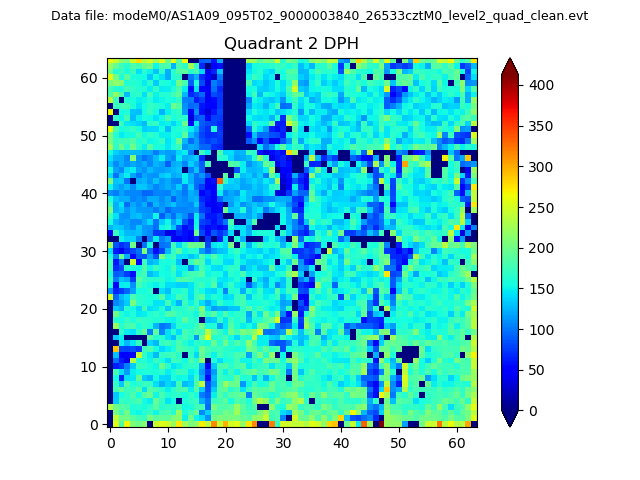
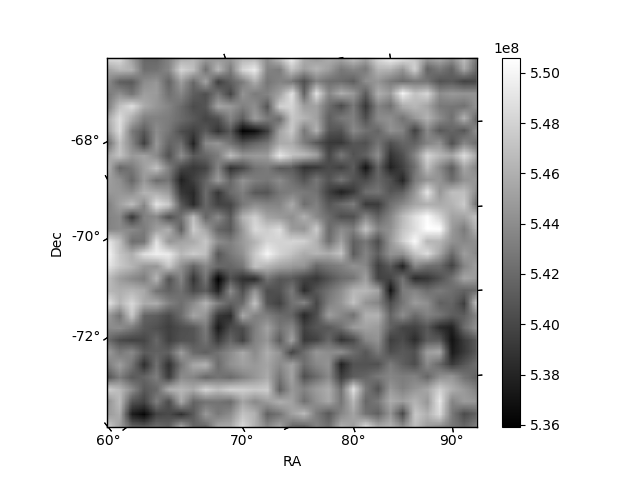
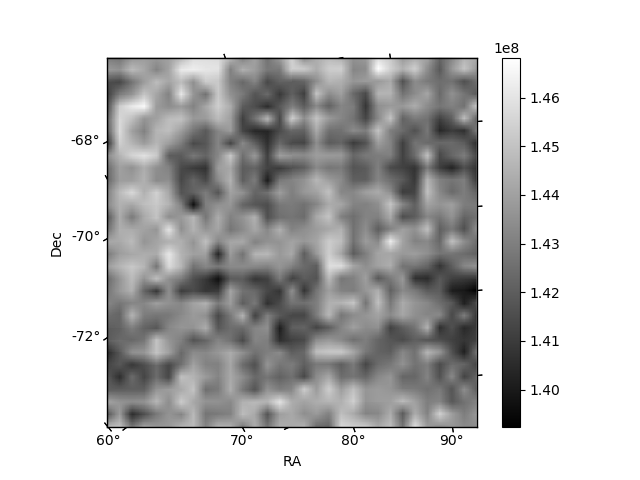
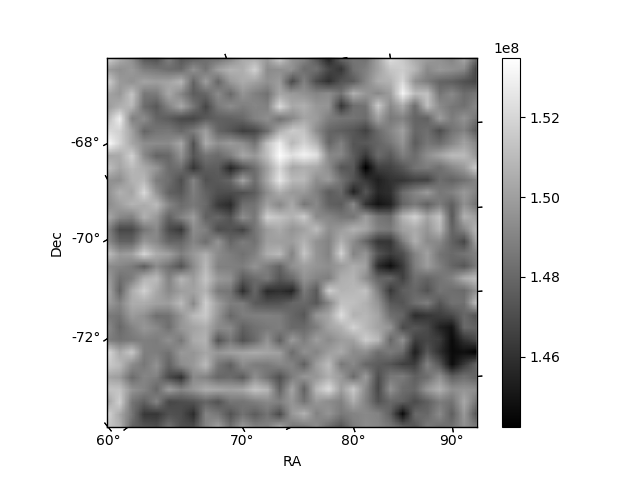
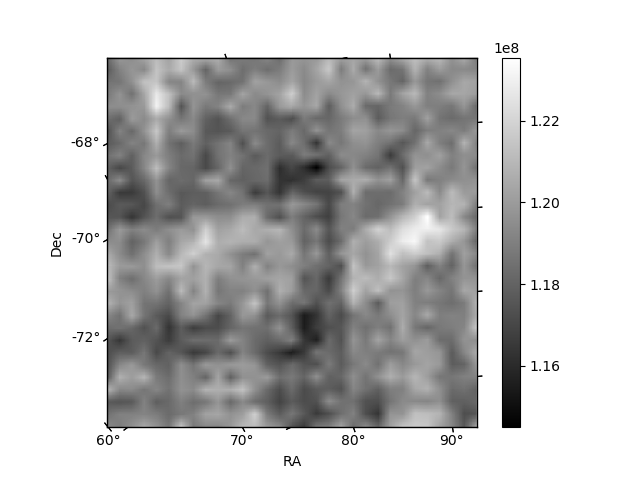
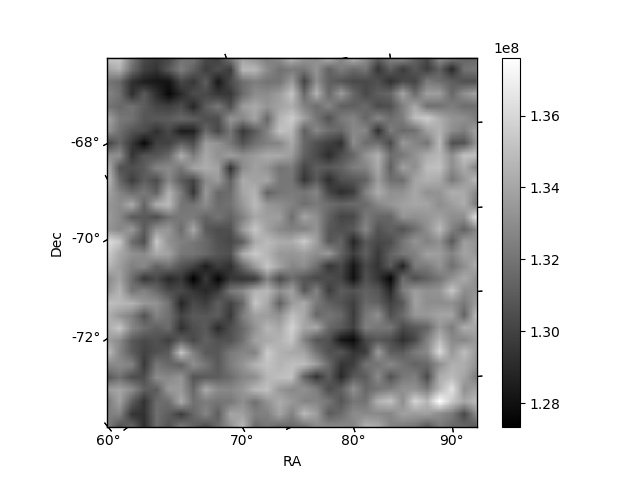
Histogram calculated using DETX and DETY for each event in the final _common_clean file
| Quadrant A | 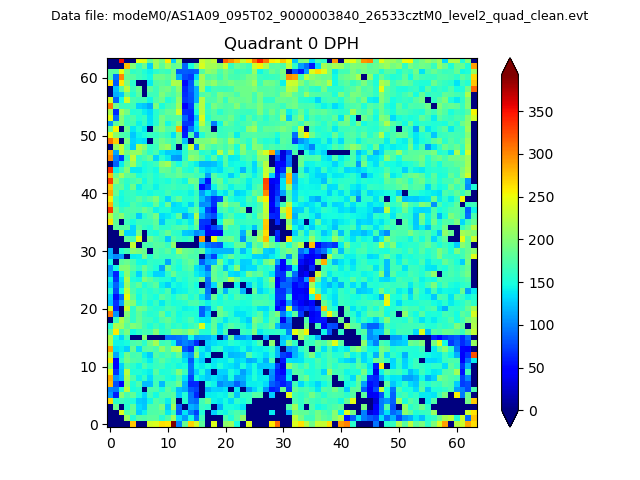 |
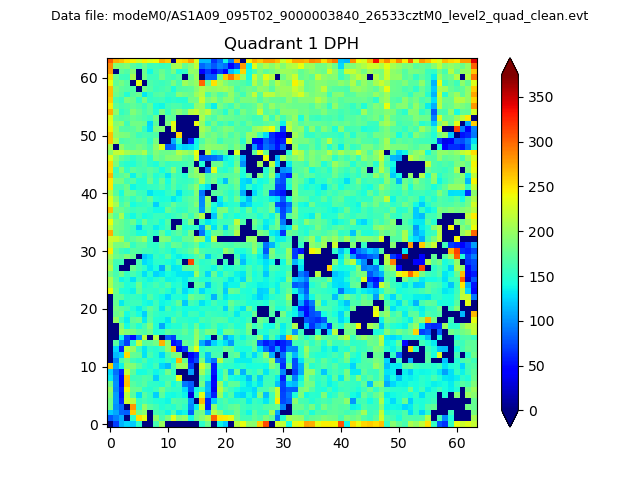 |
Quadrant B |
|---|---|---|---|
| Quadrant D | 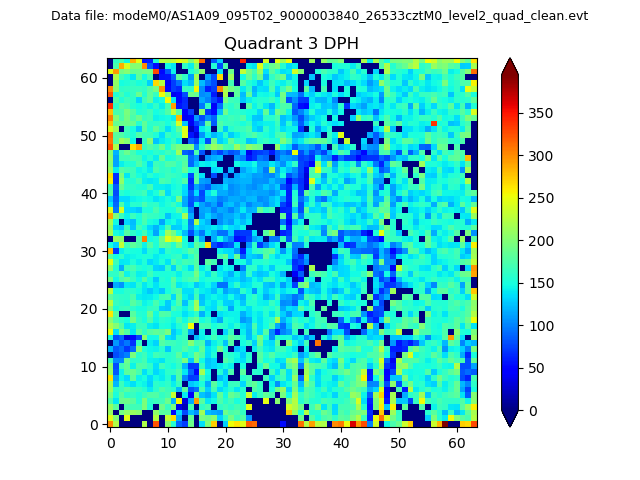 |
 |
Quadrant C |
| Plot type | Count rate plots | Images |
|---|---|---|
| Comparison with Poisson distribution Blue bars denote a histogram of data divided into 1 sec bins. Red curve is a Poisson curve with rate = median count rate of data. |
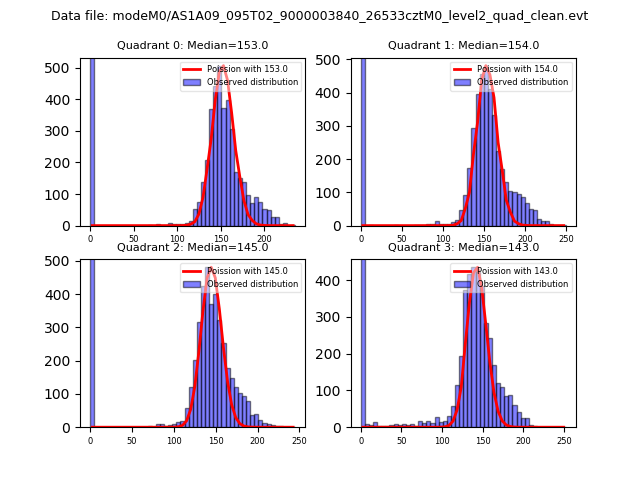 |
 |
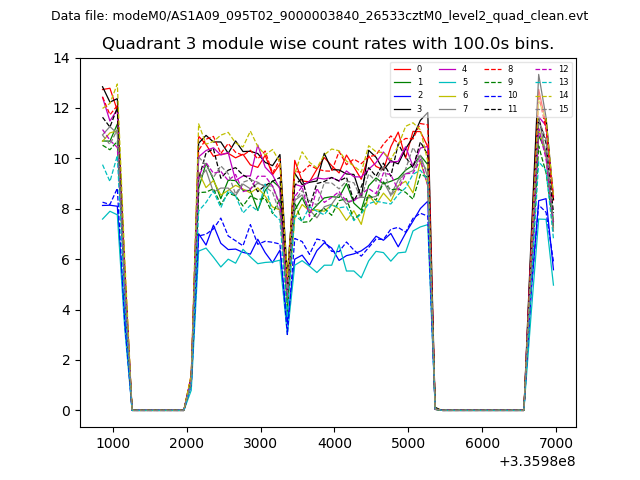
| Quadrant-wise count rates Data is divided into 100 sec bins |
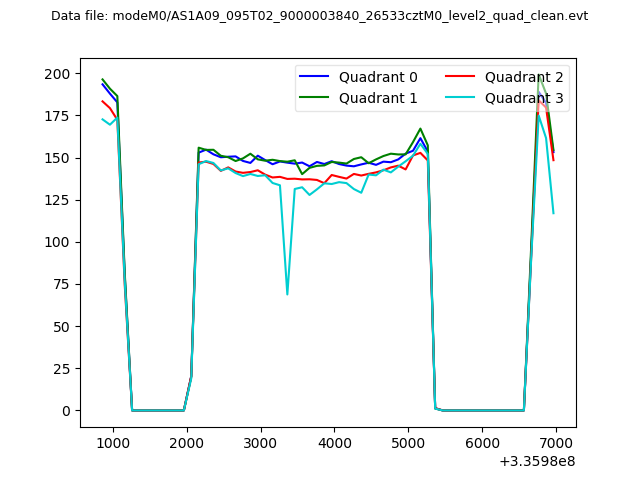 |
|
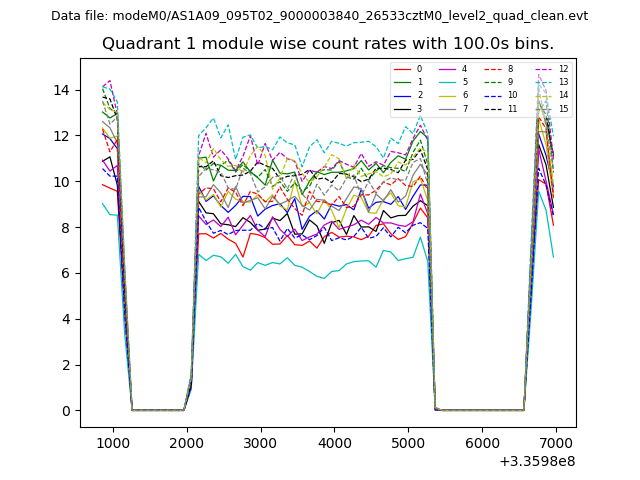
| Module-wise count rates for Quadrant A Data is divided into 100 sec bins |
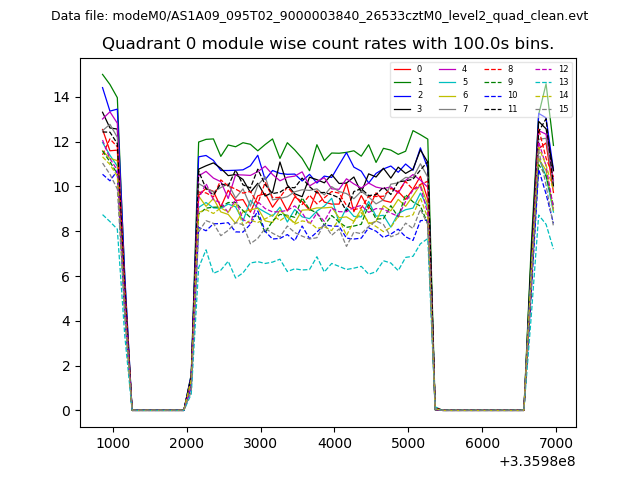 |
 |
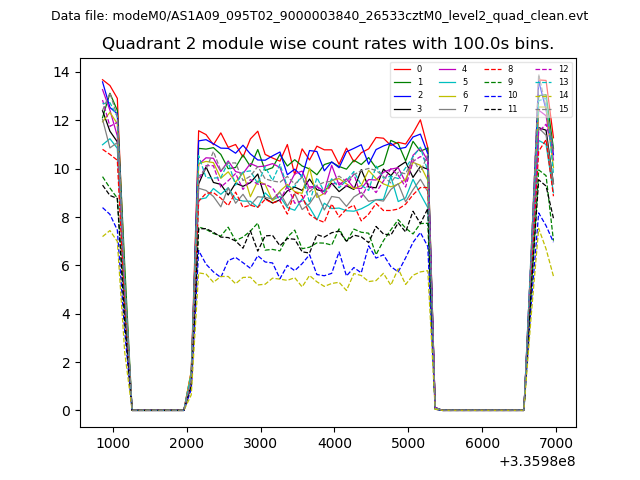
| Module-wise count rates for Quadrant B Data is divided into 100 sec bins |
 |
 |
| Module-wise count rates for Quadrant C Data is divided into 100 sec bins |
 |
 |
| Module-wise count rates for Quadrant D Data is divided into 100 sec bins |
 |
 |
| Parameter | Plot |
|---|---|
| CZT HV Monitor | 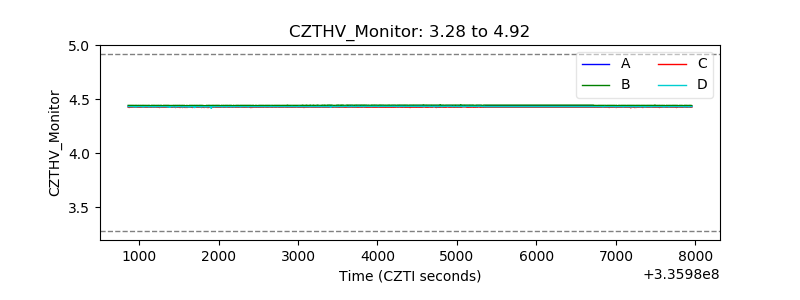 |
| D_VDD | 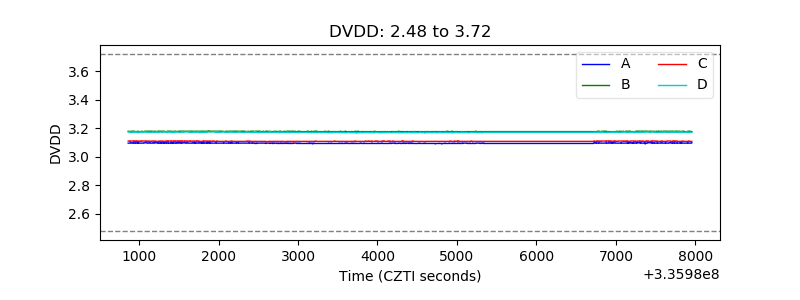 |
| Temperature 1 | 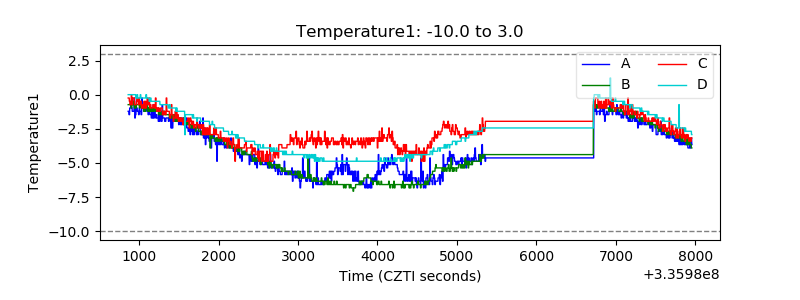 |
| Veto HV Monitor |  |
| Veto LLD | 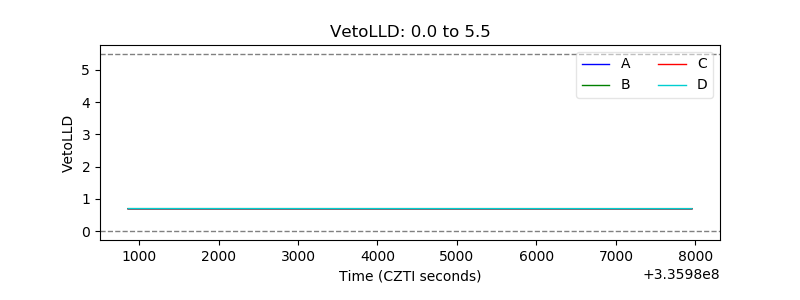 |
| Alpha Counter |  |
| _CPM_Rate |  |
| CZT Counter | 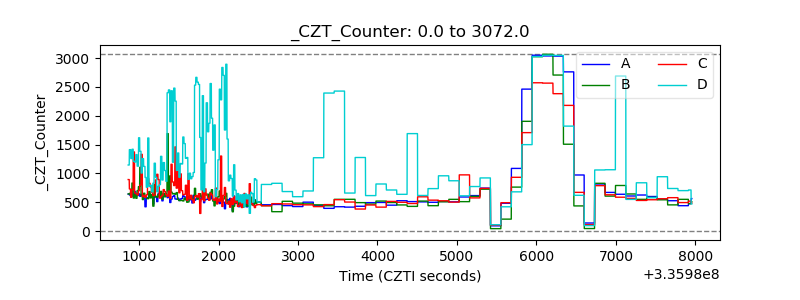 |
| +2.5 Volts monitor | 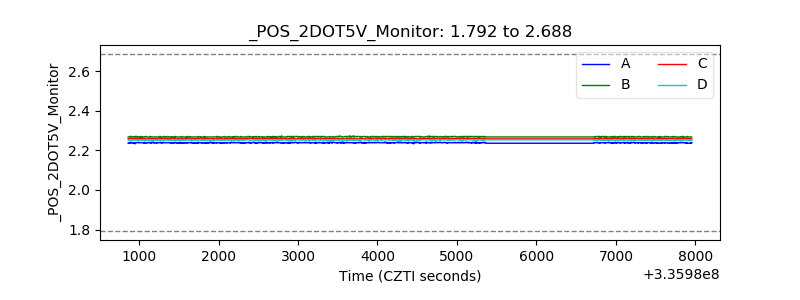 |
| +5 Volts monitor | 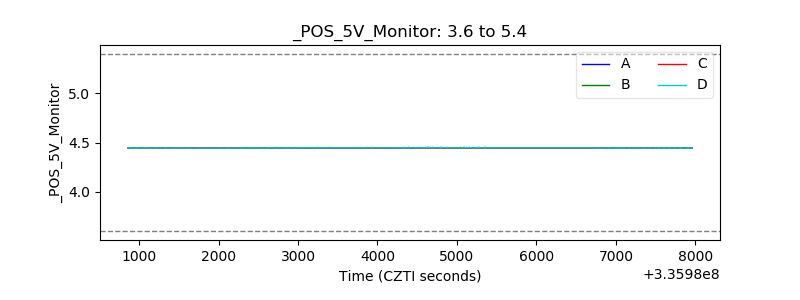 |
| _ROLL_ROT | 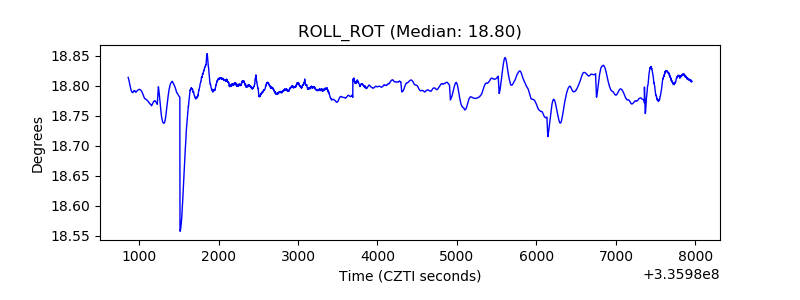 |
| _Roll_DEC |  |
| _Roll_RA | 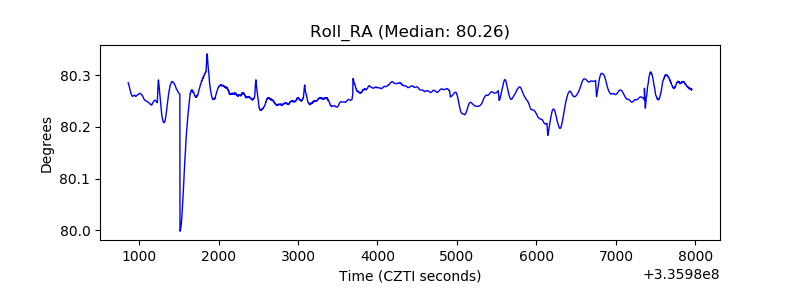 |
| Veto Counter | 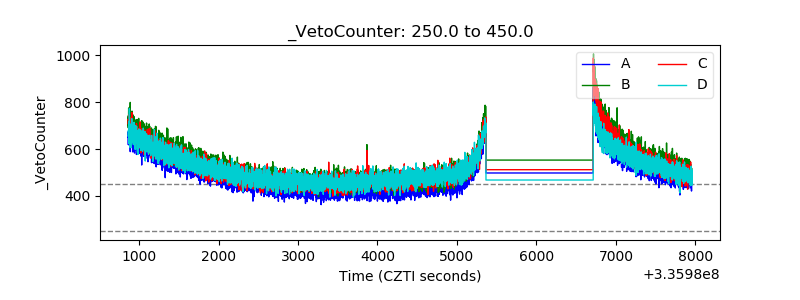 |