| Param | Original file | Final file |
|---|---|---|
| Filename | modeM0/AS1A09_095T02_9000003840_26534cztM0_level2.evt | modeM0/AS1A09_095T02_9000003840_26534cztM0_level2_quad_clean.evt |
| Size (bytes) | 560,450,880 | 98,239,680 |
| Size | 534.5 MB | 93.7 MB |
| Events in quadrant A | 3,391,143 | 654,861 |
| Events in quadrant B | 3,442,257 | 664,121 |
| Events in quadrant C | 3,415,534 | 630,091 |
| Events in quadrant D | 6,299,314 | 587,826 |
| Mode M9 | |||
|---|---|---|---|
| Quadrant | BADHDUFLAG | Total packets | Discarded packets |
| A | 0 | 12 | 0 |
| B | 0 | 12 | 0 |
| C | 0 | 12 | 0 |
| D | 0 | 12 | 0 |
| Mode M0 | |||
|---|---|---|---|
| Quadrant | BADHDUFLAG | Total packets | Discarded packets |
| A | 0 | 13979 | 0 |
| B | 0 | 14110 | 0 |
| C | 0 | 14038 | 0 |
| D | 0 | 23289 | 0 |
| Quadrant | Total seconds | Saturated seconds | Saturation percentage |
|---|---|---|---|
| A | 6275 | 68 | 1.083665% |
| B | 6276 | 89 | 1.418101% |
| C | 6276 | 117 | 1.864245% |
| D | 6276 | 671 | 10.691523% |
Noise dominated data is calculated using 1-second bins in cleaned event files. If a bin has >2000 counts, and if more than 50% of those come from <1% of pixels, then it is considered to be noise-dominated and hence unusable.
| Quadrant | # 1 sec bins | Bins with >0 counts | Bins with >2000 counts | High rate bins dominated by noise | Noise dominated (total time) | Noise dominated (detector-on time) | Marked lightcurve |
|---|---|---|---|---|---|---|---|
| A | 7505 | 6275 | 17 | 17 | 0.23% | 0.27% | 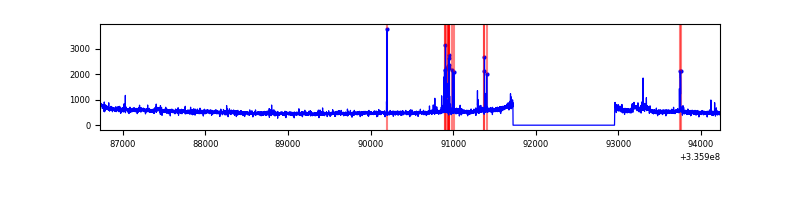 |
| B | 7506 | 6277 | 5 | 5 | 0.07% | 0.08% | 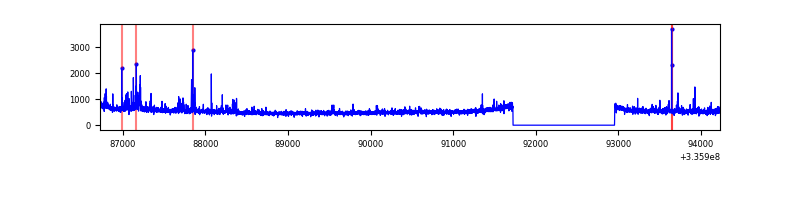 |
| C | 7506 | 6276 | 5 | 5 | 0.07% | 0.08% | 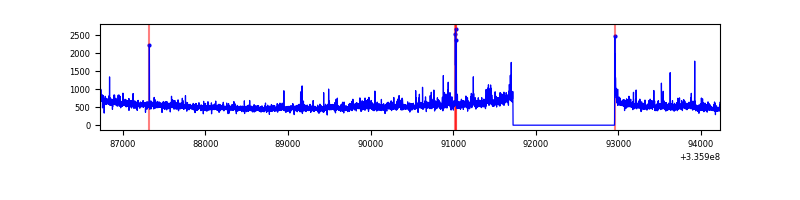 |
| D | 7506 | 6277 | 644 | 644 | 8.58% | 10.26% | 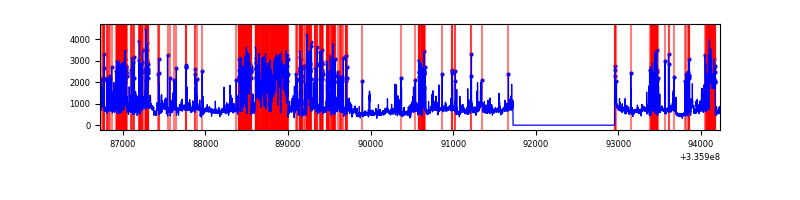 |
Top three noisy pixels from each quadrant. If the there are fewer than three noisy pixels in the level2.evt file, extra rows are filled as -1
| Pixel properties | Quadrant properties | ||||||
|---|---|---|---|---|---|---|---|
| Quadrant | DetID | PixID | Counts | Sigma | Mean | Median | Sigma |
| A | 0 | 13 | 99884 | 614.15 | 819 | 806 | 161.3 |
| A | 9 | 130 | 70078 | 429.39 | 819 | 806 | 161.3 |
| A | 5 | 168 | 62719 | 383.78 | 819 | 806 | 161.3 |
| B | 3 | 112 | 89328 | 588.21 | 816 | 798 | 150.5 |
| B | 5 | 172 | 68702 | 451.17 | 816 | 798 | 150.5 |
| B | 0 | 186 | 42192 | 275.03 | 816 | 798 | 150.5 |
| C | 3 | 233 | 161447 | 908.66 | 775 | 782 | 176.8 |
| C | 14 | 238 | 128499 | 722.32 | 775 | 782 | 176.8 |
| C | 4 | 254 | 90220 | 505.83 | 775 | 782 | 176.8 |
| D | 7 | 80 | 1910700 | 10557.96 | 761 | 744 | 180.9 |
| D | 1 | 52 | 1258638 | 6953.46 | 761 | 744 | 180.9 |
| D | 13 | 104 | 144923 | 797.0 | 761 | 744 | 180.9 |
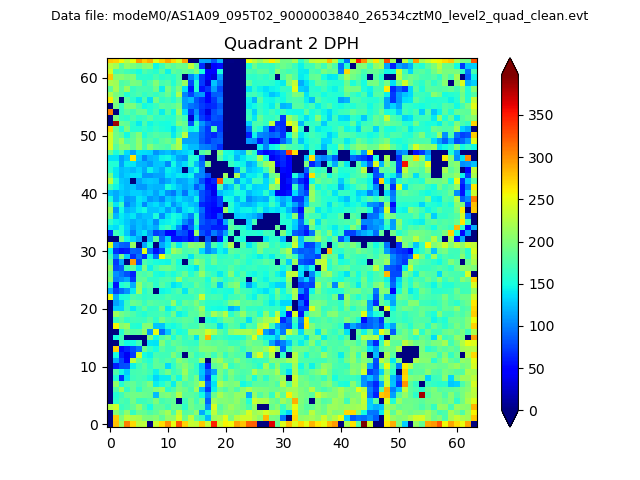
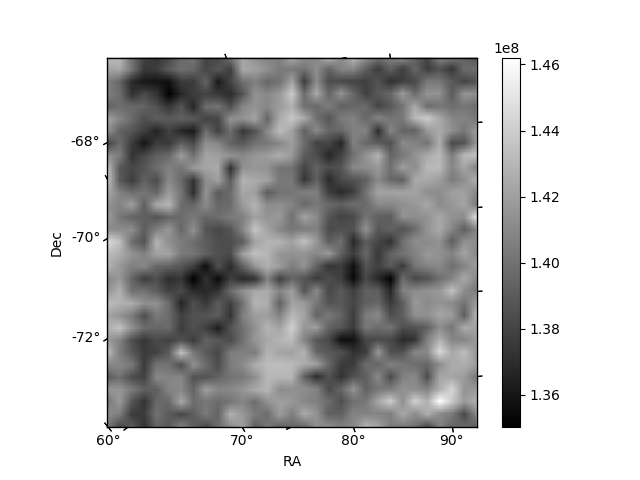
Histogram calculated using DETX and DETY for each event in the final _common_clean file
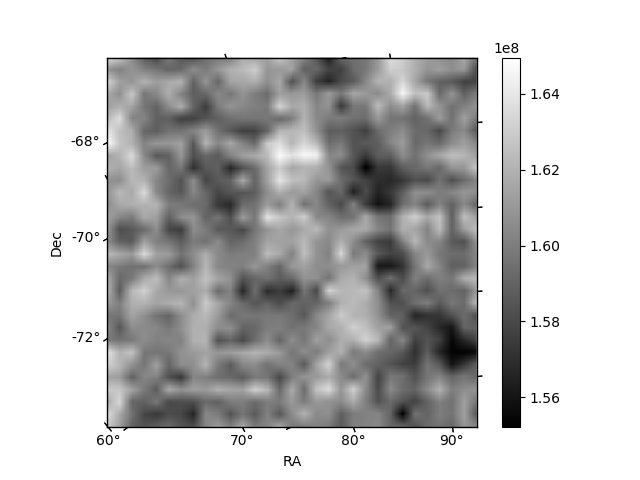
| Quadrant A | 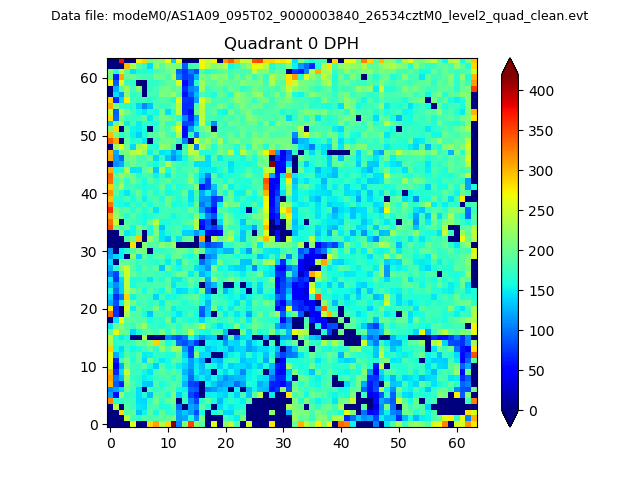 |
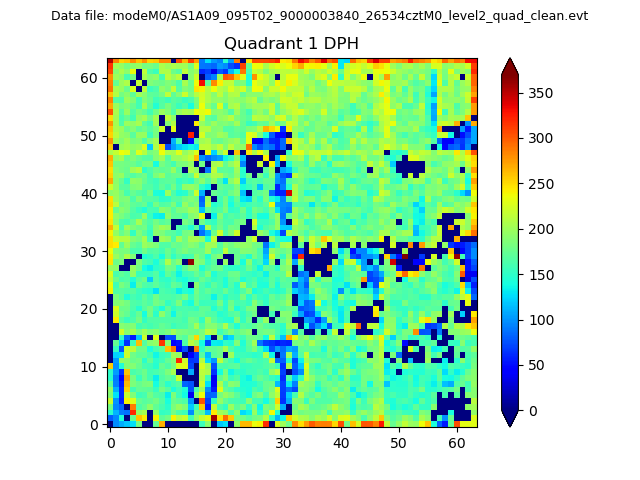 |
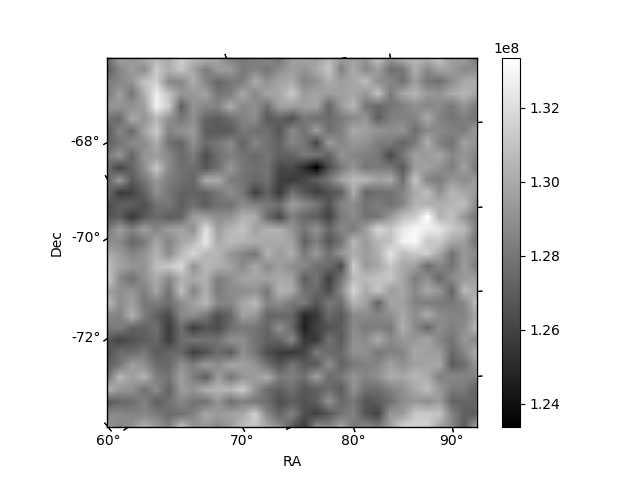
Quadrant B |
|---|---|---|---|
| Quadrant D | 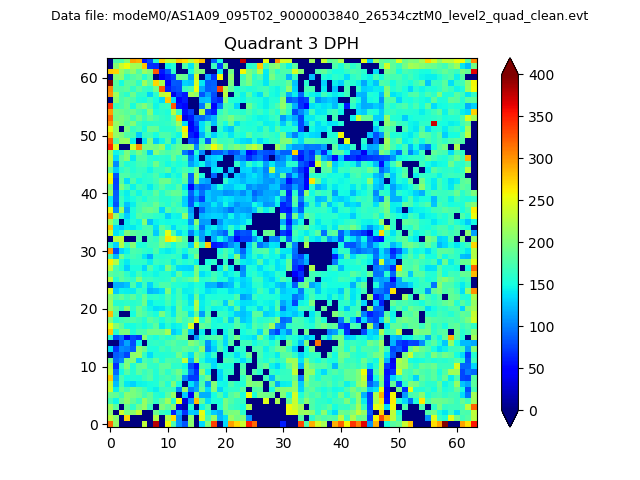 |
 |
Quadrant C |
| Plot type | Count rate plots | Images |
|---|---|---|
| Comparison with Poisson distribution Blue bars denote a histogram of data divided into 1 sec bins. Red curve is a Poisson curve with rate = median count rate of data. |
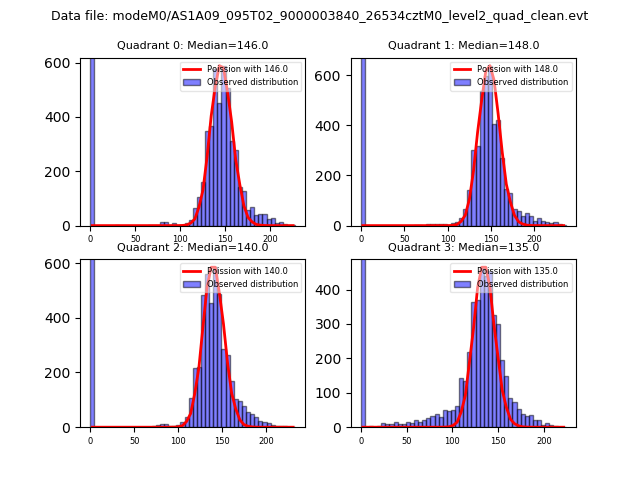 |
 |
| Quadrant-wise count rates Data is divided into 100 sec bins |
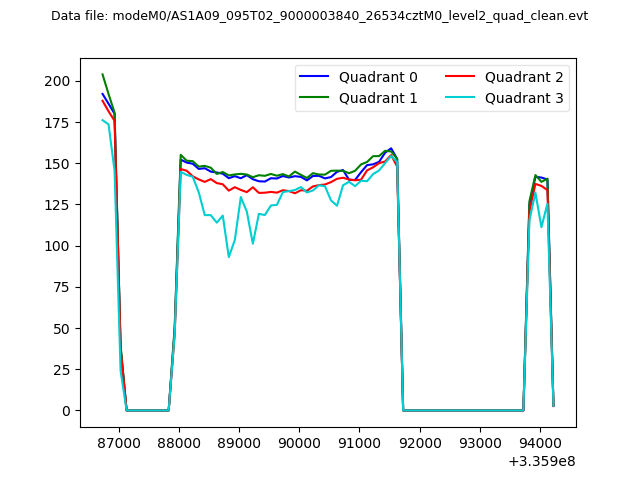 |
|
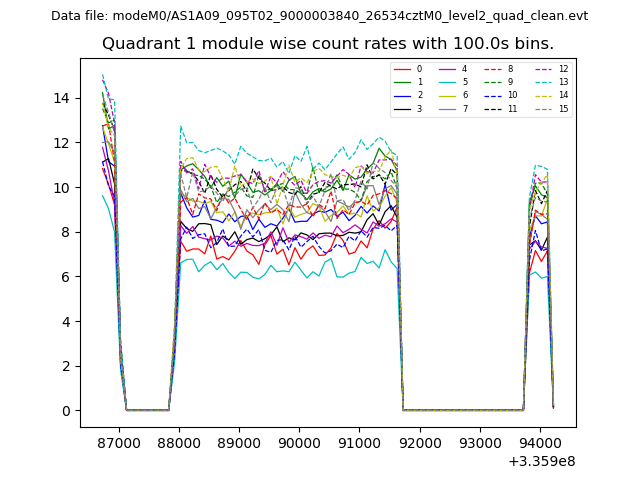
| Module-wise count rates for Quadrant A Data is divided into 100 sec bins |
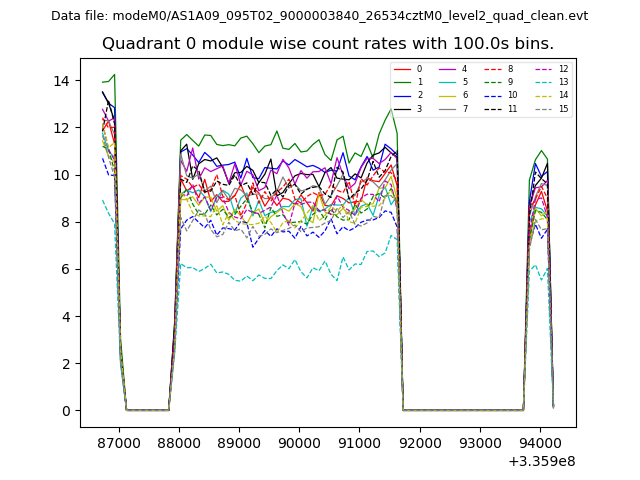 |
 |
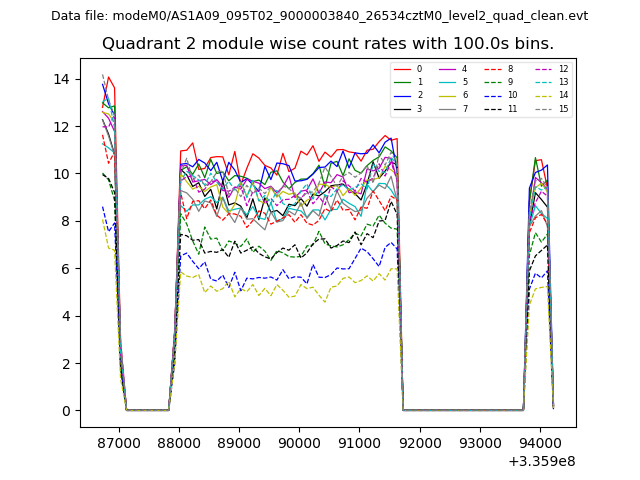
| Module-wise count rates for Quadrant B Data is divided into 100 sec bins |
 |
 |
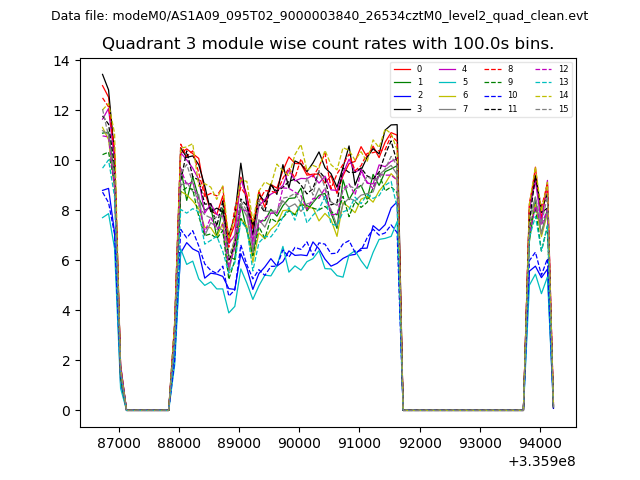
| Module-wise count rates for Quadrant C Data is divided into 100 sec bins |
 |
 |
| Module-wise count rates for Quadrant D Data is divided into 100 sec bins |
 |
 |
| Parameter | Plot |
|---|---|
| CZT HV Monitor | 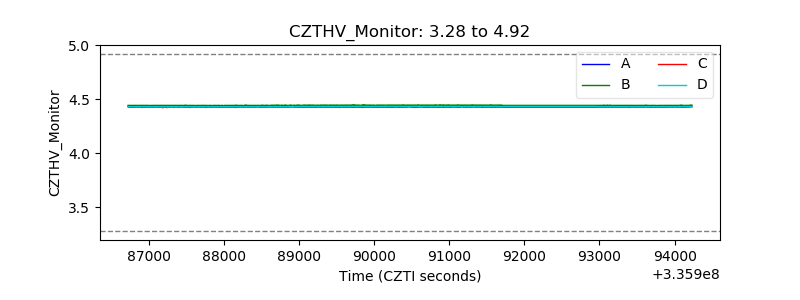 |
| D_VDD | 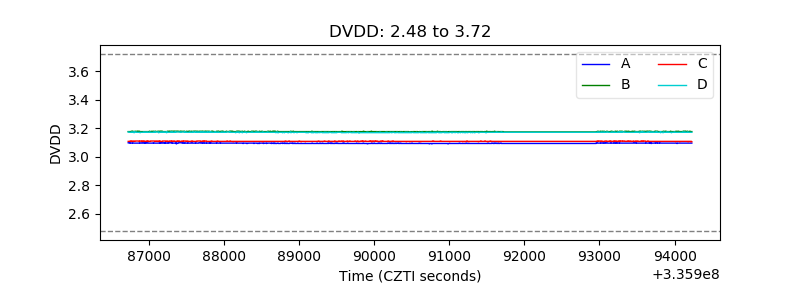 |
| Temperature 1 | 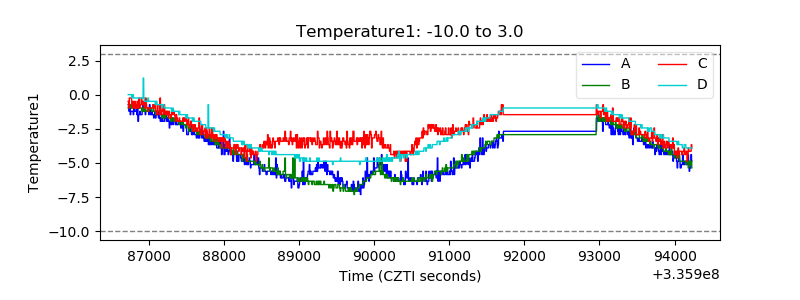 |
| Veto HV Monitor | 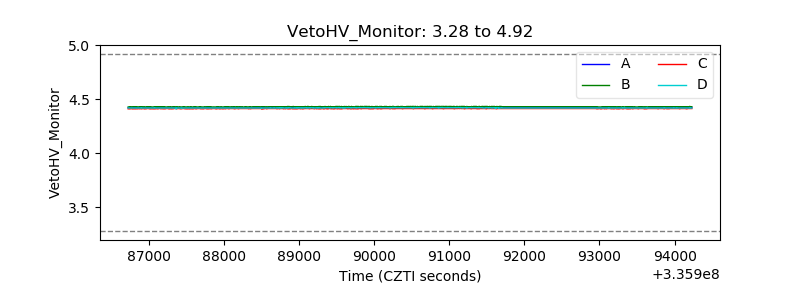 |
| Veto LLD | 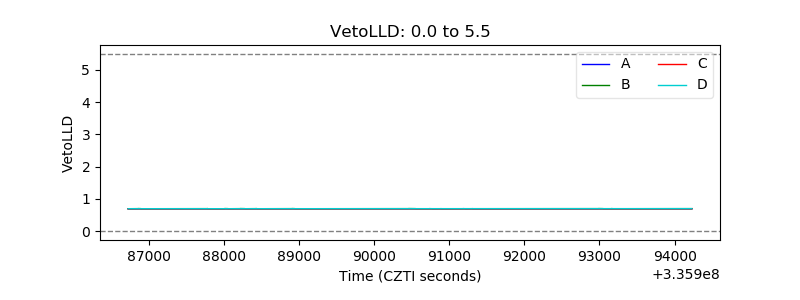 |
| Alpha Counter | 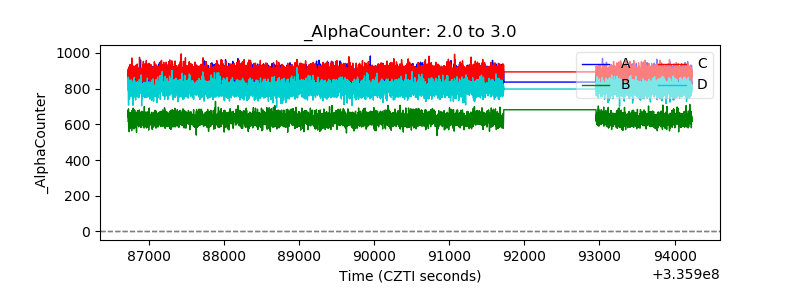 |
| _CPM_Rate | 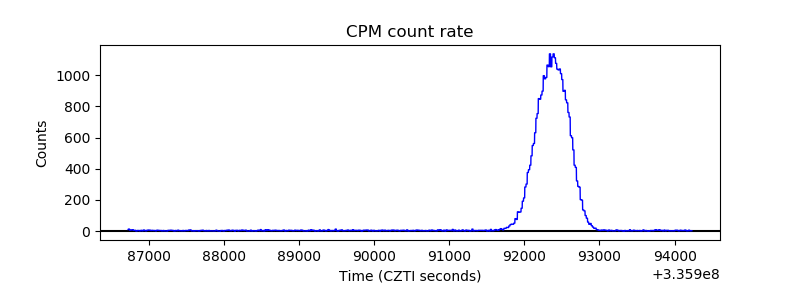 |
| CZT Counter |  |
| +2.5 Volts monitor |  |
| +5 Volts monitor | 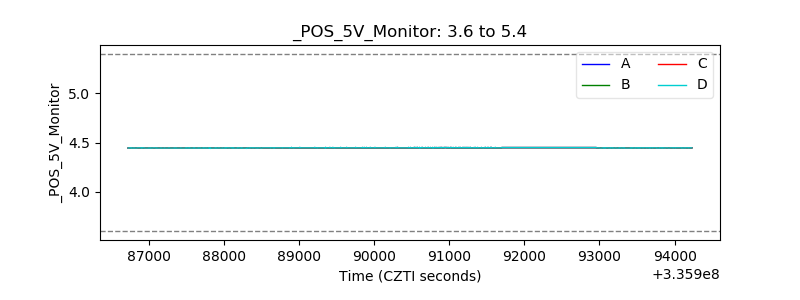 |
| _ROLL_ROT | 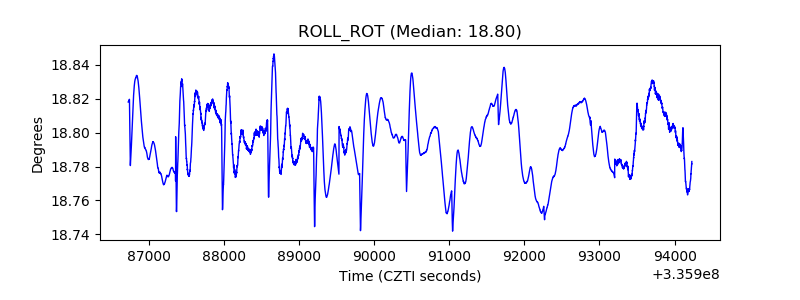 |
| _Roll_DEC | 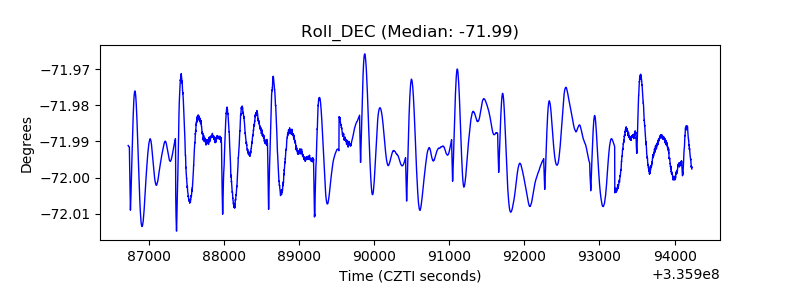 |
| _Roll_RA | 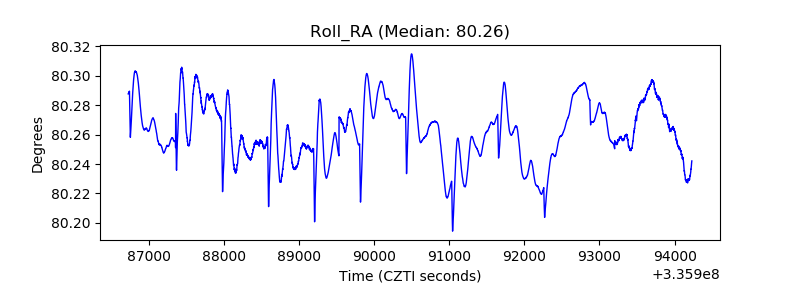 |
| Veto Counter | 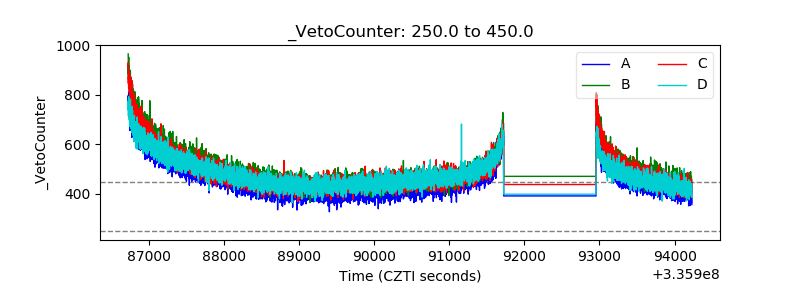 |