| Param | Original file | Final file |
|---|---|---|
| Filename | modeM0/AS1A09_095T02_9000003840_26535cztM0_level2.evt | modeM0/AS1A09_095T02_9000003840_26535cztM0_level2_quad_clean.evt |
| Size (bytes) | 601,070,400 | 109,437,120 |
| Size | 573.2 MB | 104.4 MB |
| Events in quadrant A | 3,852,722 | 724,887 |
| Events in quadrant B | 3,546,574 | 742,289 |
| Events in quadrant C | 4,115,849 | 696,994 |
| Events in quadrant D | 6,229,487 | 677,620 |
| Mode M9 | |||
|---|---|---|---|
| Quadrant | BADHDUFLAG | Total packets | Discarded packets |
| A | 0 | 13 | 0 |
| B | 0 | 14 | 0 |
| C | 0 | 14 | 0 |
| D | 0 | 14 | 0 |
| Mode M0 | |||
|---|---|---|---|
| Quadrant | BADHDUFLAG | Total packets | Discarded packets |
| A | 0 | 15611 | 0 |
| B | 0 | 14670 | 0 |
| C | 0 | 16359 | 0 |
| D | 0 | 23214 | 0 |
| Quadrant | Total seconds | Saturated seconds | Saturation percentage |
|---|---|---|---|
| A | 6776 | 171 | 2.523613% |
| B | 6776 | 84 | 1.239669% |
| C | 6776 | 302 | 4.456907% |
| D | 6775 | 499 | 7.365314% |
Noise dominated data is calculated using 1-second bins in cleaned event files. If a bin has >2000 counts, and if more than 50% of those come from <1% of pixels, then it is considered to be noise-dominated and hence unusable.
| Quadrant | # 1 sec bins | Bins with >0 counts | Bins with >2000 counts | High rate bins dominated by noise | Noise dominated (total time) | Noise dominated (detector-on time) | Marked lightcurve |
|---|---|---|---|---|---|---|---|
| A | 7681 | 6777 | 120 | 120 | 1.56% | 1.77% | 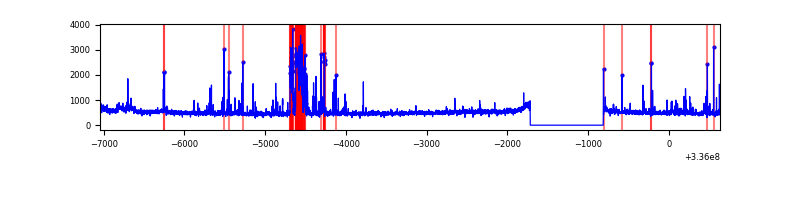 |
| B | 7681 | 6777 | 13 | 13 | 0.17% | 0.19% | 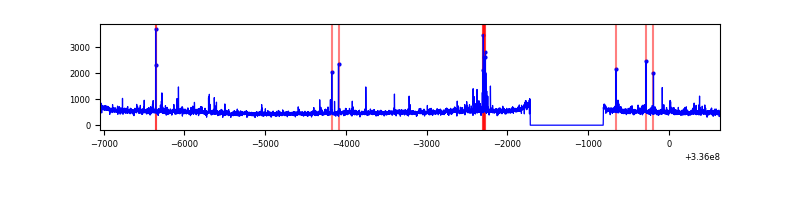 |
| C | 7681 | 6777 | 209 | 209 | 2.72% | 3.08% | 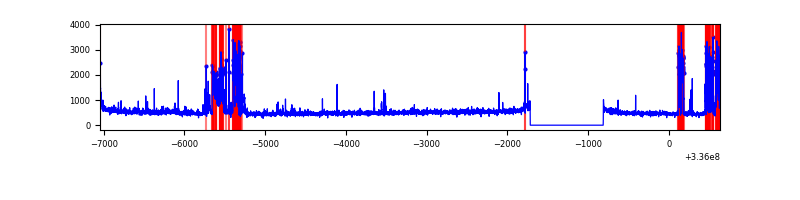 |
| D | 7680 | 6776 | 460 | 460 | 5.99% | 6.79% | 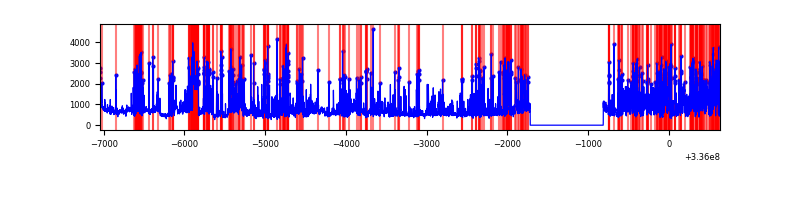 |
Top three noisy pixels from each quadrant. If the there are fewer than three noisy pixels in the level2.evt file, extra rows are filled as -1
| Pixel properties | Quadrant properties | ||||||
|---|---|---|---|---|---|---|---|
| Quadrant | DetID | PixID | Counts | Sigma | Mean | Median | Sigma |
| A | 9 | 130 | 387531 | 2340.01 | 827 | 811 | 165.3 |
| A | 0 | 13 | 170187 | 1024.88 | 827 | 811 | 165.3 |
| A | 5 | 168 | 99868 | 599.39 | 827 | 811 | 165.3 |
| B | 3 | 112 | 208403 | 1358.51 | 829 | 811 | 152.8 |
| B | 0 | 229 | 27700 | 175.97 | 829 | 811 | 152.8 |
| B | 5 | 172 | 26314 | 166.9 | 829 | 811 | 152.8 |
| C | 15 | 127 | 753264 | 4157.77 | 788 | 796 | 181.0 |
| C | 14 | 238 | 127132 | 698.07 | 788 | 796 | 181.0 |
| C | 3 | 233 | 98604 | 540.44 | 788 | 796 | 181.0 |
| D | 1 | 52 | 1699665 | 9114.33 | 785 | 767 | 186.4 |
| D | 7 | 80 | 1116666 | 5986.63 | 785 | 767 | 186.4 |
| D | 13 | 104 | 342451 | 1833.08 | 785 | 767 | 186.4 |
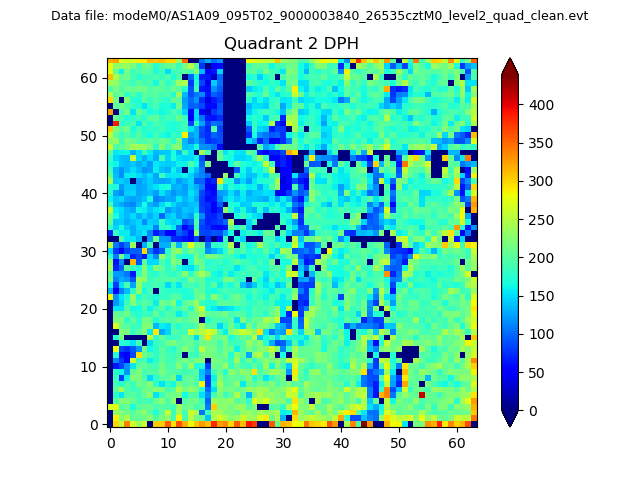
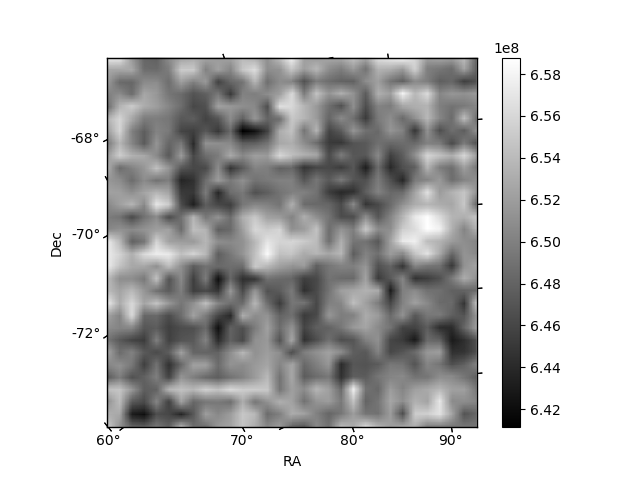
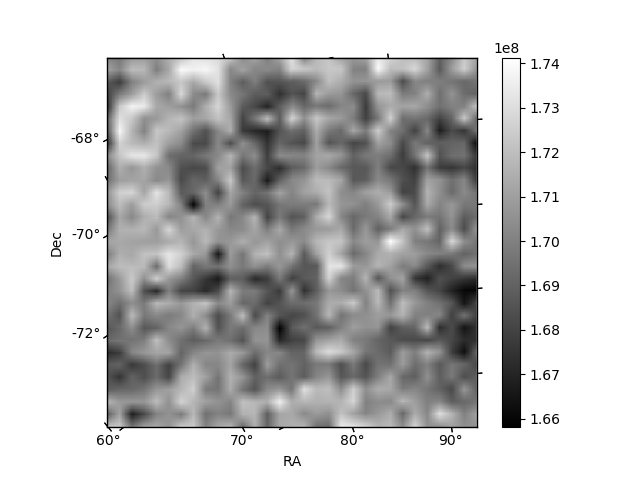
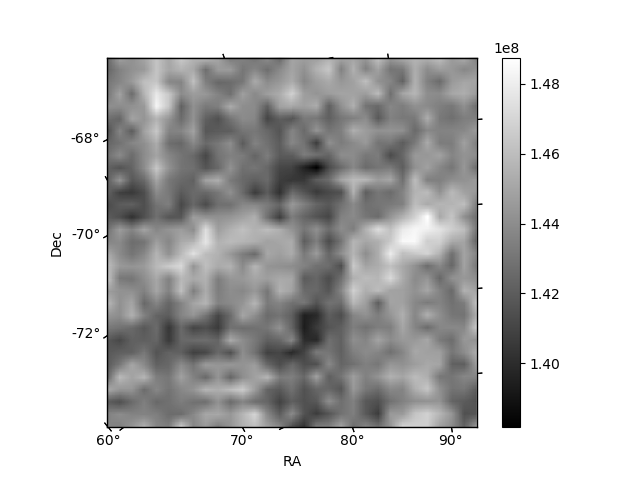
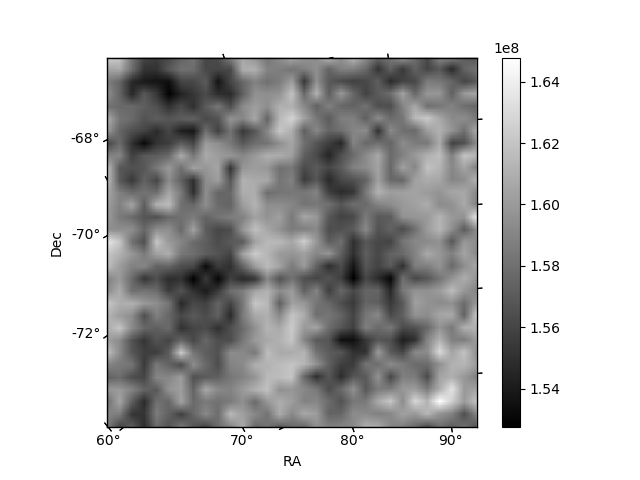
Histogram calculated using DETX and DETY for each event in the final _common_clean file
| Quadrant A | 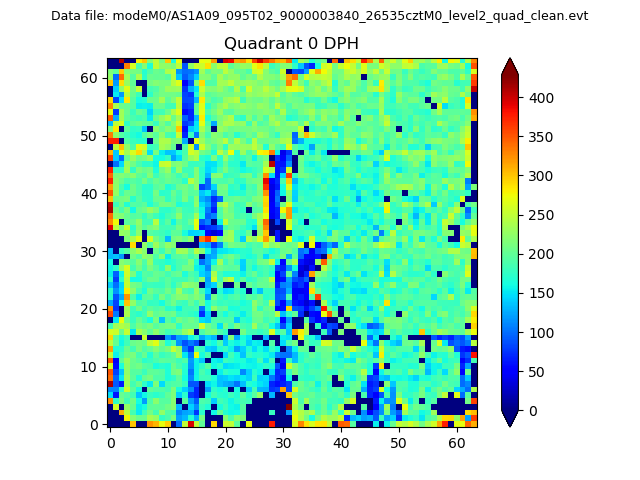 |
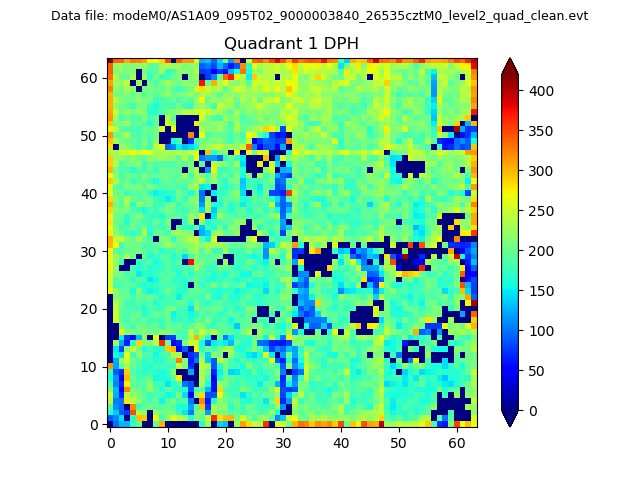 |
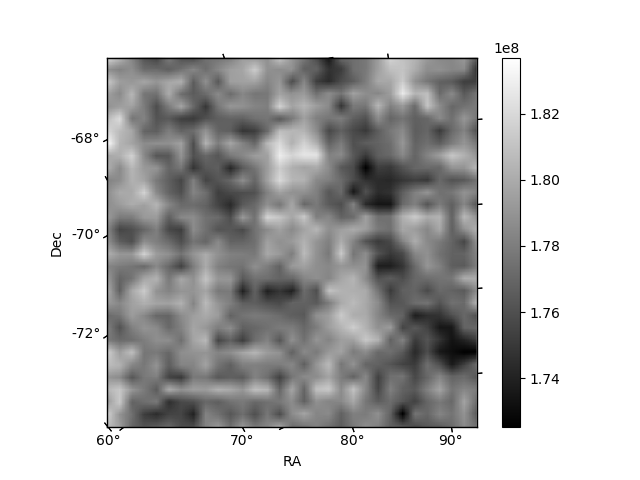
Quadrant B |
|---|---|---|---|
| Quadrant D | 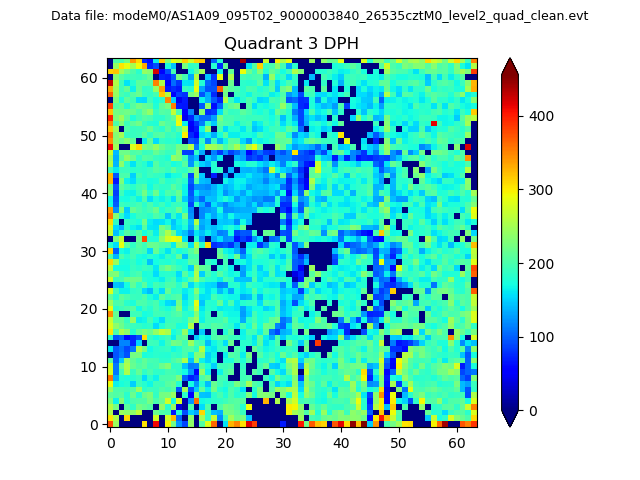 |
 |
Quadrant C |
| Plot type | Count rate plots | Images |
|---|---|---|
| Comparison with Poisson distribution Blue bars denote a histogram of data divided into 1 sec bins. Red curve is a Poisson curve with rate = median count rate of data. |
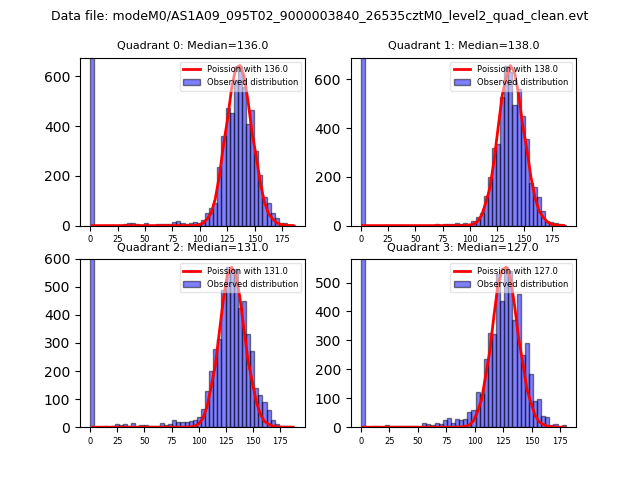 |
 |
| Quadrant-wise count rates Data is divided into 100 sec bins |
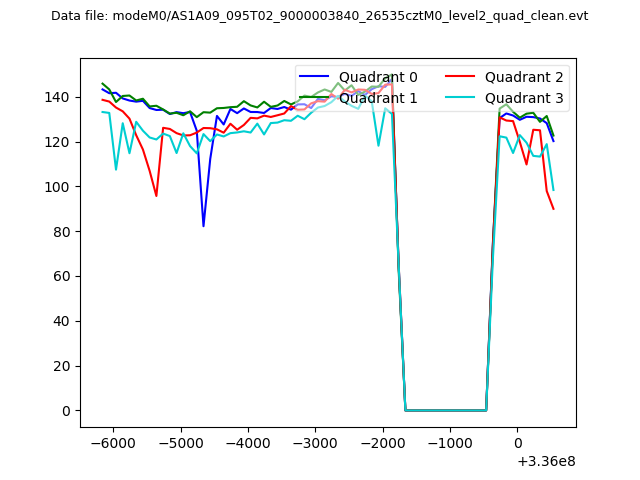 |
|
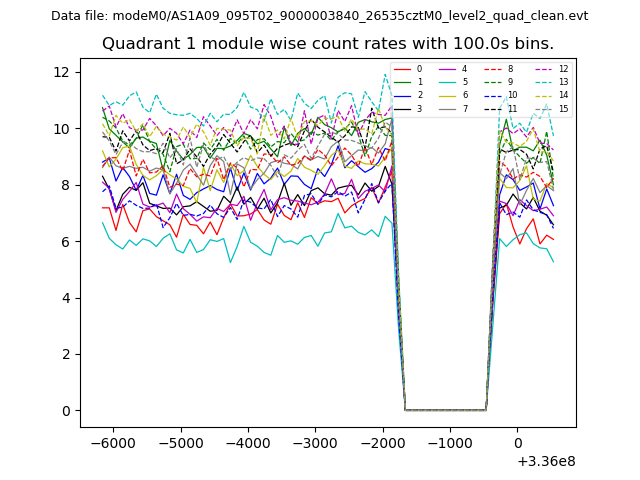
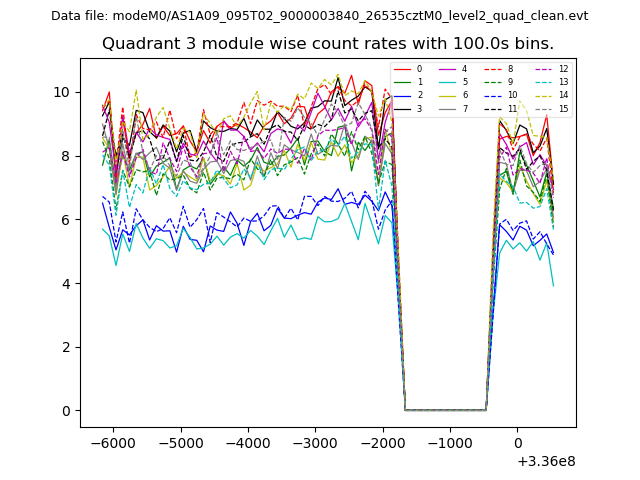
| Module-wise count rates for Quadrant A Data is divided into 100 sec bins |
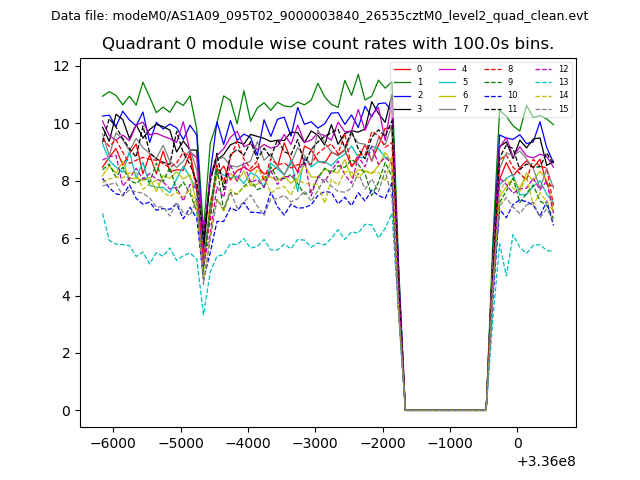 |
 |
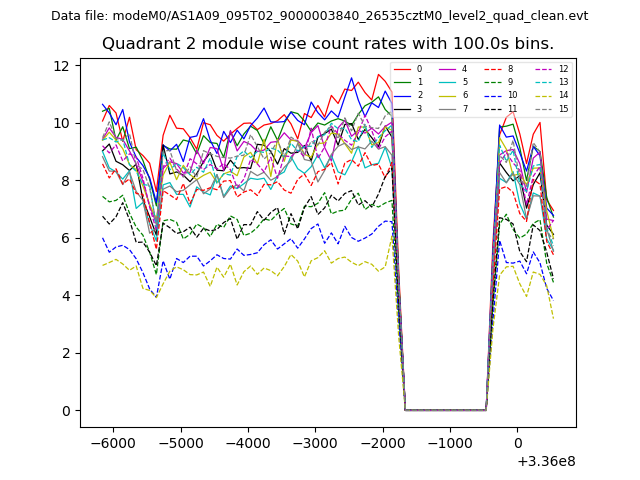
| Module-wise count rates for Quadrant B Data is divided into 100 sec bins |
 |
 |
| Module-wise count rates for Quadrant C Data is divided into 100 sec bins |
 |
 |
| Module-wise count rates for Quadrant D Data is divided into 100 sec bins |
 |
 |
| Parameter | Plot |
|---|---|
| CZT HV Monitor | 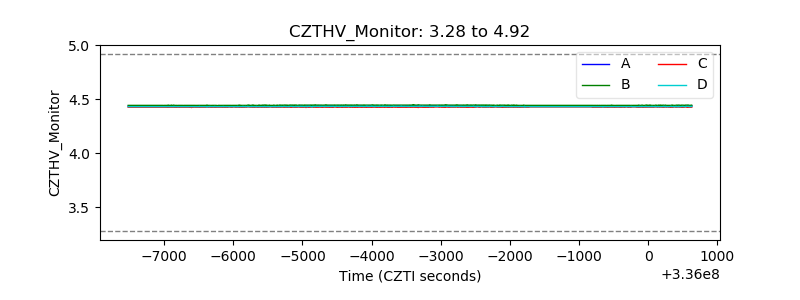 |
| D_VDD | 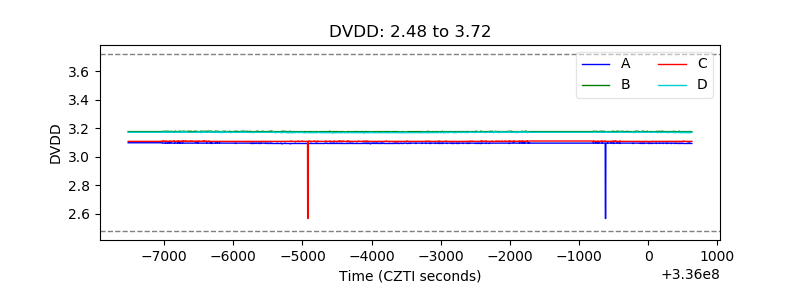 |
| Temperature 1 | 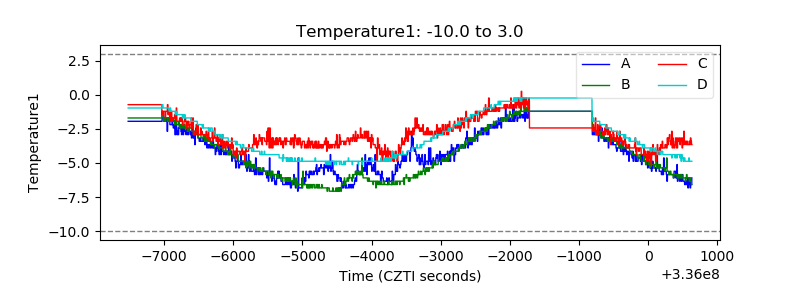 |
| Veto HV Monitor |  |
| Veto LLD | 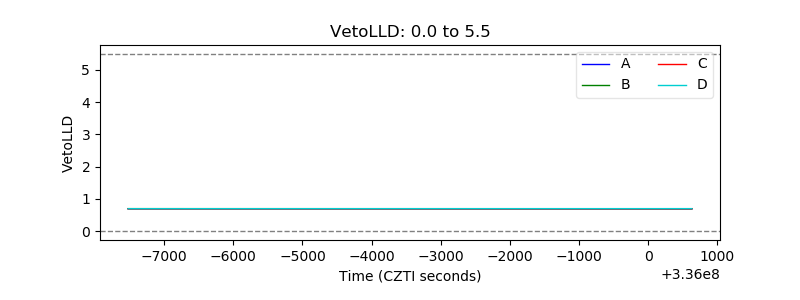 |
| Alpha Counter | 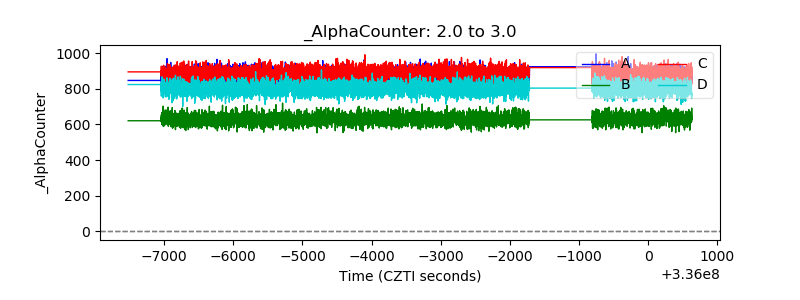 |
| _CPM_Rate | 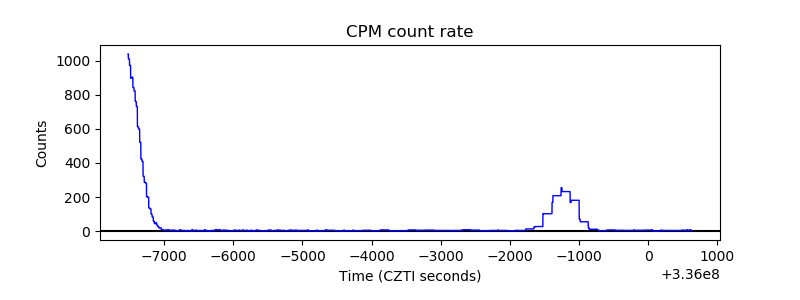 |
| CZT Counter | 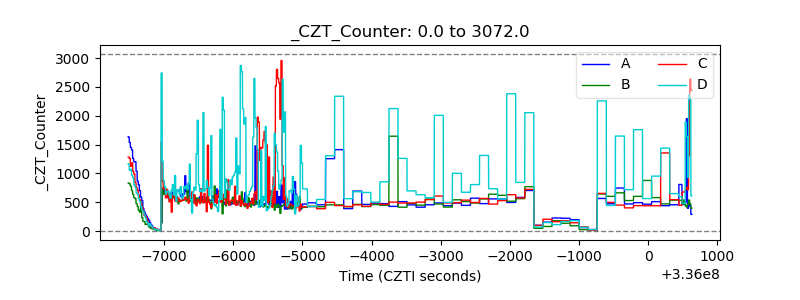 |
| +2.5 Volts monitor |  |
| +5 Volts monitor |  |
| _ROLL_ROT | 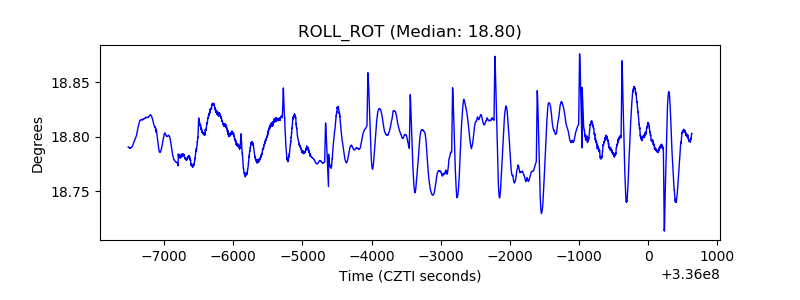 |
| _Roll_DEC |  |
| _Roll_RA | 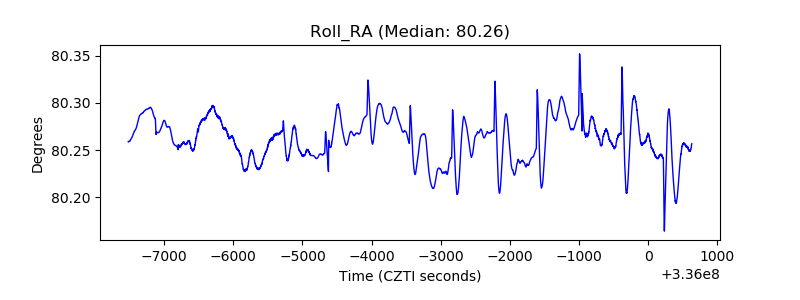 |
| Veto Counter | 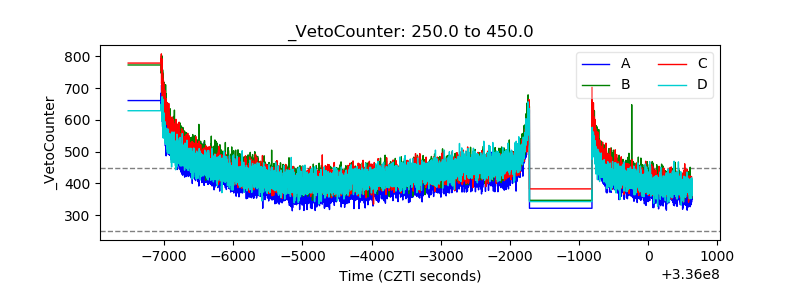 |