| Param | Original file | Final file |
|---|---|---|
| Filename | modeM0/AS1A09_095T02_9000003840_26536cztM0_level2.evt | modeM0/AS1A09_095T02_9000003840_26536cztM0_level2_quad_clean.evt |
| Size (bytes) | 744,488,640 | 120,058,560 |
| Size | 710.0 MB | 114.5 MB |
| Events in quadrant A | 3,954,107 | 812,869 |
| Events in quadrant B | 3,806,841 | 828,783 |
| Events in quadrant C | 4,803,406 | 768,269 |
| Events in quadrant D | 9,488,057 | 716,321 |
| Mode M9 | |||
|---|---|---|---|
| Quadrant | BADHDUFLAG | Total packets | Discarded packets |
| A | 0 | 7 | 0 |
| B | 0 | 8 | 0 |
| C | 0 | 8 | 0 |
| D | 0 | 8 | 0 |
| Mode M0 | |||
|---|---|---|---|
| Quadrant | BADHDUFLAG | Total packets | Discarded packets |
| A | 0 | 16434 | 0 |
| B | 0 | 15900 | 0 |
| C | 0 | 18844 | 0 |
| D | 0 | 33225 | 0 |
| Quadrant | Total seconds | Saturated seconds | Saturation percentage |
|---|---|---|---|
| A | 7325 | 146 | 1.993174% |
| B | 7325 | 112 | 1.529010% |
| C | 7325 | 552 | 7.535836% |
| D | 7325 | 1421 | 19.399317% |
Noise dominated data is calculated using 1-second bins in cleaned event files. If a bin has >2000 counts, and if more than 50% of those come from <1% of pixels, then it is considered to be noise-dominated and hence unusable.
| Quadrant | # 1 sec bins | Bins with >0 counts | Bins with >2000 counts | High rate bins dominated by noise | Noise dominated (total time) | Noise dominated (detector-on time) | Marked lightcurve |
|---|---|---|---|---|---|---|---|
| A | 7750 | 7326 | 52 | 52 | 0.67% | 0.71% | 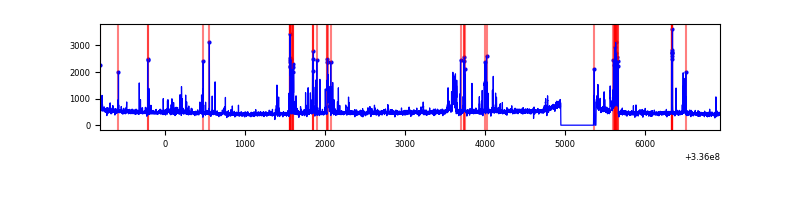 |
| B | 7750 | 7327 | 11 | 11 | 0.14% | 0.15% | 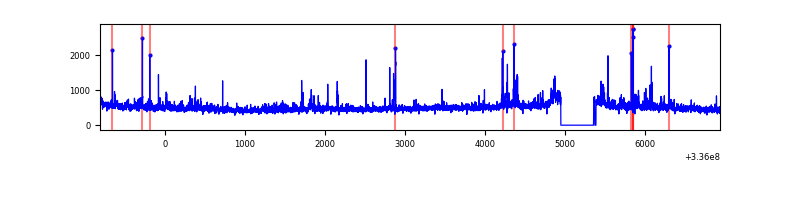 |
| C | 7750 | 7327 | 398 | 398 | 5.14% | 5.43% | 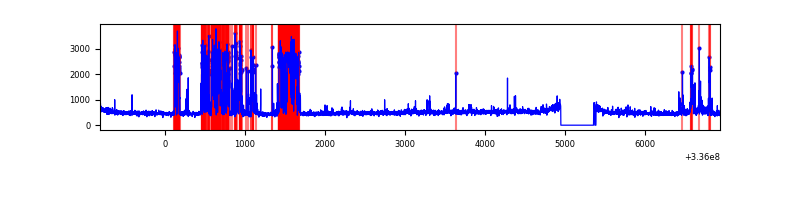 |
| D | 7750 | 7325 | 1303 | 1303 | 16.81% | 17.79% | 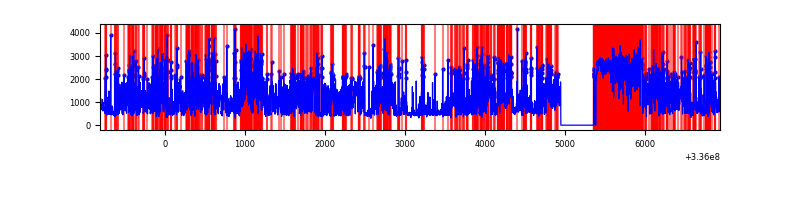 |
Top three noisy pixels from each quadrant. If the there are fewer than three noisy pixels in the level2.evt file, extra rows are filled as -1
| Pixel properties | Quadrant properties | ||||||
|---|---|---|---|---|---|---|---|
| Quadrant | DetID | PixID | Counts | Sigma | Mean | Median | Sigma |
| A | 0 | 13 | 486764 | 2772.25 | 876 | 857 | 175.3 |
| A | 5 | 168 | 83107 | 469.26 | 876 | 857 | 175.3 |
| A | 13 | 254 | 12307 | 65.33 | 876 | 857 | 175.3 |
| B | 3 | 112 | 238207 | 1446.21 | 874 | 851 | 164.1 |
| B | 3 | 64 | 84356 | 508.79 | 874 | 851 | 164.1 |
| B | 5 | 172 | 36033 | 214.36 | 874 | 851 | 164.1 |
| C | 15 | 127 | 1217694 | 6362.69 | 824 | 828 | 191.3 |
| C | 14 | 238 | 130979 | 680.53 | 824 | 828 | 191.3 |
| C | 4 | 254 | 129754 | 674.12 | 824 | 828 | 191.3 |
| D | 1 | 52 | 4295848 | 23204.58 | 784 | 766 | 185.1 |
| D | 7 | 80 | 1750609 | 9453.69 | 784 | 766 | 185.1 |
| D | 13 | 104 | 352926 | 1902.58 | 784 | 766 | 185.1 |
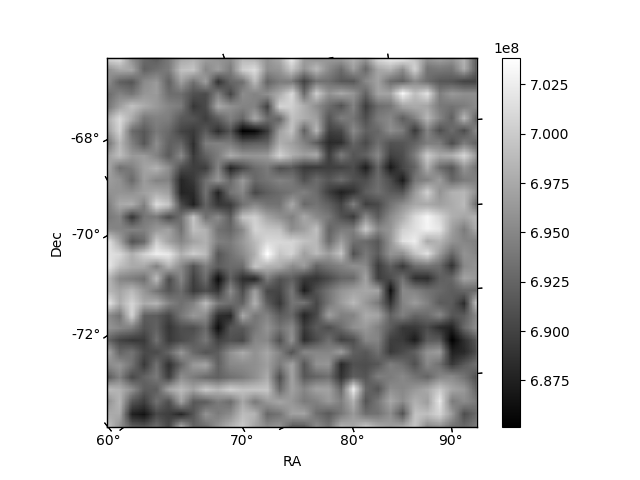
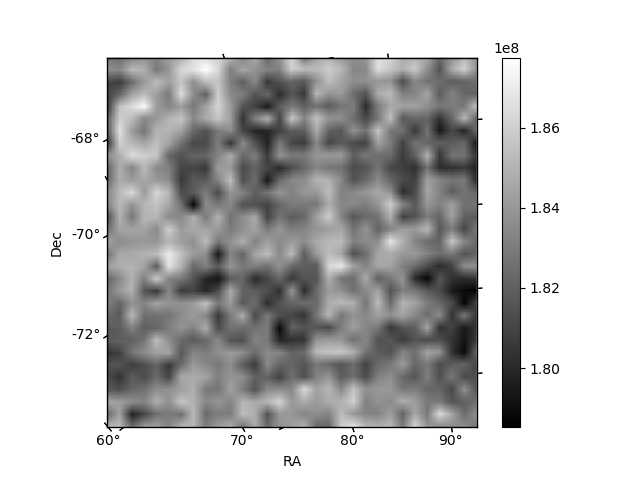
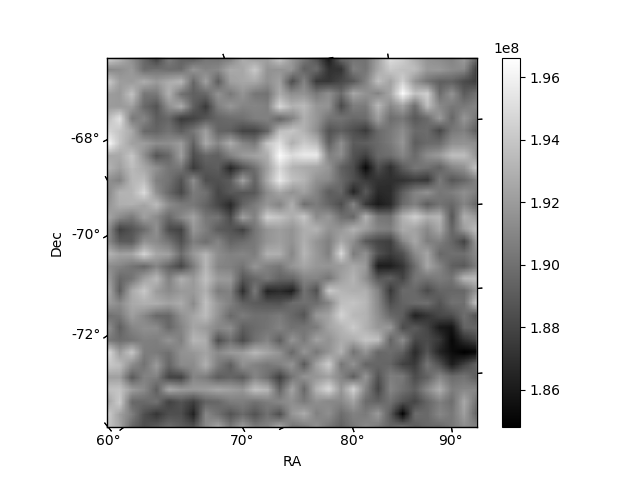
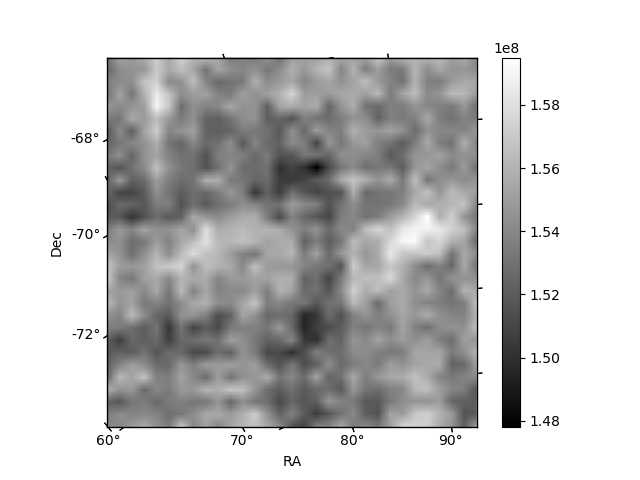
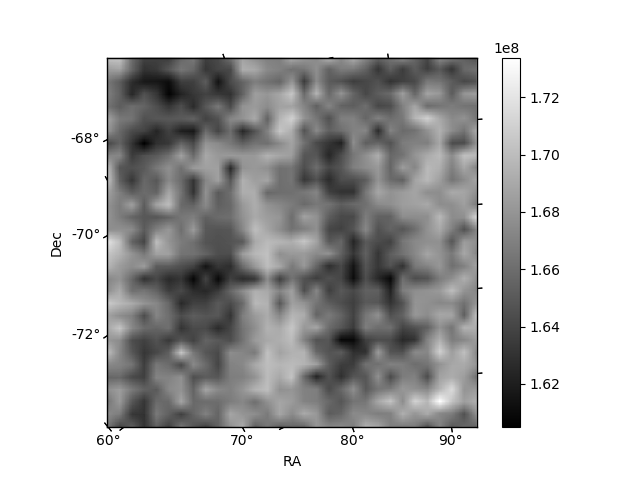
Histogram calculated using DETX and DETY for each event in the final _common_clean file
| Quadrant A | 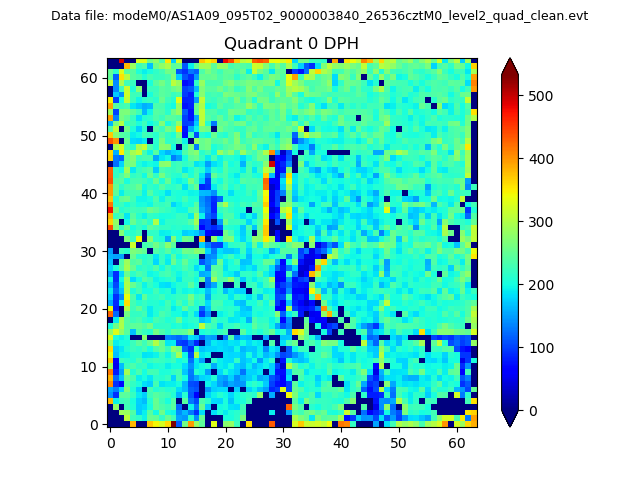 |
 |
Quadrant B |
|---|---|---|---|
| Quadrant D | 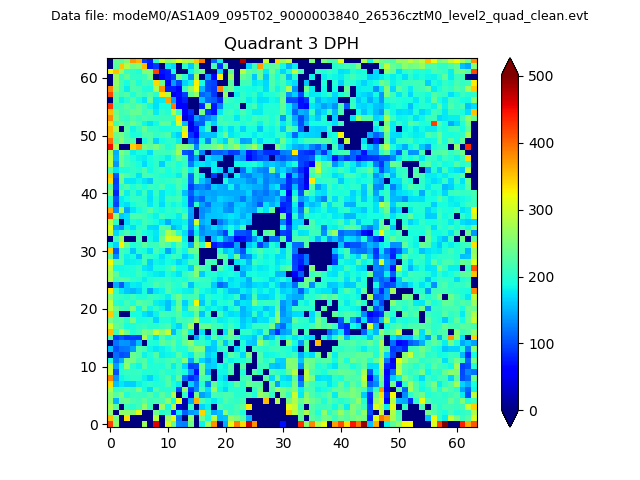 |
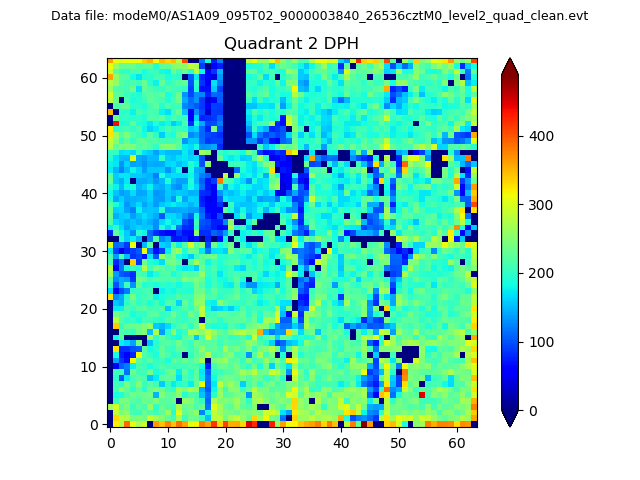 |
Quadrant C |
| Plot type | Count rate plots | Images |
|---|---|---|
| Comparison with Poisson distribution Blue bars denote a histogram of data divided into 1 sec bins. Red curve is a Poisson curve with rate = median count rate of data. |
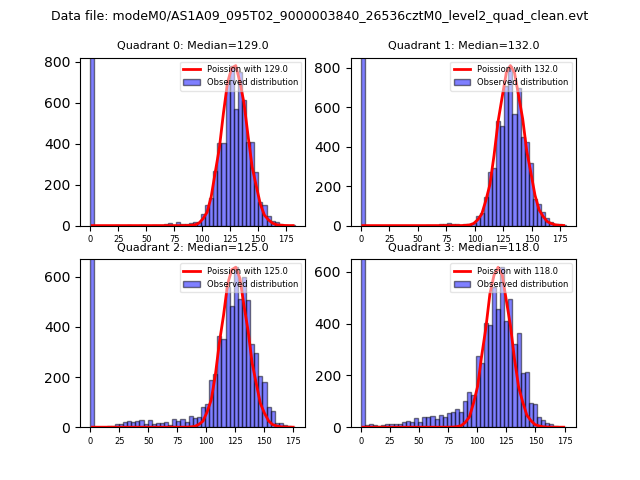 |
 |
| Quadrant-wise count rates Data is divided into 100 sec bins |
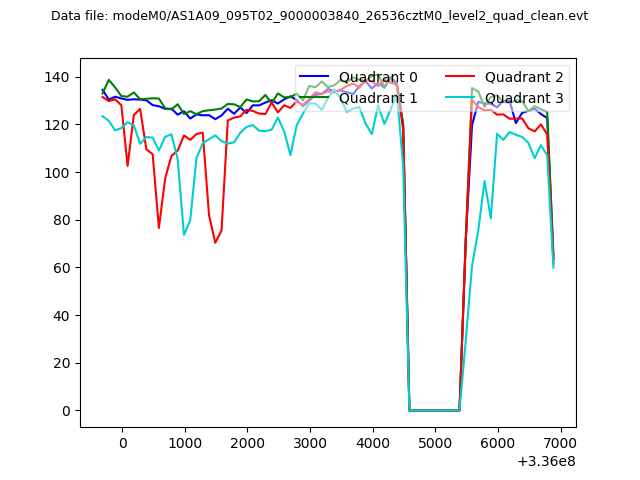 |
|
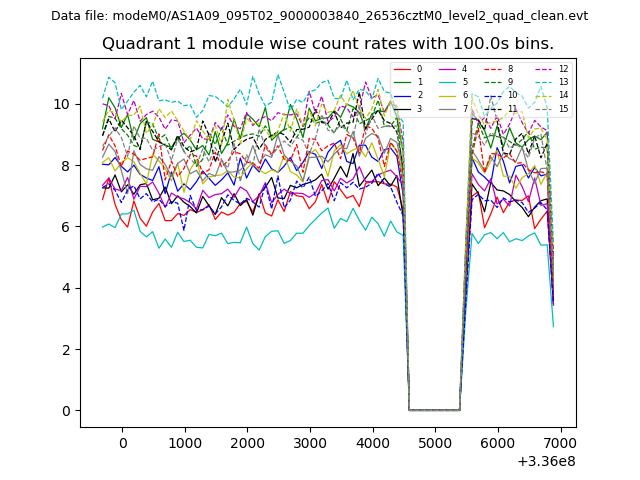
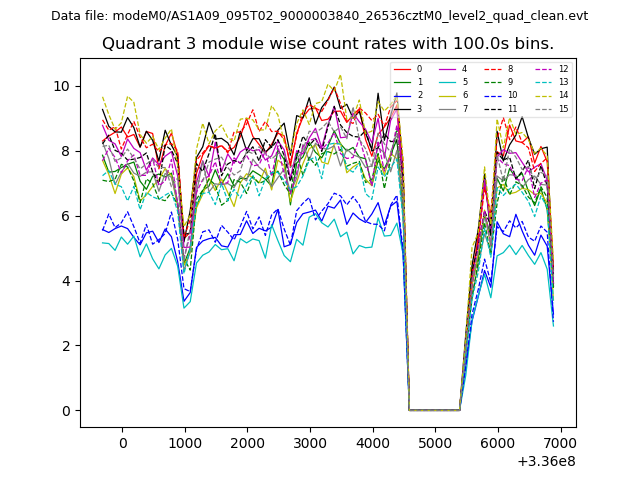
| Module-wise count rates for Quadrant A Data is divided into 100 sec bins |
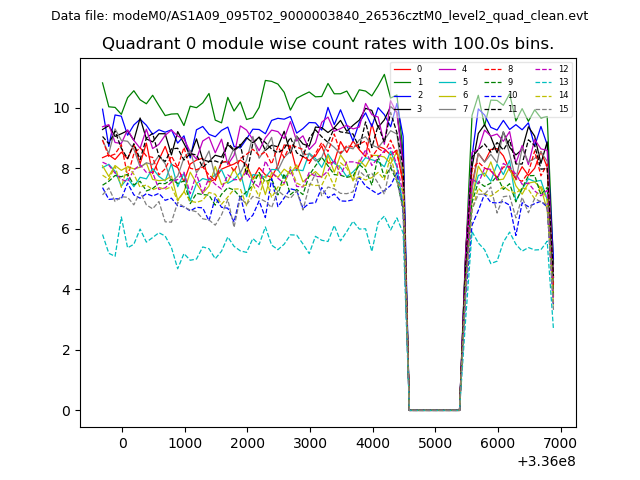 |
 |
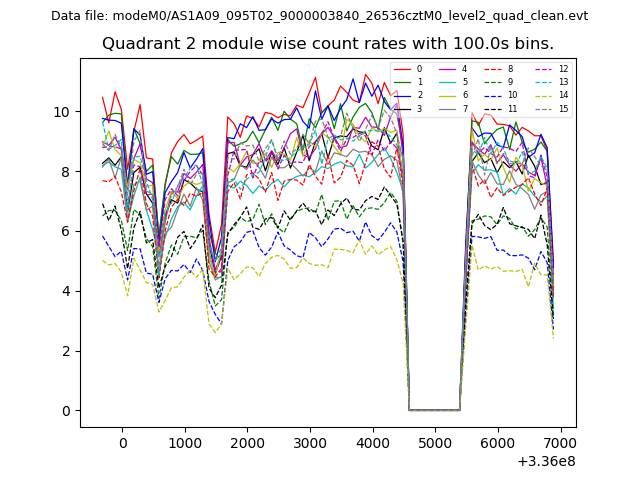
| Module-wise count rates for Quadrant B Data is divided into 100 sec bins |
 |
 |
| Module-wise count rates for Quadrant C Data is divided into 100 sec bins |
 |
 |
| Module-wise count rates for Quadrant D Data is divided into 100 sec bins |
 |
 |
| Parameter | Plot |
|---|---|
| CZT HV Monitor | 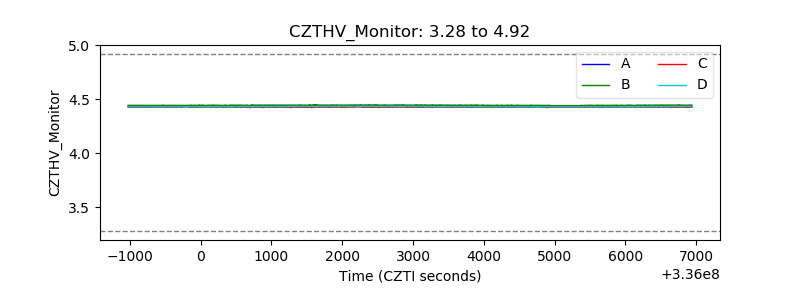 |
| D_VDD | 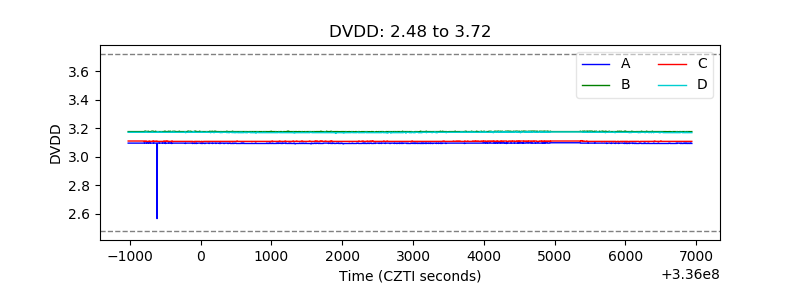 |
| Temperature 1 | 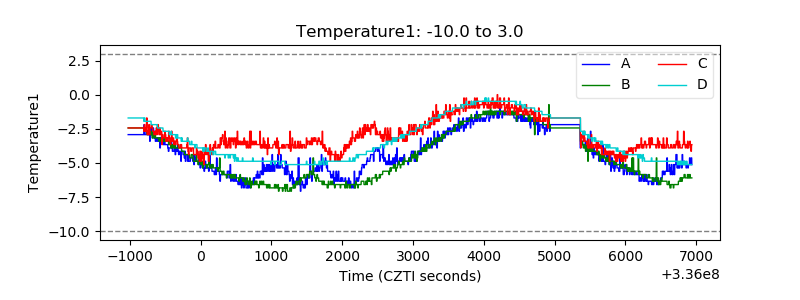 |
| Veto HV Monitor | 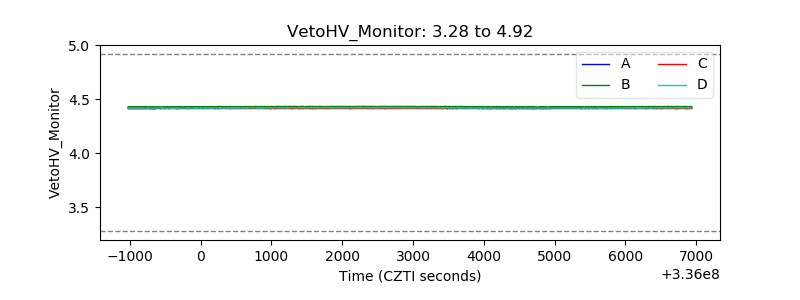 |
| Veto LLD | 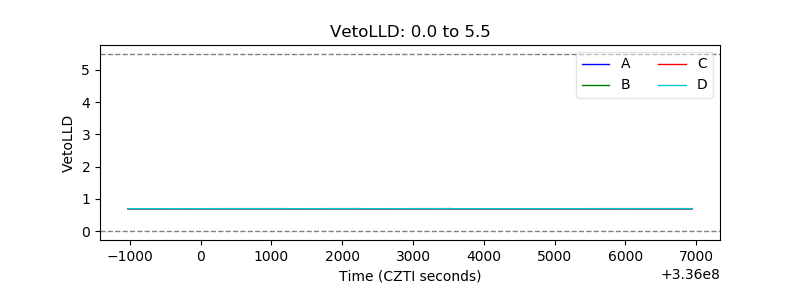 |
| Alpha Counter | 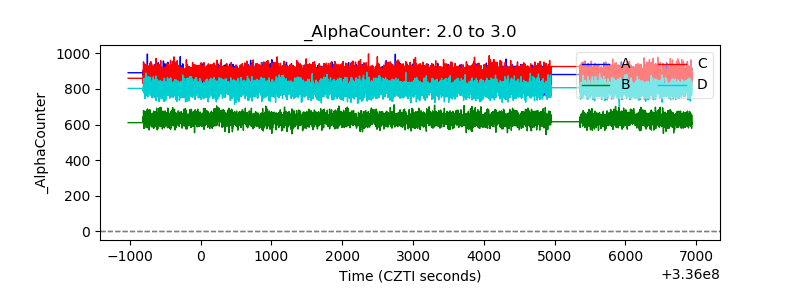 |
| _CPM_Rate | 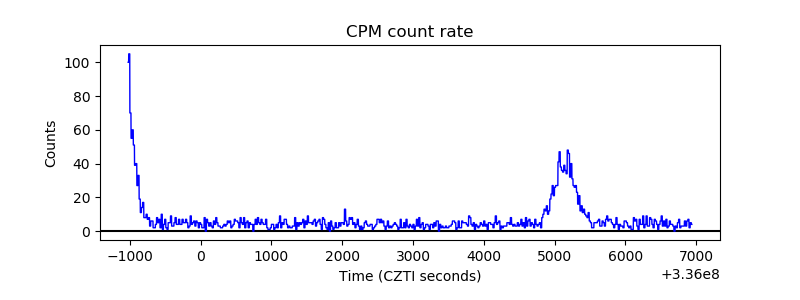 |
| CZT Counter | 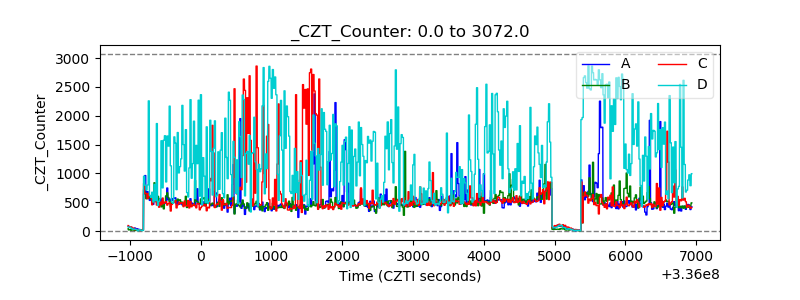 |
| +2.5 Volts monitor | 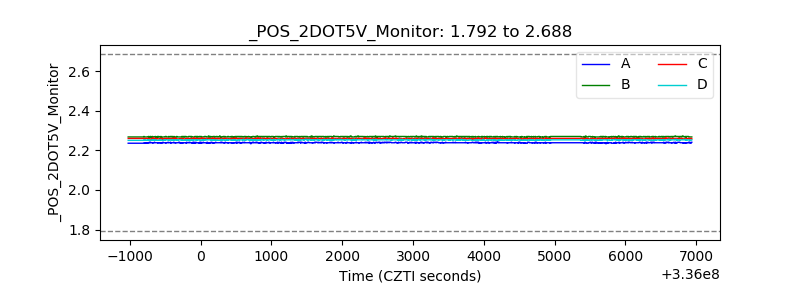 |
| +5 Volts monitor | 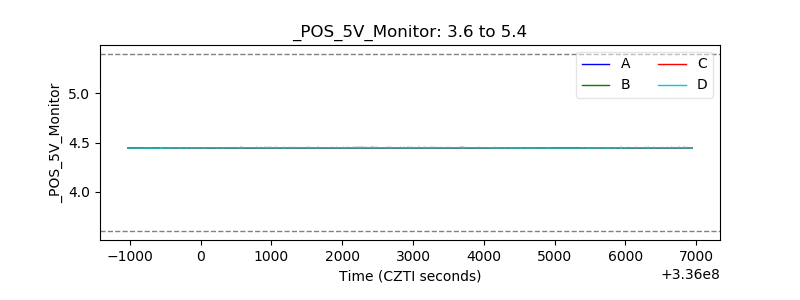 |
| _ROLL_ROT | 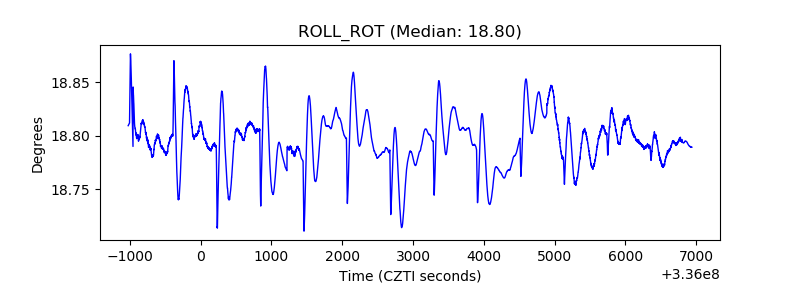 |
| _Roll_DEC | 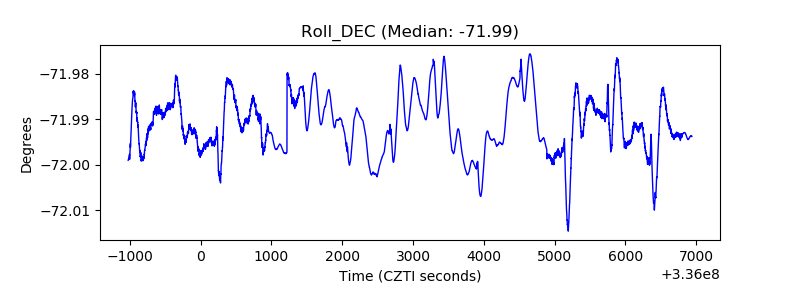 |
| _Roll_RA | 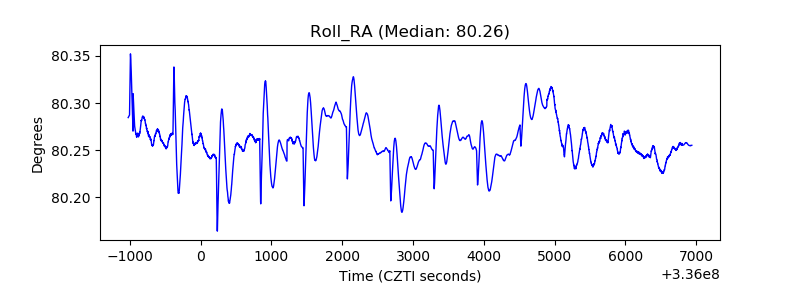 |
| Veto Counter | 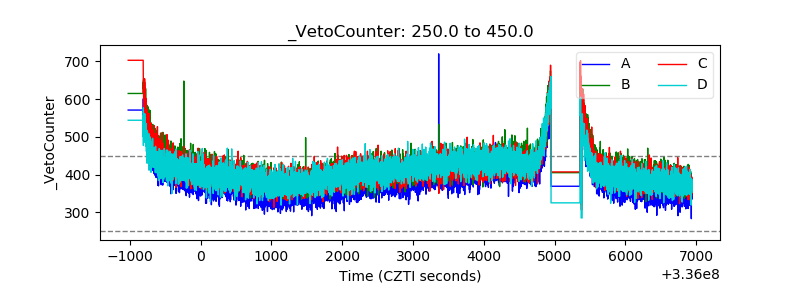 |