| Param | Original file | Final file |
|---|---|---|
| Filename | modeM0/AS1A09_095T02_9000003840_26537cztM0_level2.evt | modeM0/AS1A09_095T02_9000003840_26537cztM0_level2_quad_clean.evt |
| Size (bytes) | 721,281,600 | 124,364,160 |
| Size | 687.9 MB | 118.6 MB |
| Events in quadrant A | 4,122,663 | 829,412 |
| Events in quadrant B | 3,908,631 | 846,928 |
| Events in quadrant C | 5,128,237 | 796,115 |
| Events in quadrant D | 8,166,029 | 760,374 |
| Mode M9 | |||
|---|---|---|---|
| Quadrant | BADHDUFLAG | Total packets | Discarded packets |
| A | 0 | 3 | 0 |
| B | 0 | 4 | 0 |
| C | 0 | 4 | 0 |
| D | 0 | 4 | 0 |
| Mode M0 | |||
|---|---|---|---|
| Quadrant | BADHDUFLAG | Total packets | Discarded packets |
| A | 0 | 17292 | 0 |
| B | 0 | 16522 | 0 |
| C | 0 | 20172 | 0 |
| D | 0 | 29544 | 0 |
| Quadrant | Total seconds | Saturated seconds | Saturation percentage |
|---|---|---|---|
| A | 7672 | 168 | 2.189781% |
| B | 7672 | 96 | 1.251303% |
| C | 7672 | 488 | 6.360792% |
| D | 7672 | 1077 | 14.038060% |
Noise dominated data is calculated using 1-second bins in cleaned event files. If a bin has >2000 counts, and if more than 50% of those come from <1% of pixels, then it is considered to be noise-dominated and hence unusable.
| Quadrant | # 1 sec bins | Bins with >0 counts | Bins with >2000 counts | High rate bins dominated by noise | Noise dominated (total time) | Noise dominated (detector-on time) | Marked lightcurve |
|---|---|---|---|---|---|---|---|
| A | 7897 | 7674 | 76 | 76 | 0.96% | 0.99% | 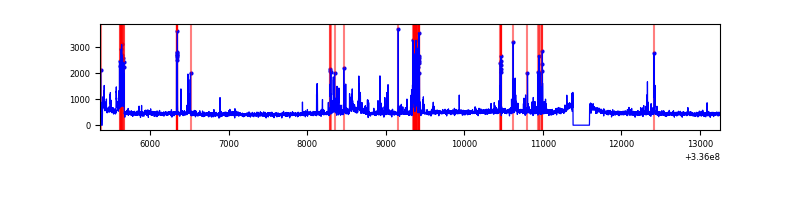 |
| B | 7897 | 7674 | 6 | 6 | 0.08% | 0.08% | 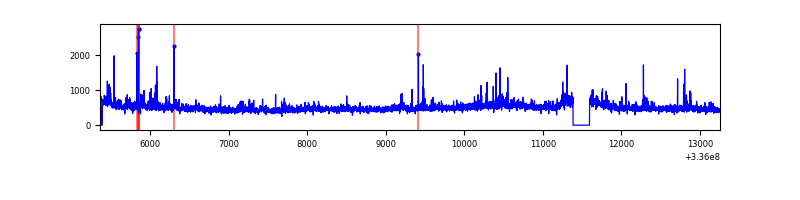 |
| C | 7897 | 7674 | 229 | 229 | 2.90% | 2.98% | 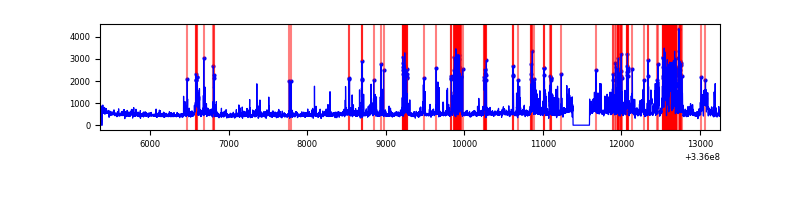 |
| D | 7897 | 7673 | 1005 | 1005 | 12.73% | 13.10% | 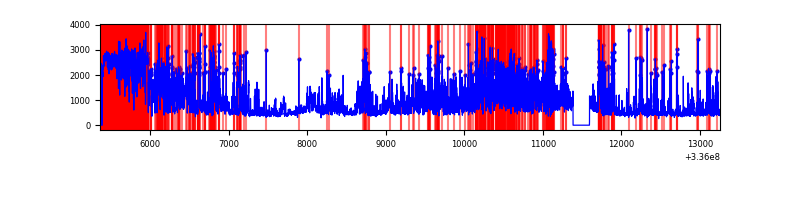 |
Top three noisy pixels from each quadrant. If the there are fewer than three noisy pixels in the level2.evt file, extra rows are filled as -1
| Pixel properties | Quadrant properties | ||||||
|---|---|---|---|---|---|---|---|
| Quadrant | DetID | PixID | Counts | Sigma | Mean | Median | Sigma |
| A | 0 | 13 | 549635 | 3024.36 | 908 | 888 | 181.4 |
| A | 5 | 168 | 72123 | 392.6 | 908 | 888 | 181.4 |
| A | 13 | 254 | 10885 | 55.1 | 908 | 888 | 181.4 |
| B | 3 | 112 | 223575 | 1299.24 | 910 | 885 | 171.4 |
| B | 3 | 64 | 71825 | 413.89 | 910 | 885 | 171.4 |
| B | 12 | 111 | 20847 | 116.46 | 910 | 885 | 171.4 |
| C | 4 | 254 | 1424552 | 7093.54 | 863 | 867 | 200.7 |
| C | 3 | 233 | 204794 | 1016.07 | 863 | 867 | 200.7 |
| C | 14 | 238 | 138387 | 685.2 | 863 | 867 | 200.7 |
| D | 1 | 52 | 3465871 | 17489.05 | 836 | 816 | 198.1 |
| D | 7 | 80 | 1233858 | 6223.49 | 836 | 816 | 198.1 |
| D | 13 | 104 | 215348 | 1082.8 | 836 | 816 | 198.1 |
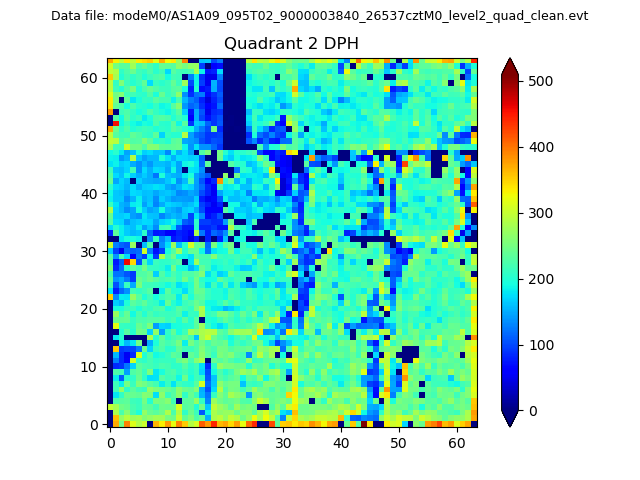
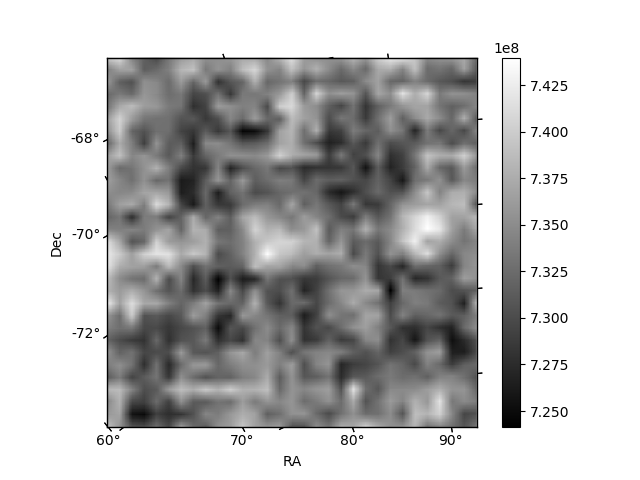
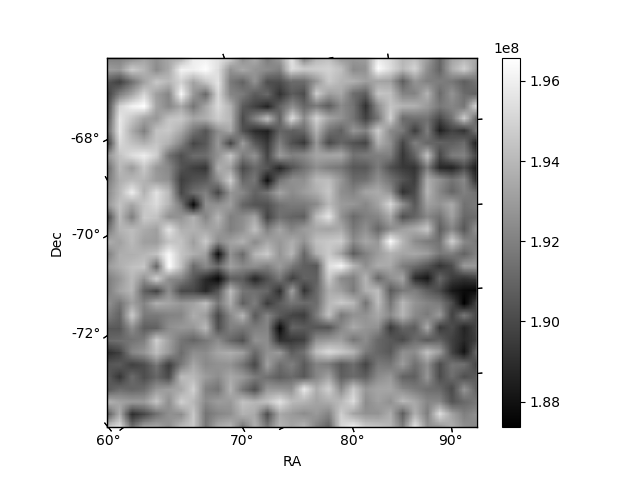
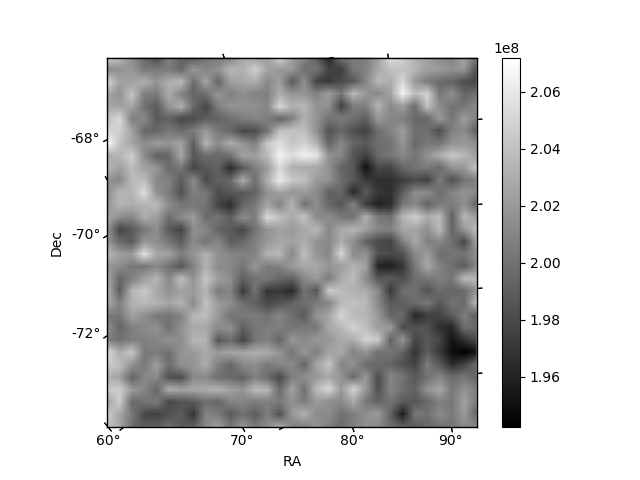
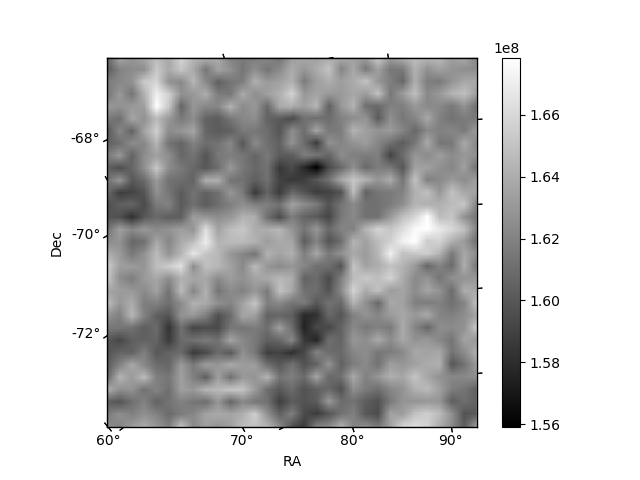
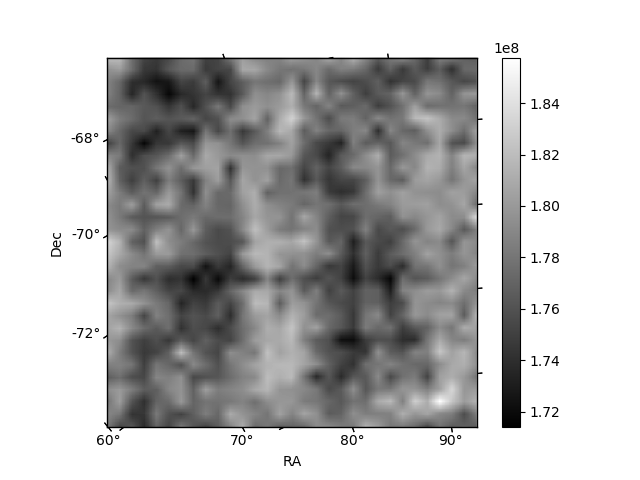
Histogram calculated using DETX and DETY for each event in the final _common_clean file
| Quadrant A | 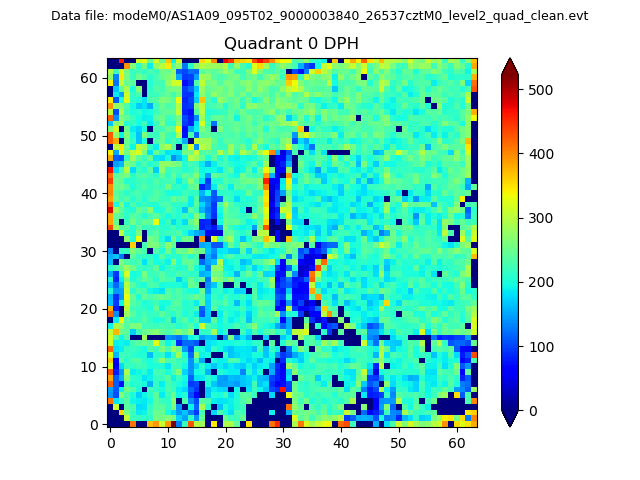 |
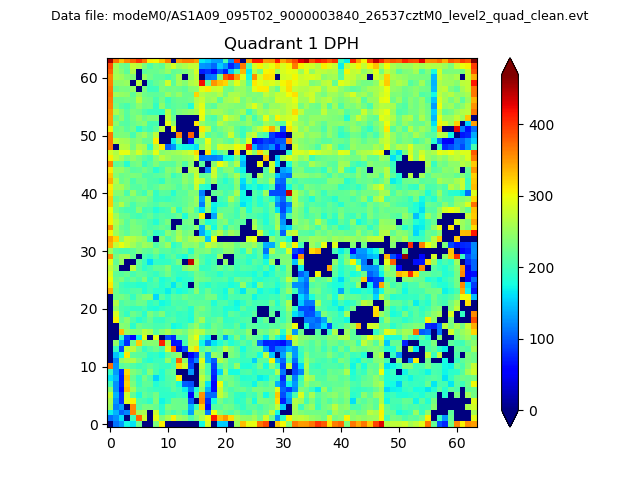 |
Quadrant B |
|---|---|---|---|
| Quadrant D | 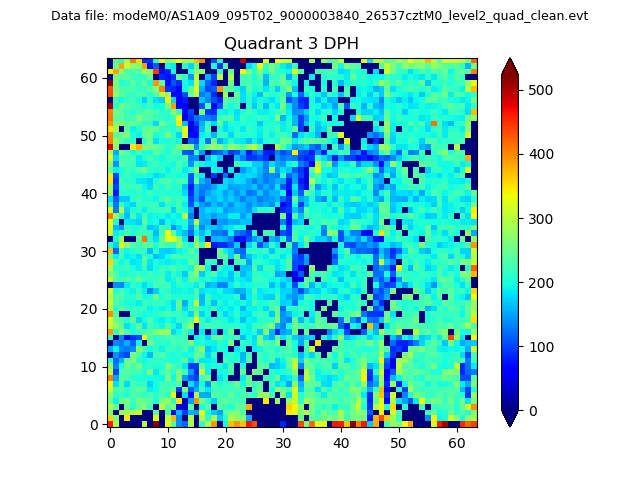 |
 |
Quadrant C |
| Plot type | Count rate plots | Images |
|---|---|---|
| Comparison with Poisson distribution Blue bars denote a histogram of data divided into 1 sec bins. Red curve is a Poisson curve with rate = median count rate of data. |
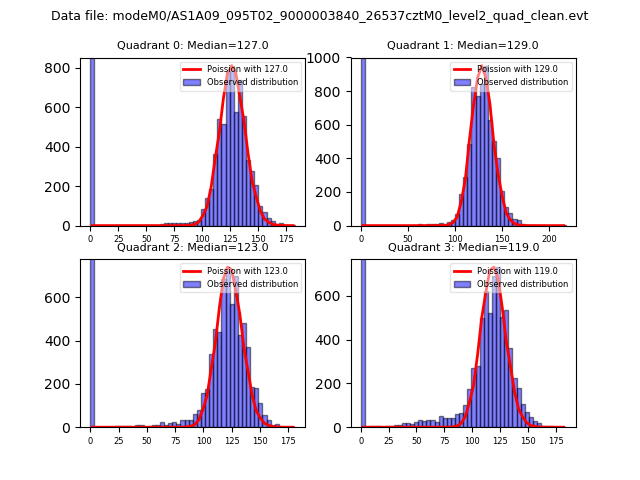 |
 |
| Quadrant-wise count rates Data is divided into 100 sec bins |
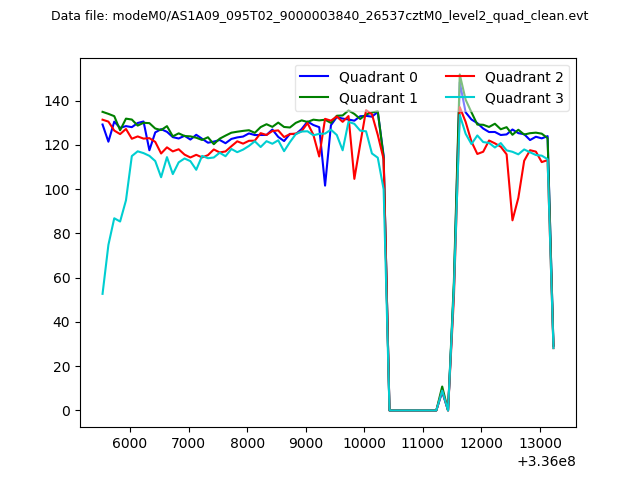 |
|
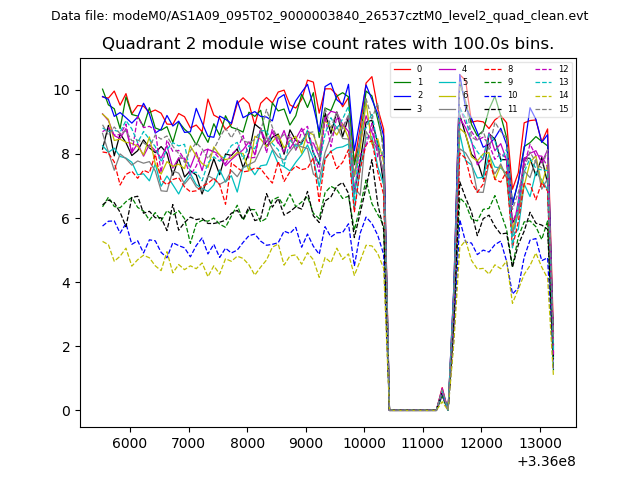
| Module-wise count rates for Quadrant A Data is divided into 100 sec bins |
 |
 |
| Module-wise count rates for Quadrant B Data is divided into 100 sec bins |
 |
 |
| Module-wise count rates for Quadrant C Data is divided into 100 sec bins |
 |
 |
| Module-wise count rates for Quadrant D Data is divided into 100 sec bins |
 |
 |
| Parameter | Plot |
|---|---|
| CZT HV Monitor |  |
| D_VDD | 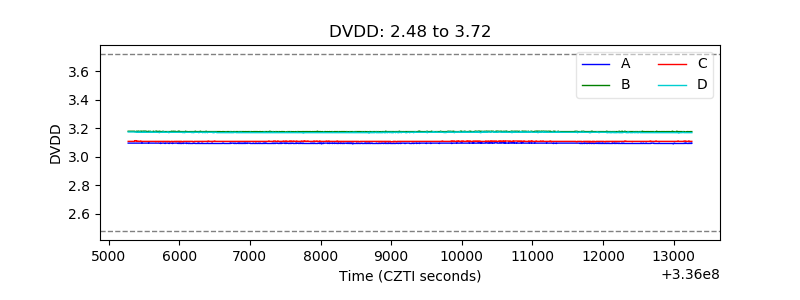 |
| Temperature 1 | 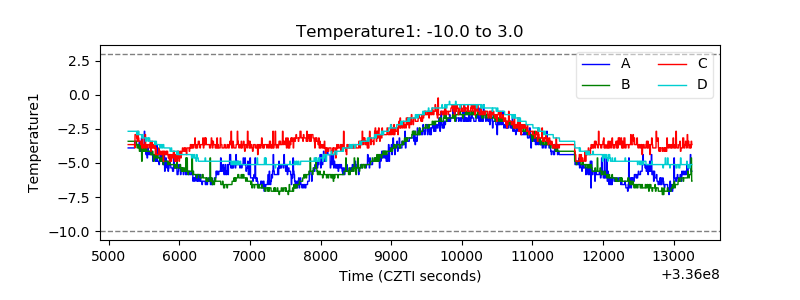 |
| Veto HV Monitor |  |
| Veto LLD | 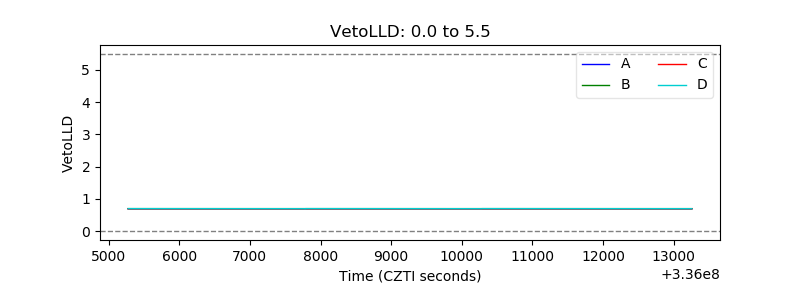 |
| Alpha Counter | 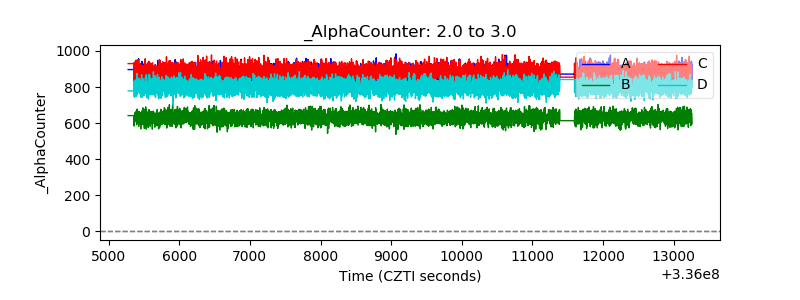 |
| _CPM_Rate | 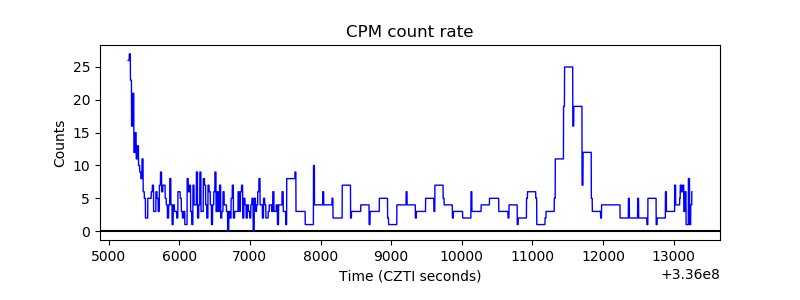 |
| CZT Counter | 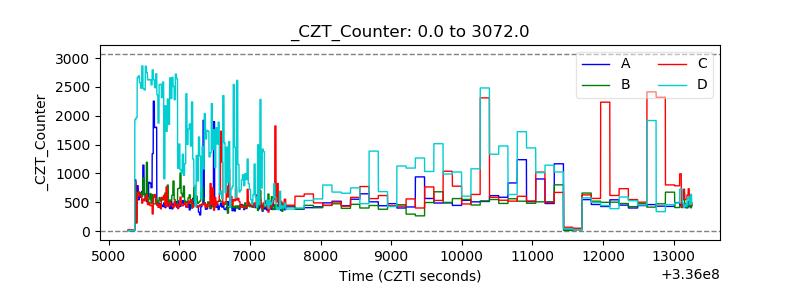 |
| +2.5 Volts monitor | 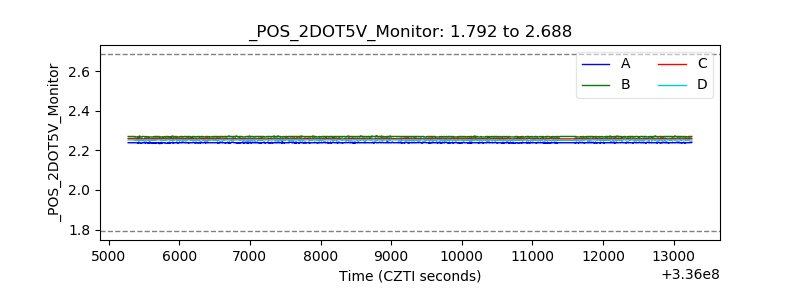 |
| +5 Volts monitor |  |
| _ROLL_ROT | 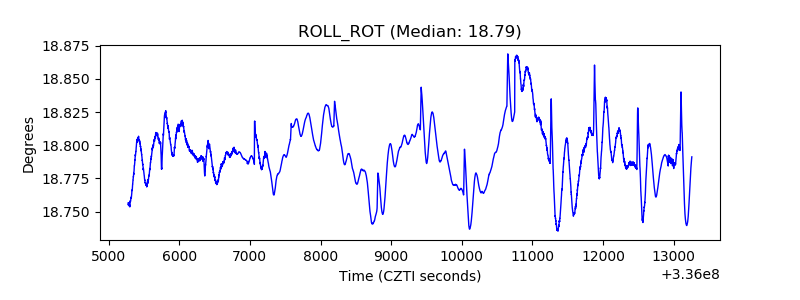 |
| _Roll_DEC | 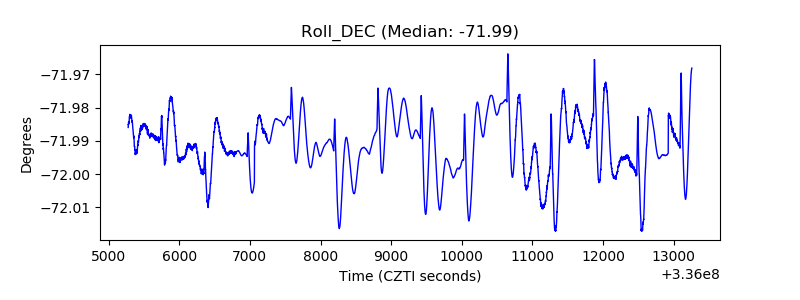 |
| _Roll_RA | 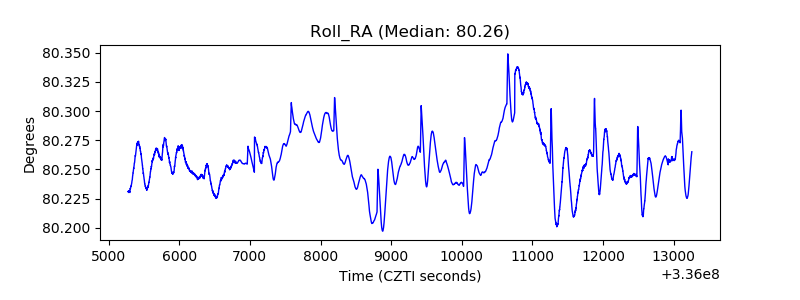 |
| Veto Counter |  |