| Param | Original file | Final file |
|---|---|---|
| Filename | modeM0/AS1A09_095T02_9000003840_26538cztM0_level2.evt | modeM0/AS1A09_095T02_9000003840_26538cztM0_level2_quad_clean.evt |
| Size (bytes) | 660,643,200 | 114,215,040 |
| Size | 630.0 MB | 108.9 MB |
| Events in quadrant A | 3,495,049 | 762,347 |
| Events in quadrant B | 3,528,538 | 776,229 |
| Events in quadrant C | 4,608,870 | 734,674 |
| Events in quadrant D | 7,900,753 | 697,114 |
| Mode M9 | |||
|---|---|---|---|
| Quadrant | BADHDUFLAG | Total packets | Discarded packets |
| A | 0 | 4 | 0 |
| B | 0 | 5 | 0 |
| C | 0 | 5 | 0 |
| D | 0 | 5 | 0 |
| Mode M0 | |||
|---|---|---|---|
| Quadrant | BADHDUFLAG | Total packets | Discarded packets |
| A | 0 | 15052 | 0 |
| B | 0 | 14958 | 0 |
| C | 0 | 18140 | 0 |
| D | 0 | 28287 | 0 |
| Quadrant | Total seconds | Saturated seconds | Saturation percentage |
|---|---|---|---|
| A | 7012 | 49 | 0.698802% |
| B | 7012 | 98 | 1.397604% |
| C | 7012 | 385 | 5.490588% |
| D | 7012 | 1211 | 17.270394% |
Noise dominated data is calculated using 1-second bins in cleaned event files. If a bin has >2000 counts, and if more than 50% of those come from <1% of pixels, then it is considered to be noise-dominated and hence unusable.
| Quadrant | # 1 sec bins | Bins with >0 counts | Bins with >2000 counts | High rate bins dominated by noise | Noise dominated (total time) | Noise dominated (detector-on time) | Marked lightcurve |
|---|---|---|---|---|---|---|---|
| A | 7357 | 7013 | 3 | 3 | 0.04% | 0.04% | 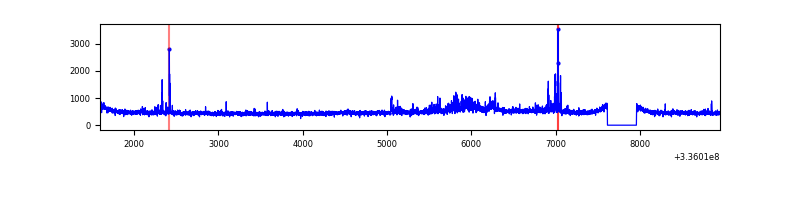 |
| B | 7357 | 7013 | 11 | 11 | 0.15% | 0.16% | 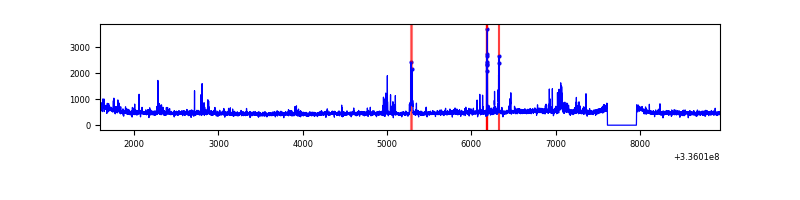 |
| C | 7357 | 7013 | 172 | 172 | 2.34% | 2.45% | 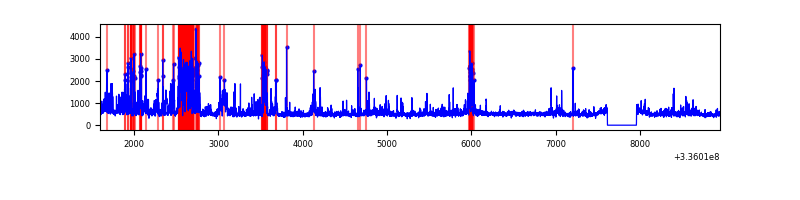 |
| D | 7357 | 7013 | 1096 | 1096 | 14.90% | 15.63% | 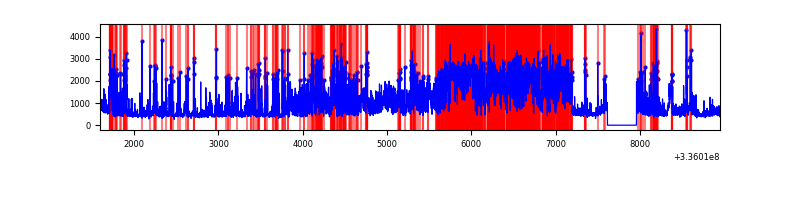 |
Top three noisy pixels from each quadrant. If the there are fewer than three noisy pixels in the level2.evt file, extra rows are filled as -1
| Pixel properties | Quadrant properties | ||||||
|---|---|---|---|---|---|---|---|
| Quadrant | DetID | PixID | Counts | Sigma | Mean | Median | Sigma |
| A | 0 | 13 | 220435 | 1303.31 | 832 | 814 | 168.5 |
| A | 5 | 168 | 64752 | 379.43 | 832 | 814 | 168.5 |
| A | 13 | 254 | 10276 | 56.15 | 832 | 814 | 168.5 |
| B | 3 | 112 | 130814 | 829.77 | 832 | 811 | 156.7 |
| B | 5 | 172 | 72210 | 455.72 | 832 | 811 | 156.7 |
| B | 3 | 64 | 25598 | 158.21 | 832 | 811 | 156.7 |
| C | 4 | 254 | 1179050 | 6354.39 | 794 | 801 | 185.4 |
| C | 3 | 233 | 208707 | 1121.25 | 794 | 801 | 185.4 |
| C | 14 | 238 | 128846 | 690.56 | 794 | 801 | 185.4 |
| D | 1 | 52 | 4505454 | 24925.75 | 764 | 746 | 180.7 |
| D | 13 | 104 | 223989 | 1235.26 | 764 | 746 | 180.7 |
| D | 7 | 80 | 205577 | 1133.38 | 764 | 746 | 180.7 |
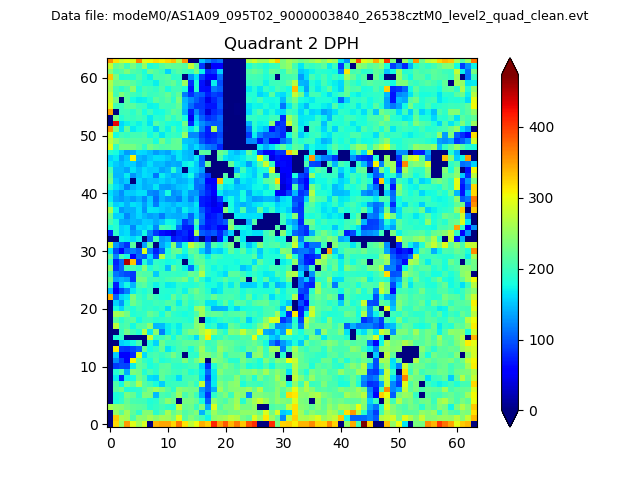
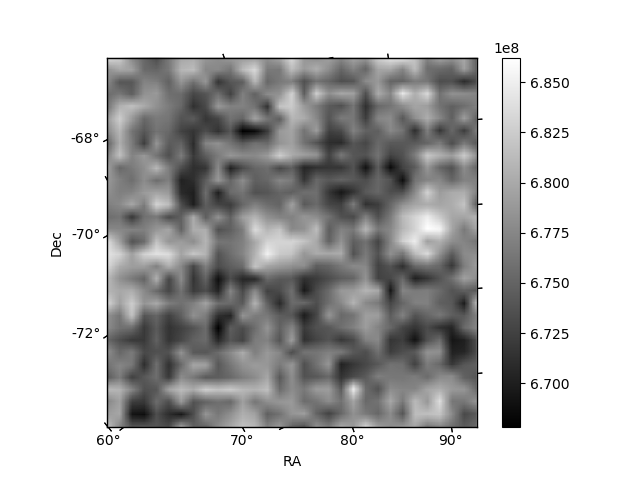
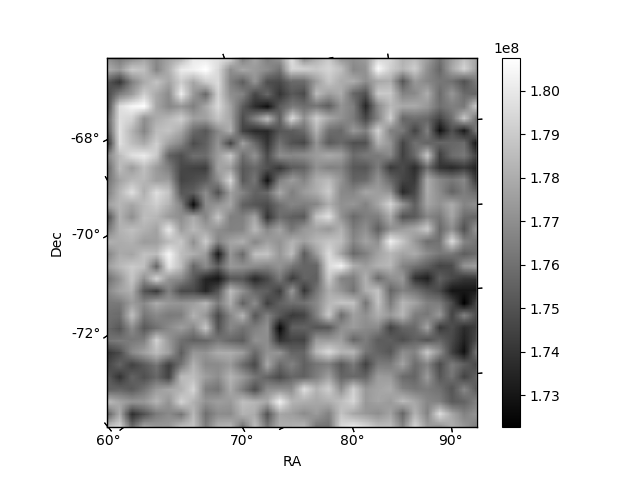
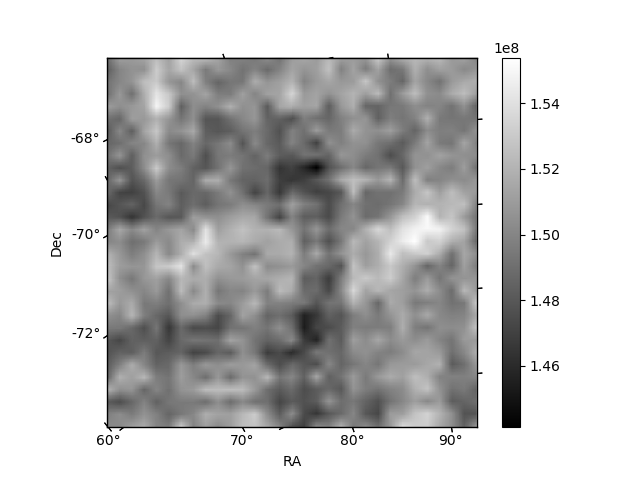
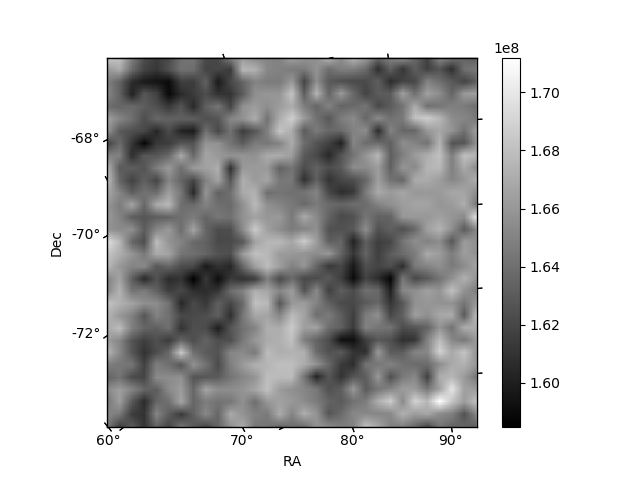
Histogram calculated using DETX and DETY for each event in the final _common_clean file
| Quadrant A | 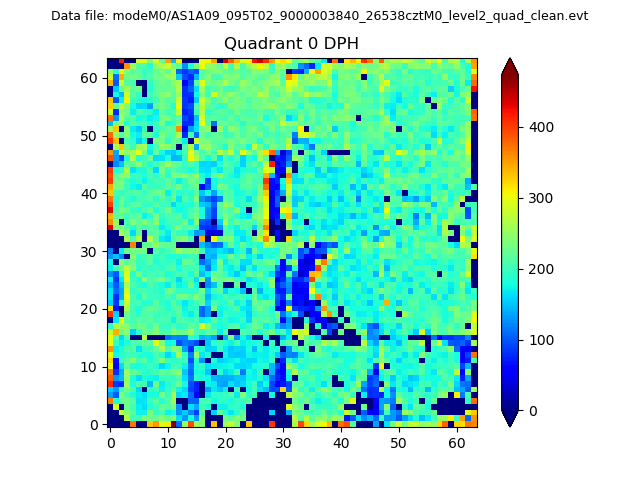 |
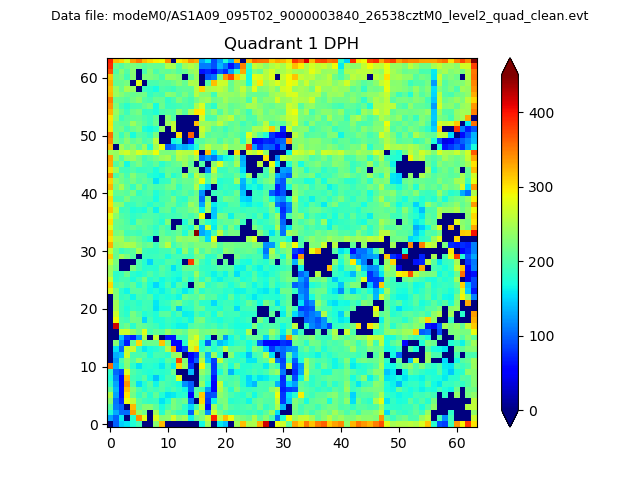 |
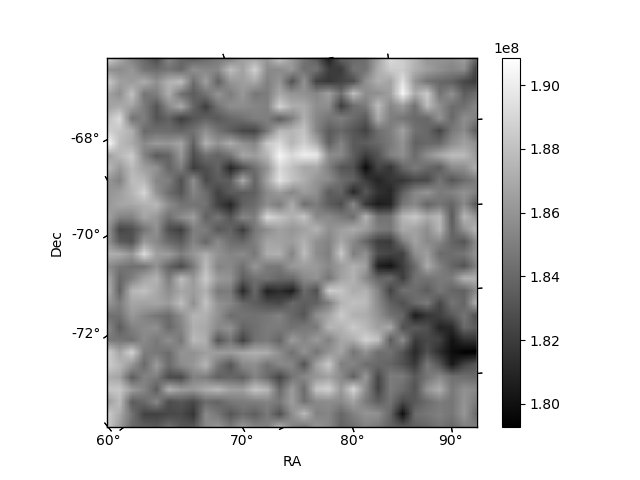
Quadrant B |
|---|---|---|---|
| Quadrant D | 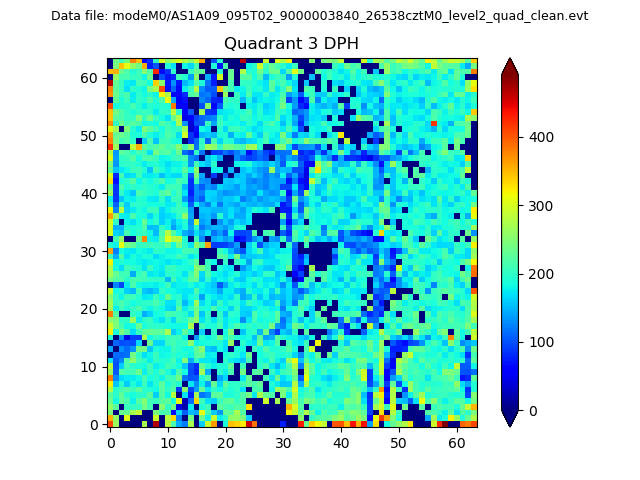 |
 |
Quadrant C |
| Plot type | Count rate plots | Images |
|---|---|---|
| Comparison with Poisson distribution Blue bars denote a histogram of data divided into 1 sec bins. Red curve is a Poisson curve with rate = median count rate of data. |
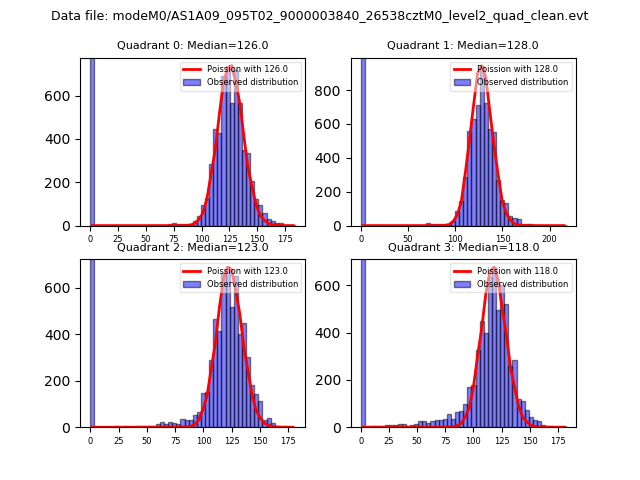 |
 |
| Quadrant-wise count rates Data is divided into 100 sec bins |
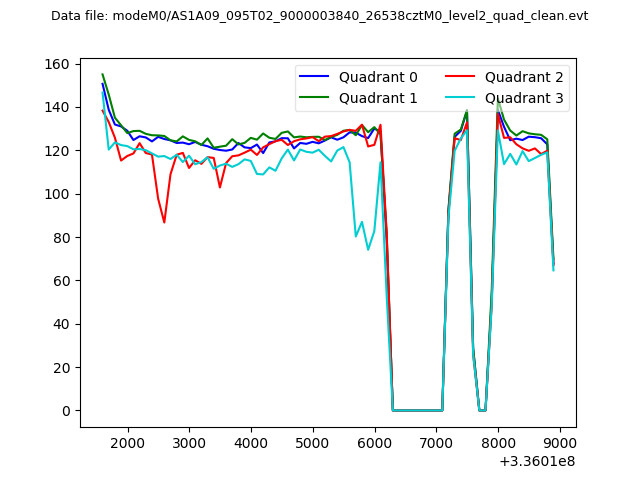 |
|
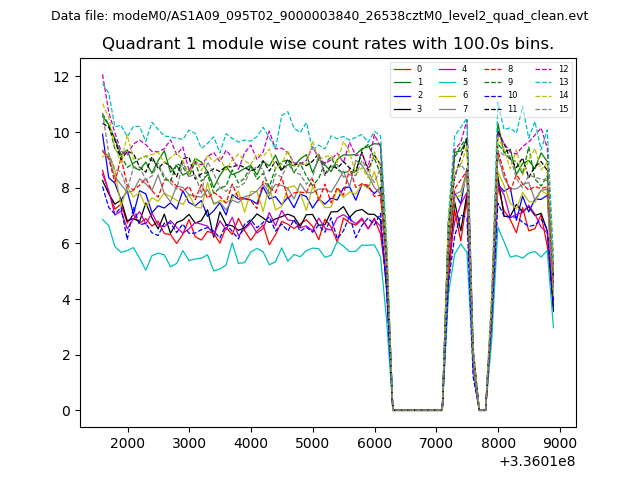
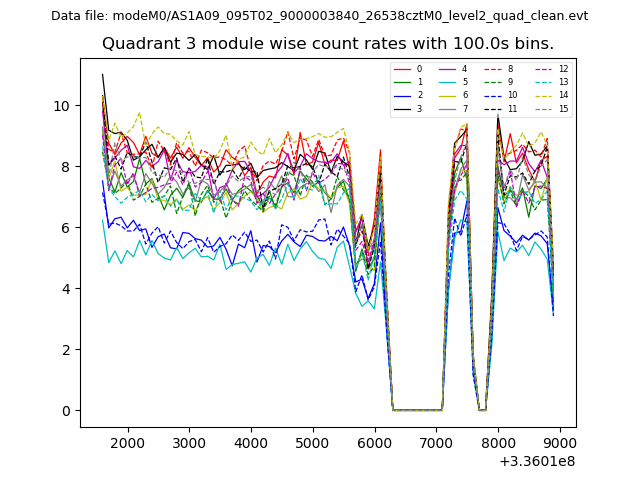
| Module-wise count rates for Quadrant A Data is divided into 100 sec bins |
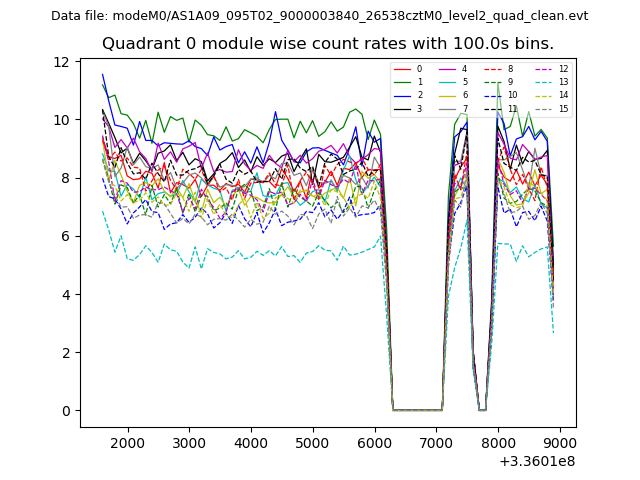 |
 |
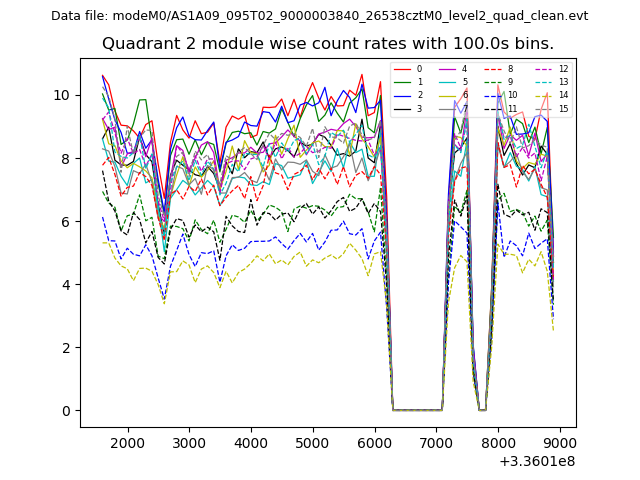
| Module-wise count rates for Quadrant B Data is divided into 100 sec bins |
 |
 |
| Module-wise count rates for Quadrant C Data is divided into 100 sec bins |
 |
 |
| Module-wise count rates for Quadrant D Data is divided into 100 sec bins |
 |
 |
| Parameter | Plot |
|---|---|
| CZT HV Monitor | 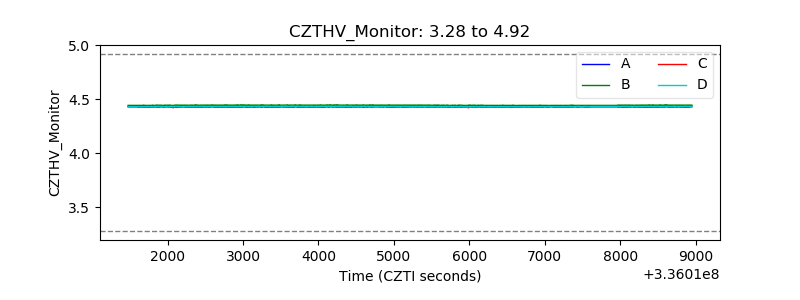 |
| D_VDD | 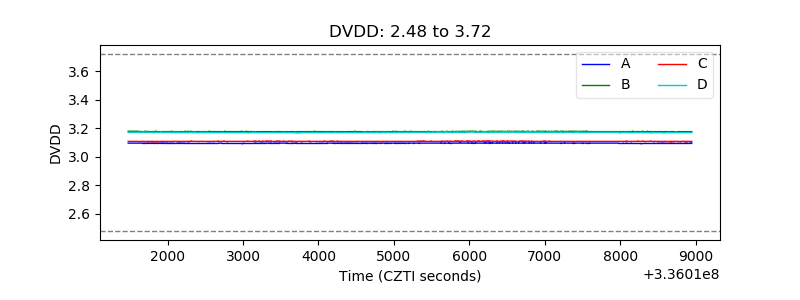 |
| Temperature 1 | 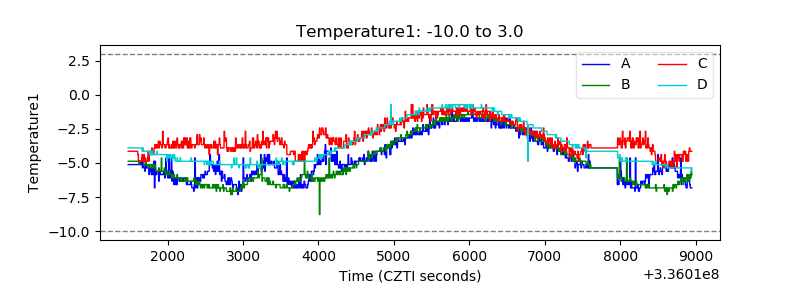 |
| Veto HV Monitor | 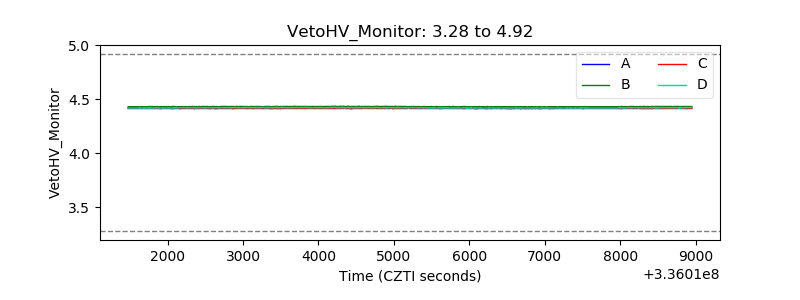 |
| Veto LLD | 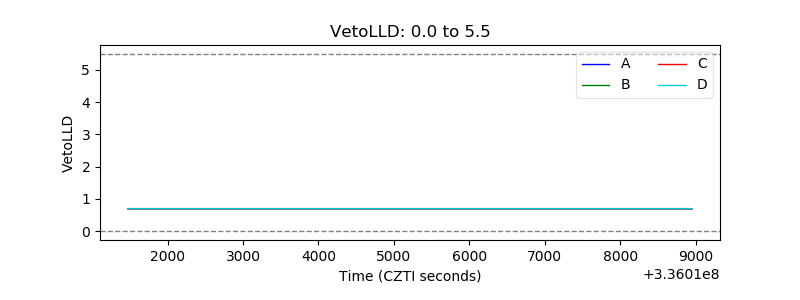 |
| Alpha Counter | 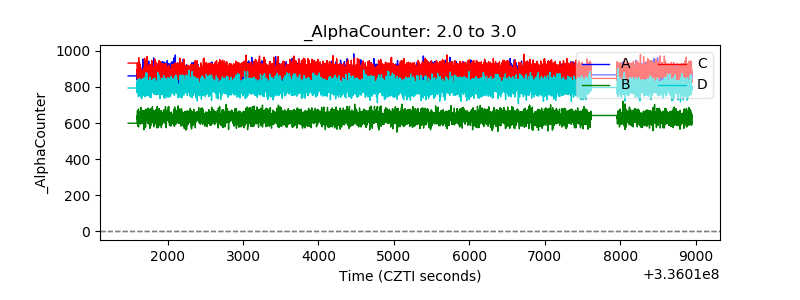 |
| _CPM_Rate | 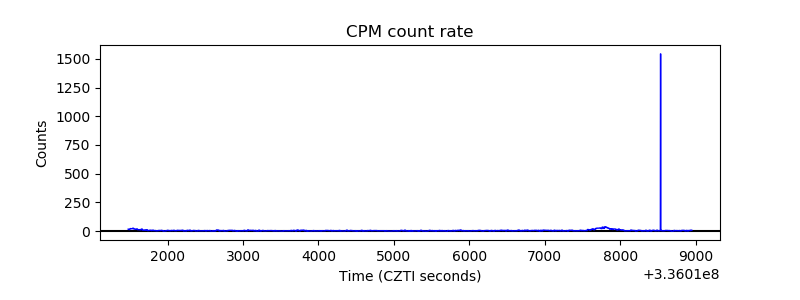 |
| CZT Counter |  |
| +2.5 Volts monitor |  |
| +5 Volts monitor |  |
| _ROLL_ROT | 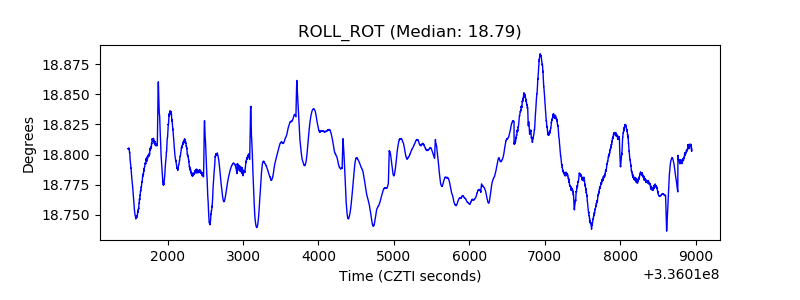 |
| _Roll_DEC |  |
| _Roll_RA | 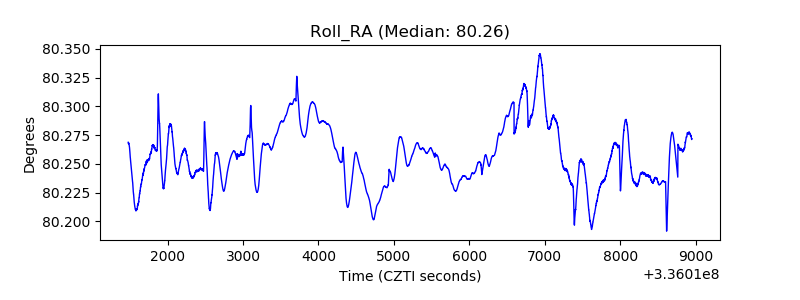 |
| Veto Counter | 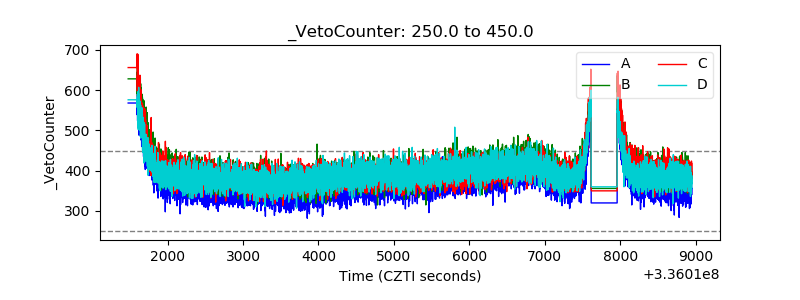 |