| Param | Original file | Final file |
|---|---|---|
| Filename | modeM0/AS1A09_095T02_9000003840_26542cztM0_level2.evt | modeM0/AS1A09_095T02_9000003840_26542cztM0_level2_quad_clean.evt |
| Size (bytes) | 1,753,122,240 | 334,134,720 |
| Size | 1.6 GB | 318.7 MB |
| Events in quadrant A | 10,238,492 | 2,202,302 |
| Events in quadrant B | 12,150,902 | 2,220,974 |
| Events in quadrant C | 13,278,829 | 2,149,209 |
| Events in quadrant D | 15,987,308 | 2,079,636 |
| Mode M9 | |||
|---|---|---|---|
| Quadrant | BADHDUFLAG | Total packets | Discarded packets |
| A | 0 | 24 | 0 |
| B | 0 | 24 | 0 |
| C | 0 | 24 | 0 |
| D | 0 | 24 | 0 |
| Mode M0 | |||
|---|---|---|---|
| Quadrant | BADHDUFLAG | Total packets | Discarded packets |
| A | 0 | 43908 | 0 |
| B | 0 | 49758 | 0 |
| C | 0 | 53189 | 0 |
| D | 0 | 61608 | 0 |
| Quadrant | Total seconds | Saturated seconds | Saturation percentage |
|---|---|---|---|
| A | 21324 | 182 | 0.853498% |
| B | 21324 | 674 | 3.160758% |
| C | 21325 | 975 | 4.572098% |
| D | 21324 | 1317 | 6.176140% |
Noise dominated data is calculated using 1-second bins in cleaned event files. If a bin has >2000 counts, and if more than 50% of those come from <1% of pixels, then it is considered to be noise-dominated and hence unusable.
| Quadrant | # 1 sec bins | Bins with >0 counts | Bins with >2000 counts | High rate bins dominated by noise | Noise dominated (total time) | Noise dominated (detector-on time) | Marked lightcurve |
|---|---|---|---|---|---|---|---|
| A | 23694 | 21327 | 42 | 42 | 0.18% | 0.20% | 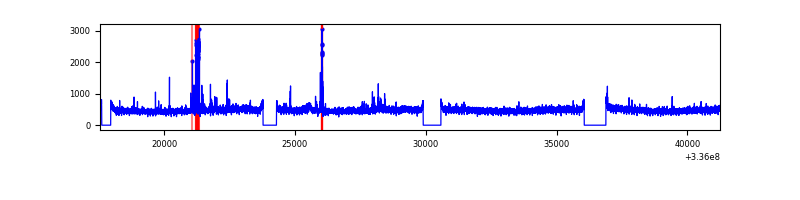 |
| B | 23694 | 21325 | 395 | 395 | 1.67% | 1.85% | 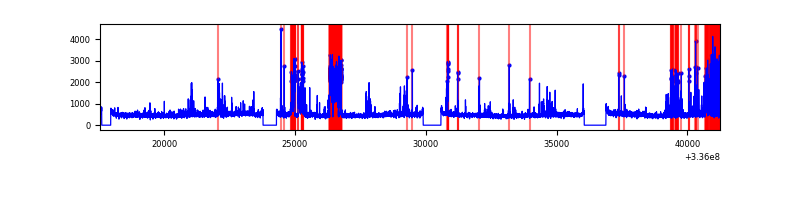 |
| C | 23695 | 21326 | 384 | 384 | 1.62% | 1.80% | 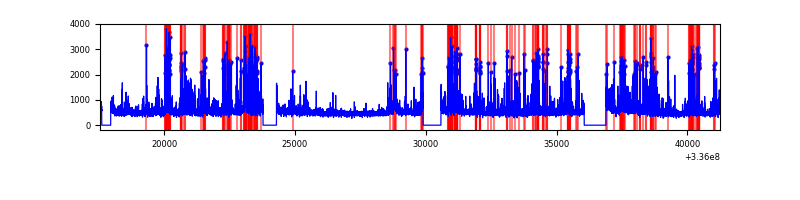 |
| D | 23694 | 21325 | 996 | 996 | 4.20% | 4.67% | 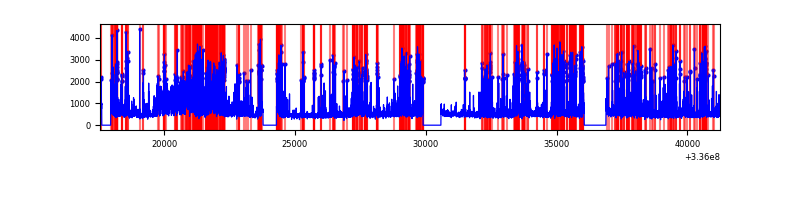 |
Top three noisy pixels from each quadrant. If the there are fewer than three noisy pixels in the level2.evt file, extra rows are filled as -1
| Pixel properties | Quadrant properties | ||||||
|---|---|---|---|---|---|---|---|
| Quadrant | DetID | PixID | Counts | Sigma | Mean | Median | Sigma |
| A | 0 | 13 | 286474 | 569.16 | 2515 | 2456 | 499.0 |
| A | 5 | 168 | 207542 | 410.98 | 2515 | 2456 | 499.0 |
| A | 9 | 130 | 44890 | 85.04 | 2515 | 2456 | 499.0 |
| B | 3 | 64 | 2040493 | 4341.69 | 2486 | 2421 | 469.4 |
| B | 3 | 112 | 232925 | 491.04 | 2486 | 2421 | 469.4 |
| B | 12 | 111 | 57524 | 117.39 | 2486 | 2421 | 469.4 |
| C | 4 | 254 | 2568899 | 4596.02 | 2408 | 2421 | 558.4 |
| C | 3 | 233 | 929731 | 1660.62 | 2408 | 2421 | 558.4 |
| C | 14 | 238 | 385803 | 686.56 | 2408 | 2421 | 558.4 |
| D | 1 | 52 | 3525328 | 6186.84 | 2406 | 2353 | 569.4 |
| D | 2 | 250 | 1313968 | 2303.38 | 2406 | 2353 | 569.4 |
| D | 12 | 1 | 894614 | 1566.94 | 2406 | 2353 | 569.4 |
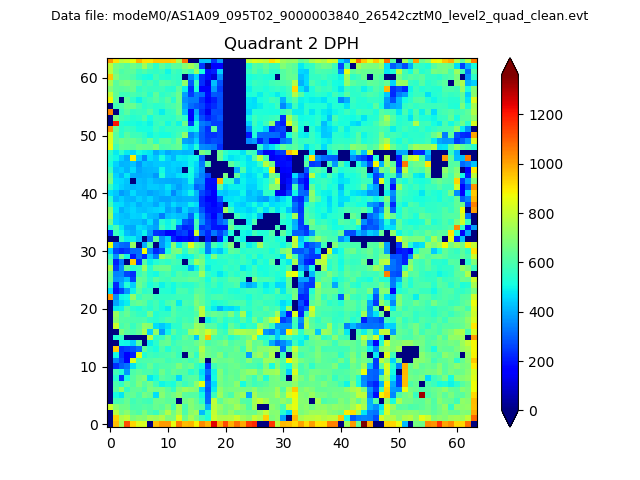
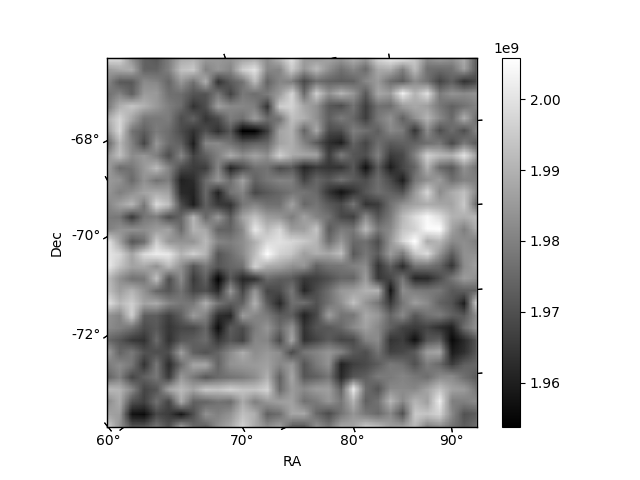
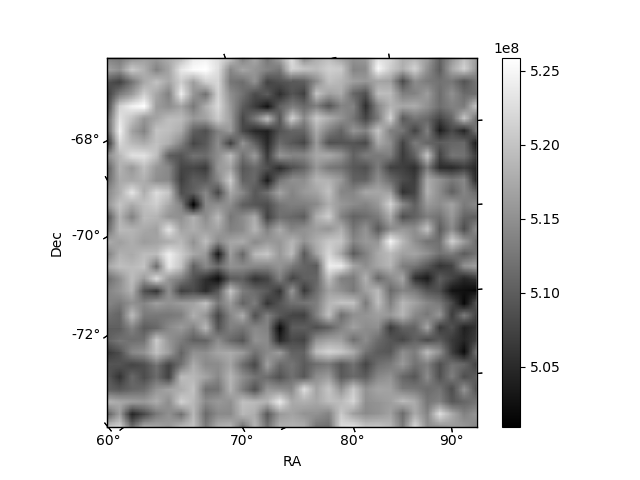
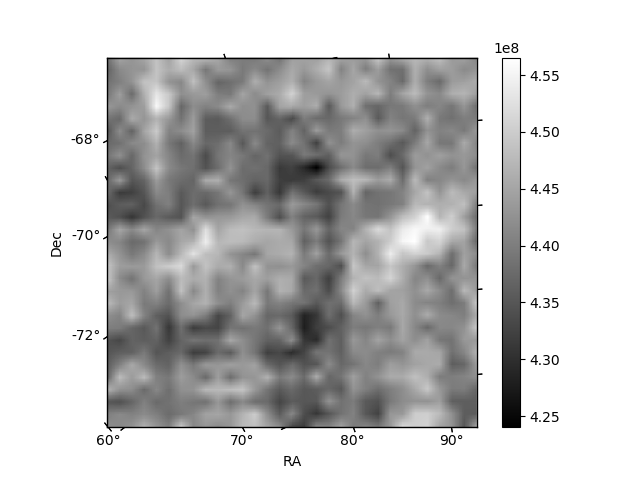
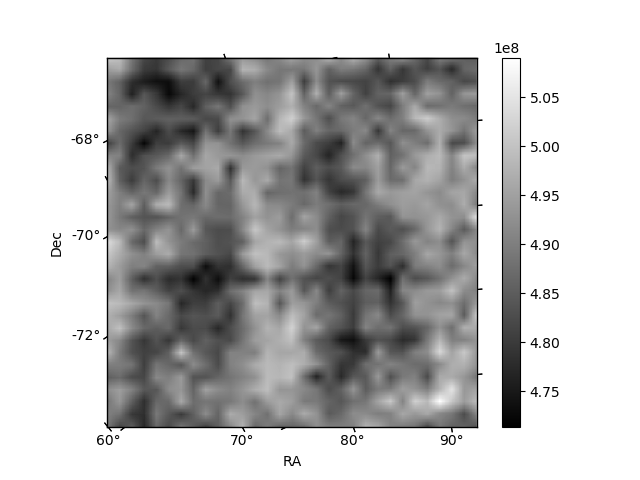
Histogram calculated using DETX and DETY for each event in the final _common_clean file
| Quadrant A | 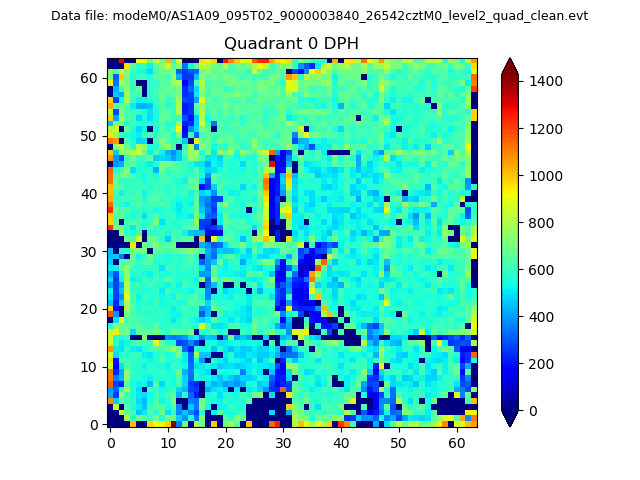 |
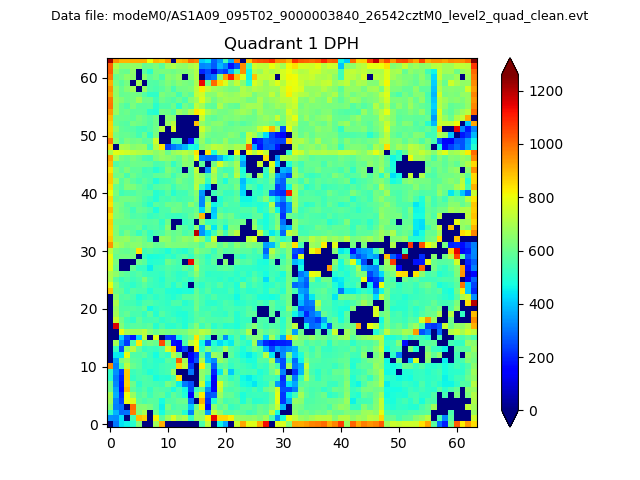 |
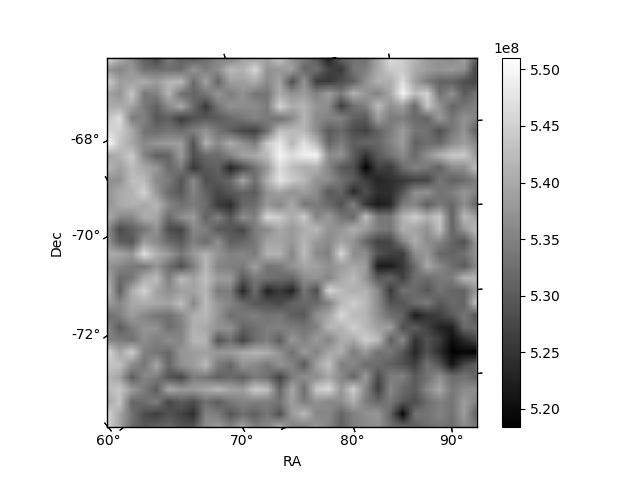
Quadrant B |
|---|---|---|---|
| Quadrant D | 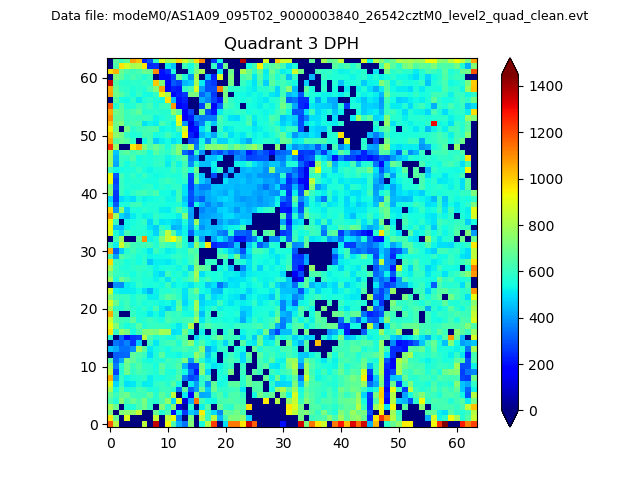 |
 |
Quadrant C |
| Plot type | Count rate plots | Images |
|---|---|---|
| Comparison with Poisson distribution Blue bars denote a histogram of data divided into 1 sec bins. Red curve is a Poisson curve with rate = median count rate of data. |
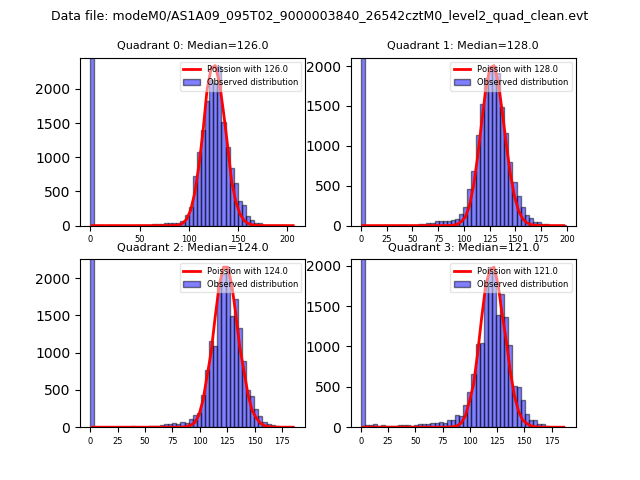 |
 |
| Quadrant-wise count rates Data is divided into 100 sec bins |
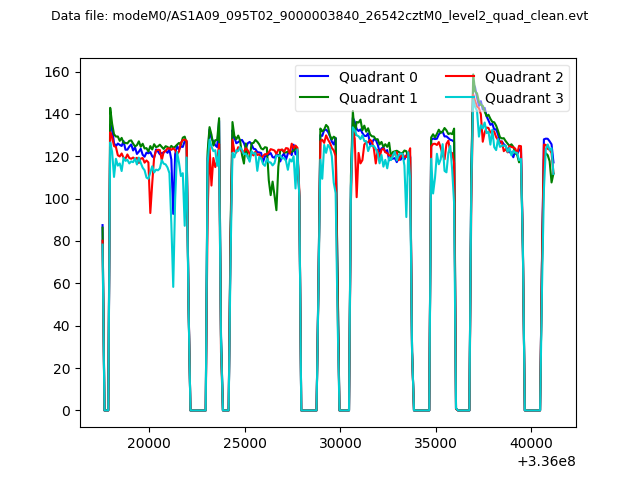 |
|
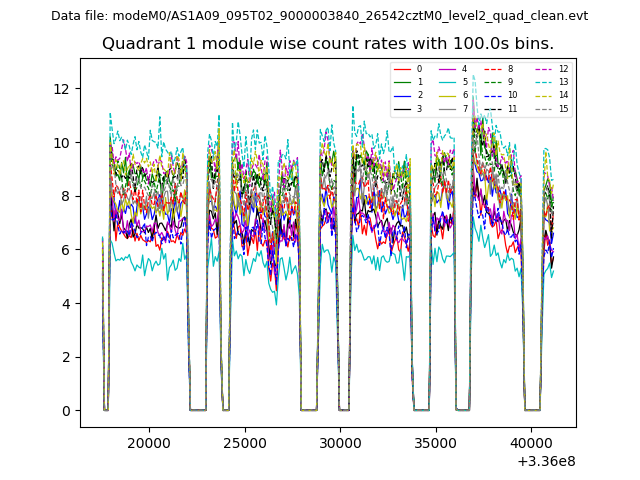
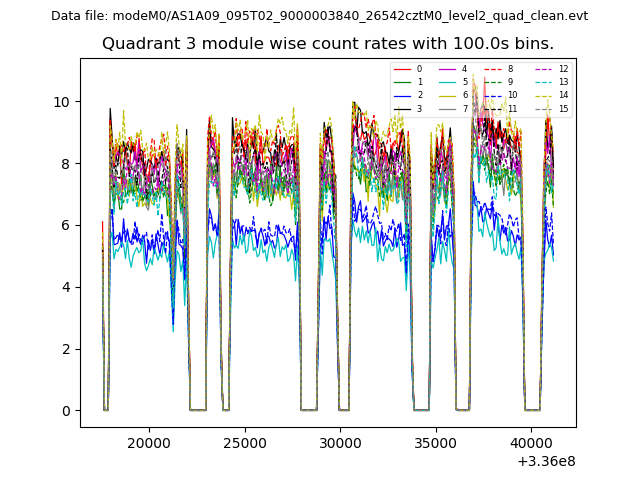
| Module-wise count rates for Quadrant A Data is divided into 100 sec bins |
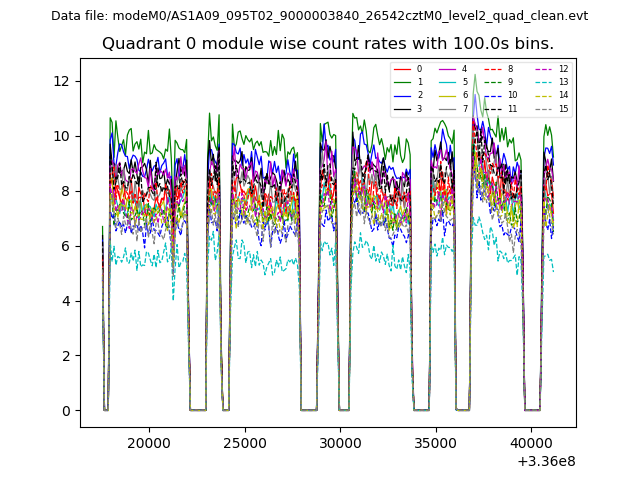 |
 |
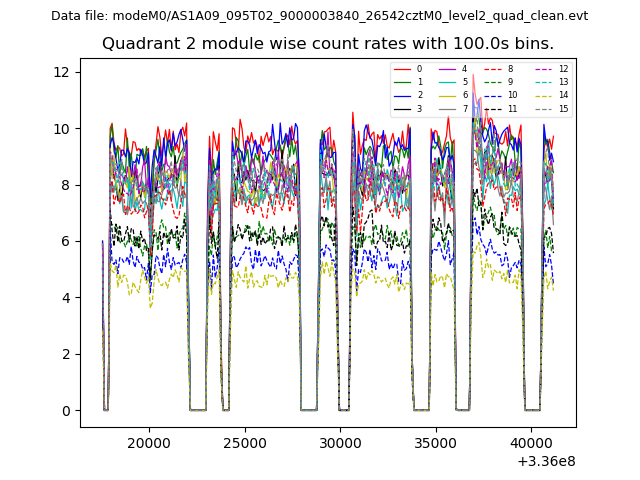
| Module-wise count rates for Quadrant B Data is divided into 100 sec bins |
 |
 |
| Module-wise count rates for Quadrant C Data is divided into 100 sec bins |
 |
 |
| Module-wise count rates for Quadrant D Data is divided into 100 sec bins |
 |
 |
| Parameter | Plot |
|---|---|
| CZT HV Monitor | 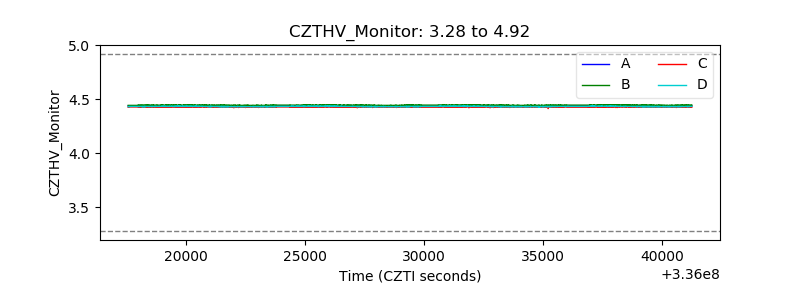 |
| D_VDD | 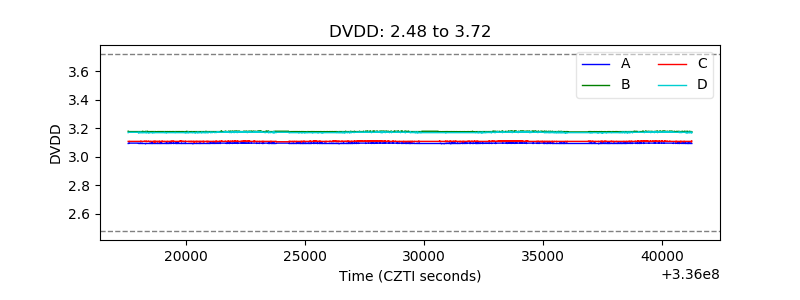 |
| Temperature 1 | 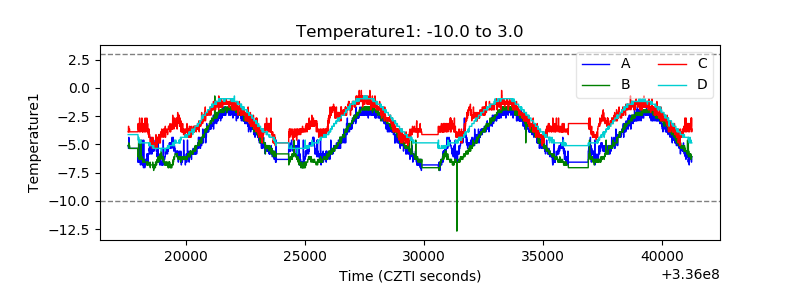 |
| Veto HV Monitor | 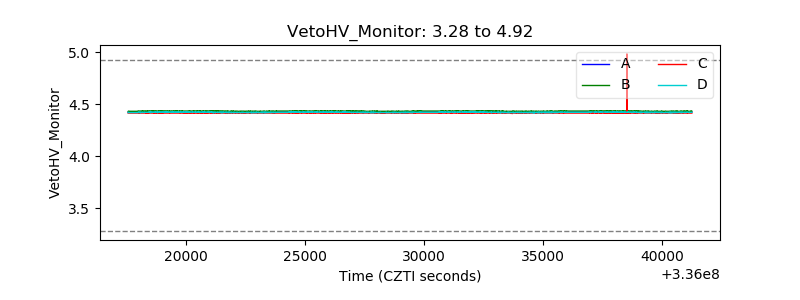 |
| Veto LLD | 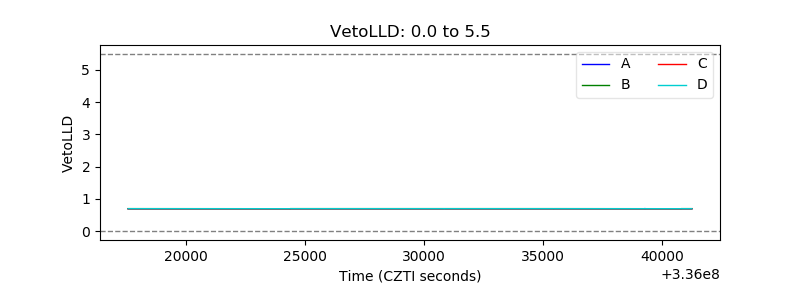 |
| Alpha Counter | 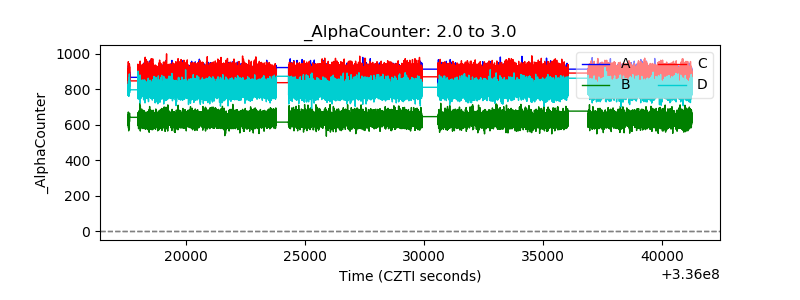 |
| _CPM_Rate | 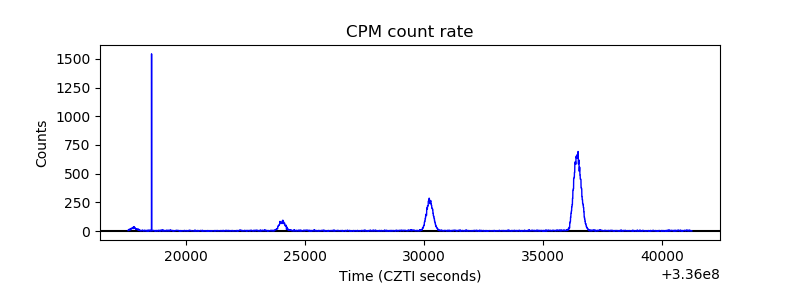 |
| CZT Counter | 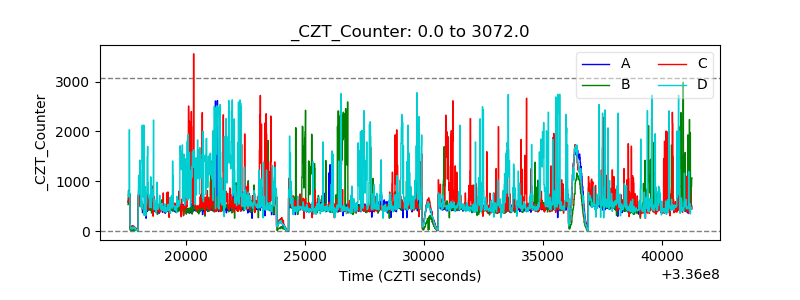 |
| +2.5 Volts monitor |  |
| +5 Volts monitor |  |
| _ROLL_ROT | 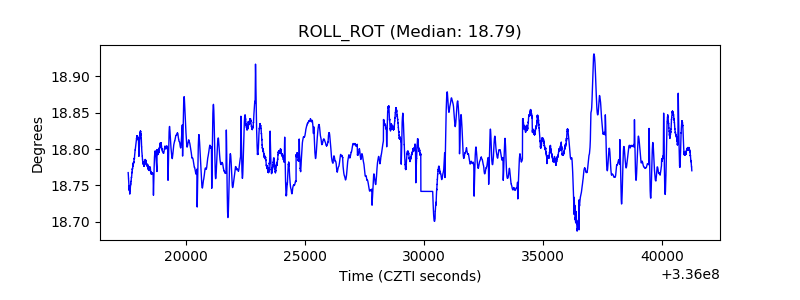 |
| _Roll_DEC | 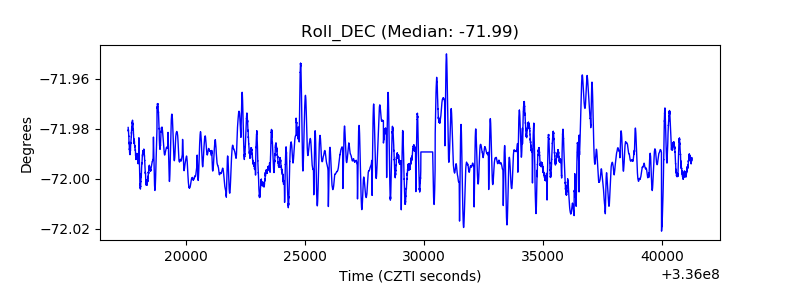 |
| _Roll_RA | 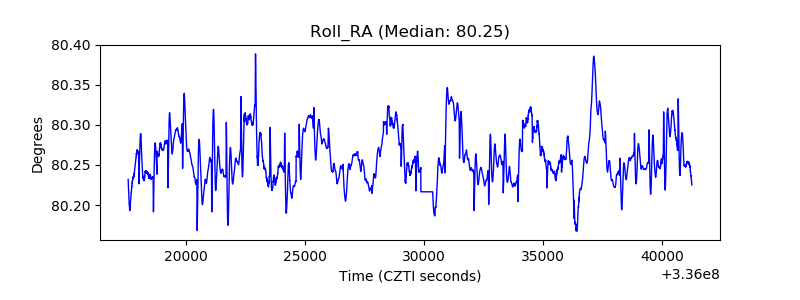 |
| Veto Counter | 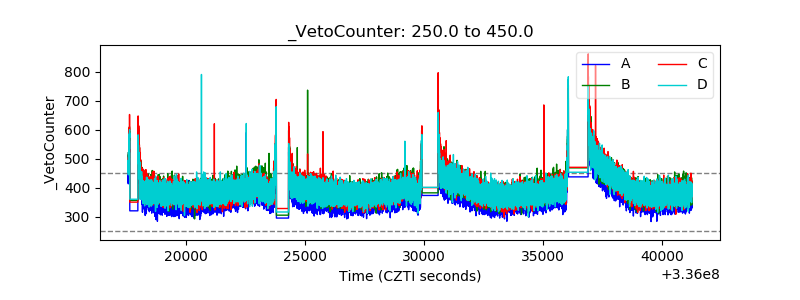 |