| Param | Original file | Final file |
|---|---|---|
| Filename | modeM0/AS1A09_095T02_9000003840_26544cztM0_level2.evt | modeM0/AS1A09_095T02_9000003840_26544cztM0_level2_quad_clean.evt |
| Size (bytes) | 706,181,760 | 147,810,240 |
| Size | 673.5 MB | 141.0 MB |
| Events in quadrant A | 4,116,454 | 1,010,577 |
| Events in quadrant B | 4,488,573 | 1,018,942 |
| Events in quadrant C | 4,752,218 | 973,754 |
| Events in quadrant D | 7,498,375 | 927,196 |
| Mode M9 | |||
|---|---|---|---|
| Quadrant | BADHDUFLAG | Total packets | Discarded packets |
| A | 0 | 22 | 0 |
| B | 0 | 22 | 0 |
| C | 0 | 22 | 0 |
| D | 0 | 22 | 0 |
| Mode M0 | |||
|---|---|---|---|
| Quadrant | BADHDUFLAG | Total packets | Discarded packets |
| A | 0 | 17126 | 0 |
| B | 0 | 18390 | 0 |
| C | 0 | 19384 | 0 |
| D | 0 | 27649 | 0 |
| Quadrant | Total seconds | Saturated seconds | Saturation percentage |
|---|---|---|---|
| A | 7852 | 77 | 0.980642% |
| B | 7853 | 184 | 2.343054% |
| C | 7853 | 281 | 3.578250% |
| D | 7853 | 925 | 11.778938% |
Noise dominated data is calculated using 1-second bins in cleaned event files. If a bin has >2000 counts, and if more than 50% of those come from <1% of pixels, then it is considered to be noise-dominated and hence unusable.
| Quadrant | # 1 sec bins | Bins with >0 counts | Bins with >2000 counts | High rate bins dominated by noise | Noise dominated (total time) | Noise dominated (detector-on time) | Marked lightcurve |
|---|---|---|---|---|---|---|---|
| A | 10017 | 7852 | 0 | 0 | 0.00% | 0.00% |  |
| B | 10018 | 7853 | 72 | 72 | 0.72% | 0.92% |  |
| C | 10018 | 7854 | 74 | 74 | 0.74% | 0.94% |  |
| D | 10018 | 7854 | 766 | 766 | 7.65% | 9.75% |  |
Top three noisy pixels from each quadrant. If the there are fewer than three noisy pixels in the level2.evt file, extra rows are filled as -1
| Pixel properties | Quadrant properties | ||||||
|---|---|---|---|---|---|---|---|
| Quadrant | DetID | PixID | Counts | Sigma | Mean | Median | Sigma |
| A | 5 | 168 | 119589 | 593.41 | 1016 | 998 | 199.8 |
| A | 0 | 13 | 68906 | 339.8 | 1016 | 998 | 199.8 |
| A | 13 | 254 | 13338 | 61.75 | 1016 | 998 | 199.8 |
| B | 3 | 64 | 510266 | 2752.89 | 998 | 975 | 185.0 |
| B | 0 | 229 | 31887 | 167.09 | 998 | 975 | 185.0 |
| B | 12 | 111 | 21720 | 112.13 | 998 | 975 | 185.0 |
| C | 4 | 254 | 598223 | 2685.92 | 967 | 974 | 222.4 |
| C | 3 | 233 | 220331 | 986.48 | 967 | 974 | 222.4 |
| C | 14 | 238 | 157516 | 703.99 | 967 | 974 | 222.4 |
| D | 7 | 80 | 2571133 | 11547.17 | 945 | 924 | 222.6 |
| D | 1 | 52 | 665330 | 2984.97 | 945 | 924 | 222.6 |
| D | 2 | 250 | 440205 | 1973.56 | 945 | 924 | 222.6 |
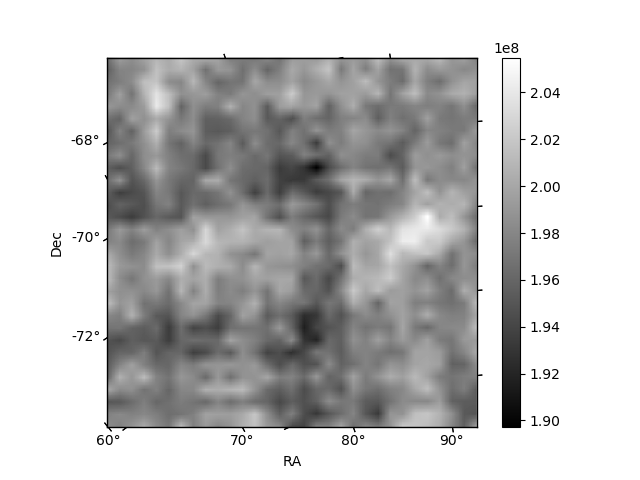
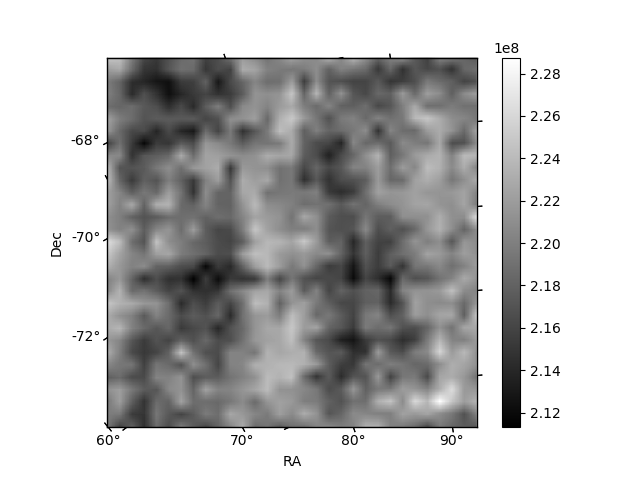
Histogram calculated using DETX and DETY for each event in the final _common_clean file
| Quadrant A | 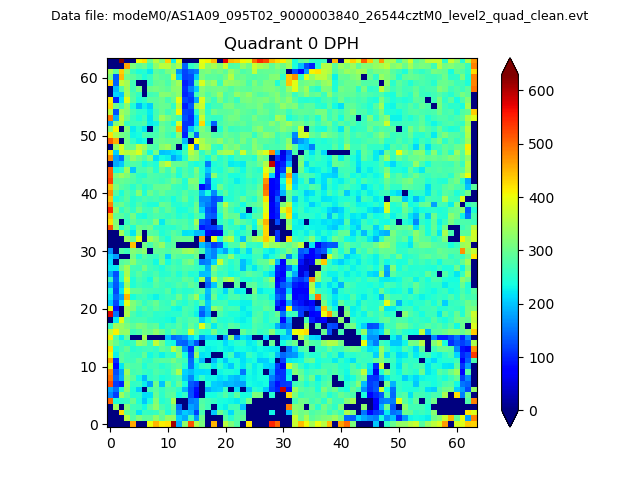 |
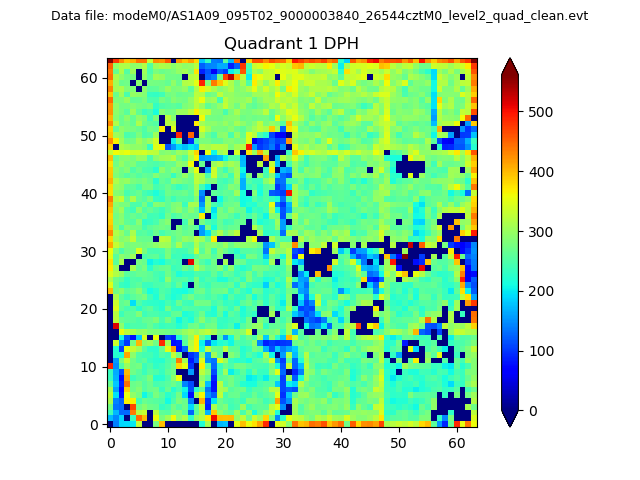 |
Quadrant B |
|---|---|---|---|
| Quadrant D | 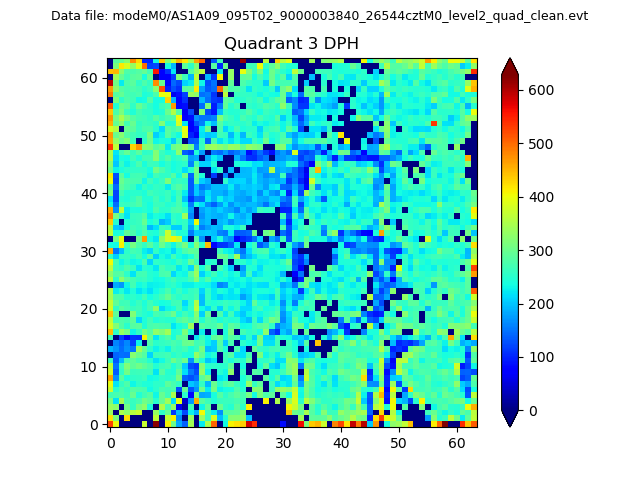 |
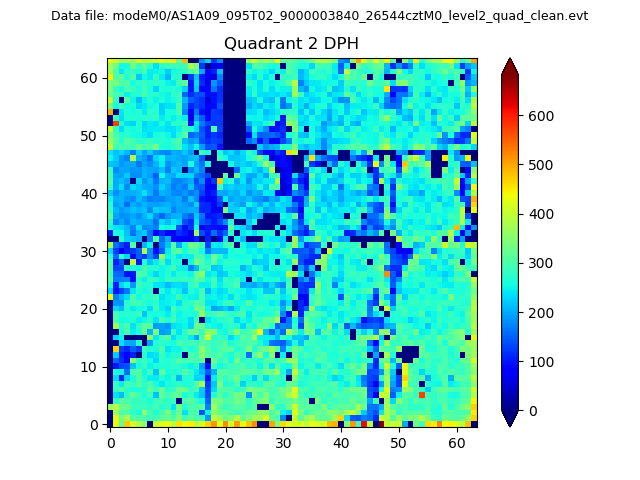 |
Quadrant C |
| Plot type | Count rate plots | Images |
|---|---|---|
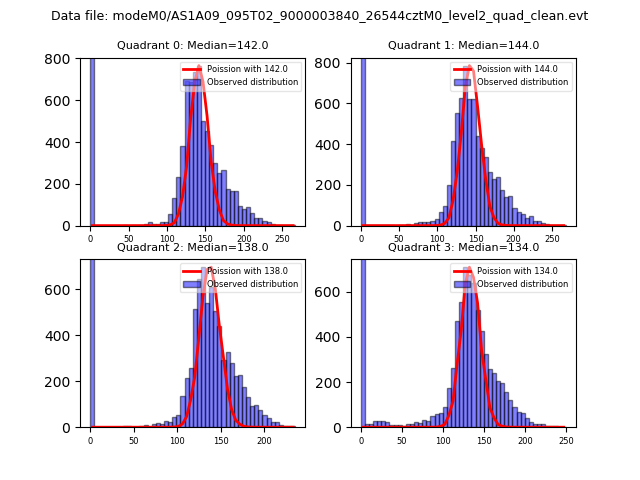
| Comparison with Poisson distribution Blue bars denote a histogram of data divided into 1 sec bins. Red curve is a Poisson curve with rate = median count rate of data. |
 |
 |
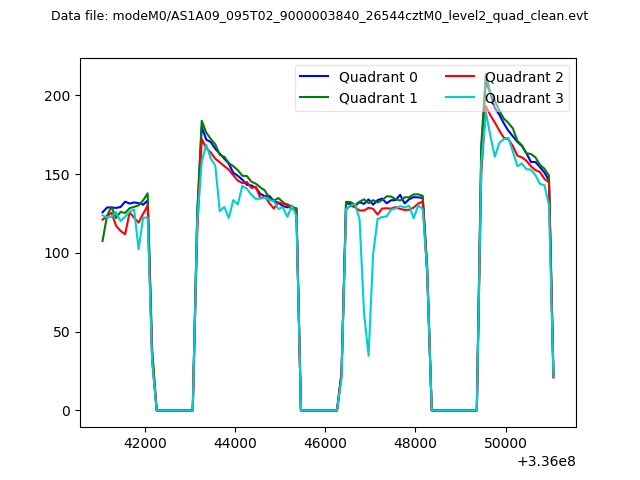
| Quadrant-wise count rates Data is divided into 100 sec bins |
 |
|
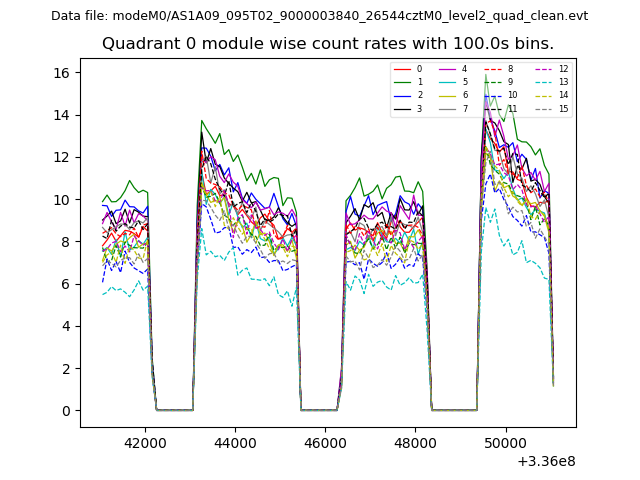
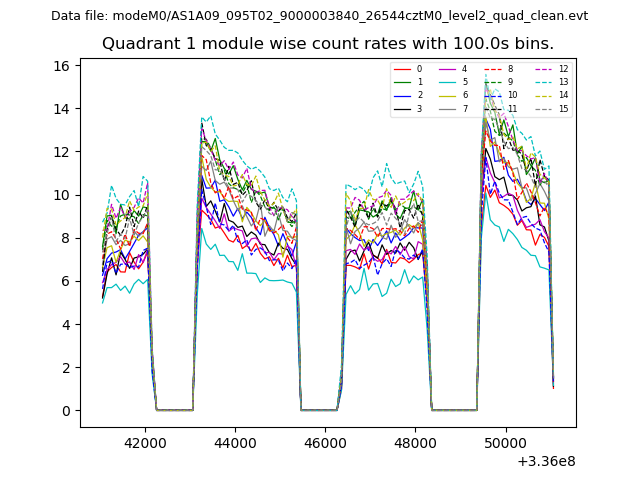
| Module-wise count rates for Quadrant A Data is divided into 100 sec bins |
 |
 |
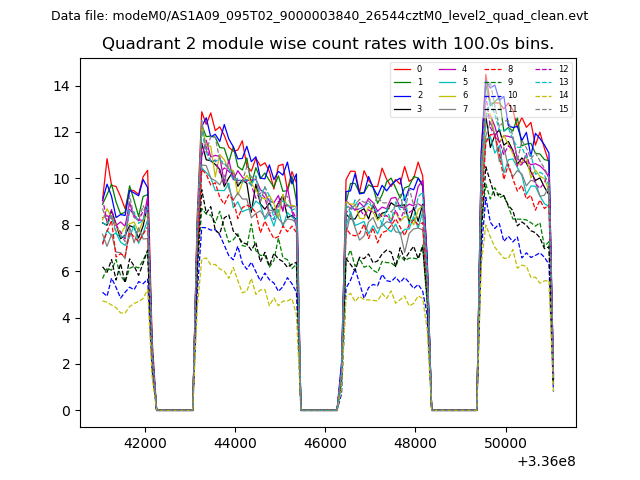
| Module-wise count rates for Quadrant B Data is divided into 100 sec bins |
 |
 |
| Module-wise count rates for Quadrant C Data is divided into 100 sec bins |
 |
 |
| Module-wise count rates for Quadrant D Data is divided into 100 sec bins |
 |
 |
| Parameter | Plot |
|---|---|
| CZT HV Monitor | 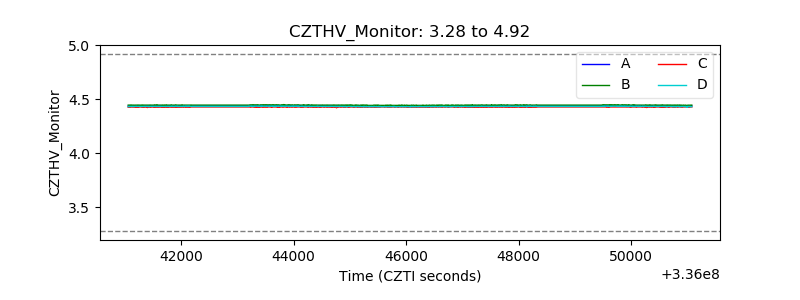 |
| D_VDD | 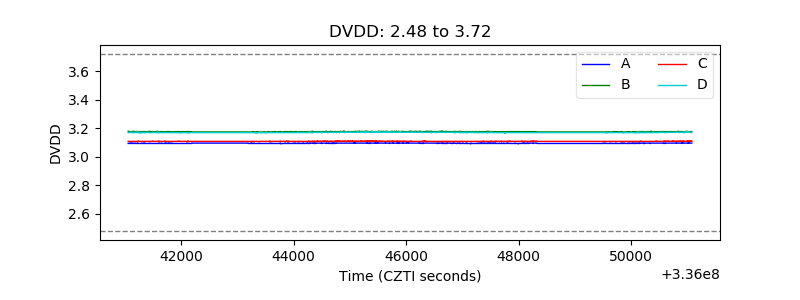 |
| Temperature 1 | 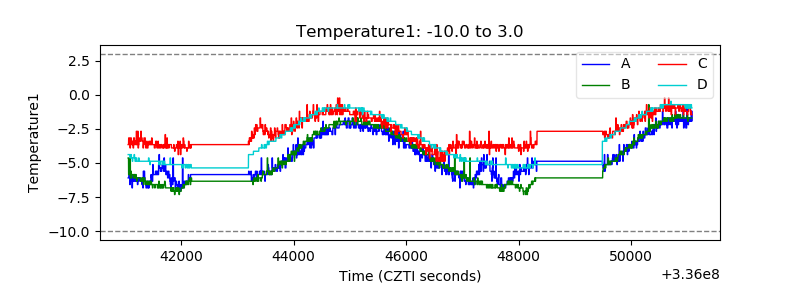 |
| Veto HV Monitor | 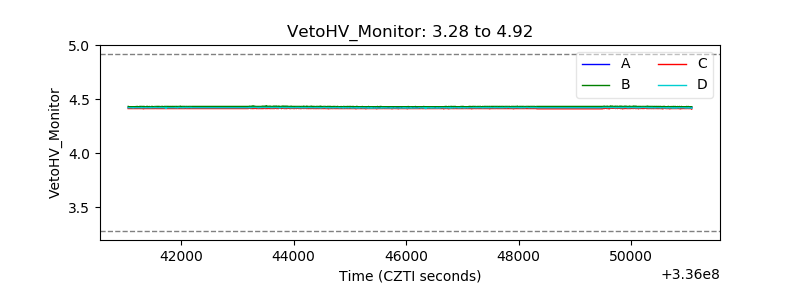 |
| Veto LLD | 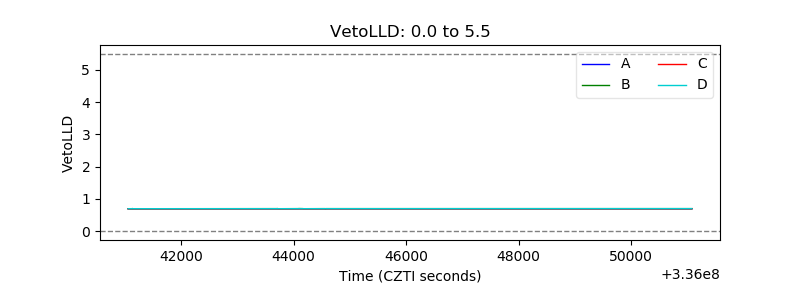 |
| Alpha Counter | 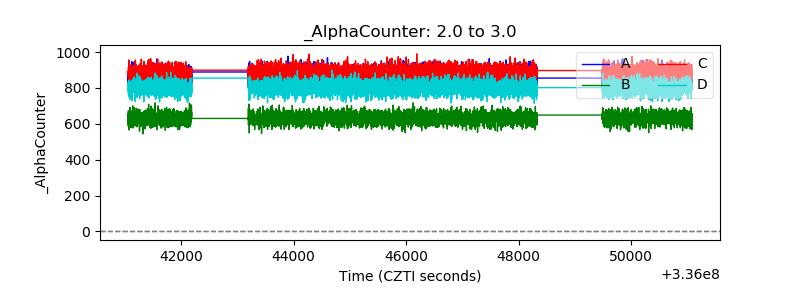 |
| _CPM_Rate | 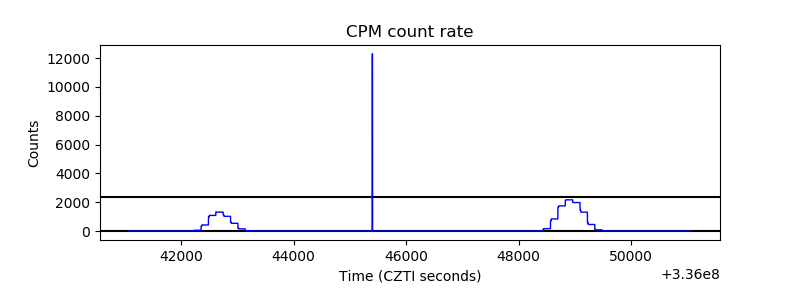 |
| CZT Counter | 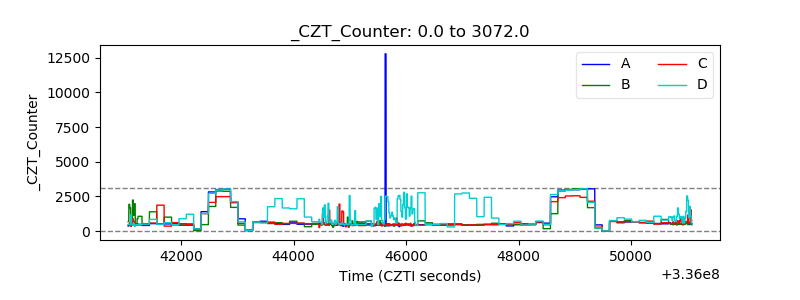 |
| +2.5 Volts monitor | 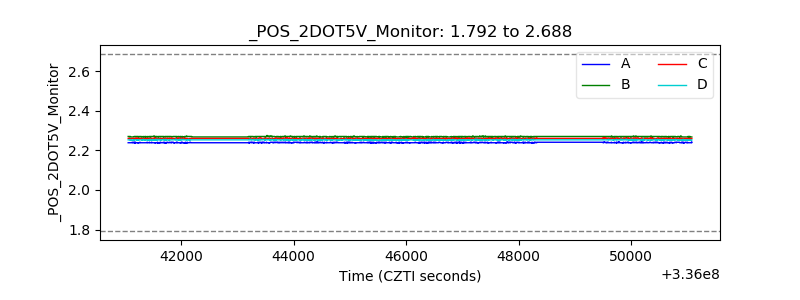 |
| +5 Volts monitor | 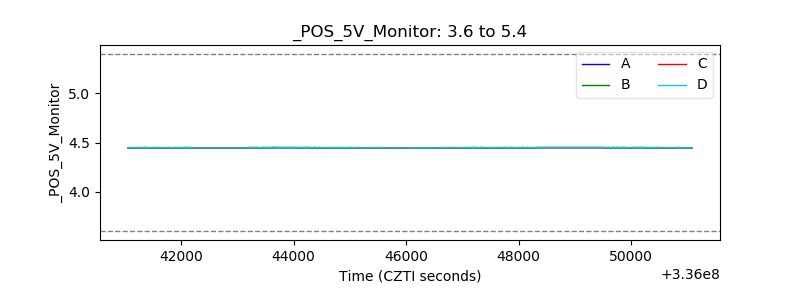 |
| _ROLL_ROT | 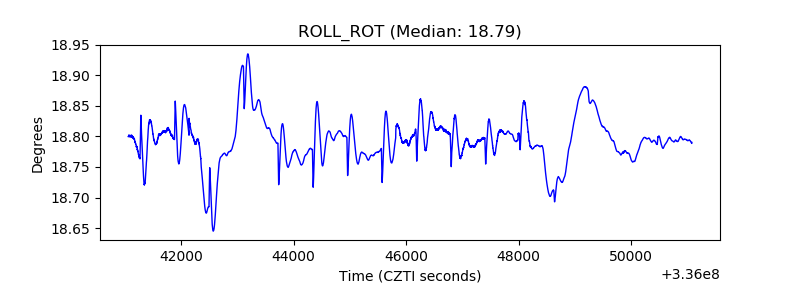 |
| _Roll_DEC |  |
| _Roll_RA | 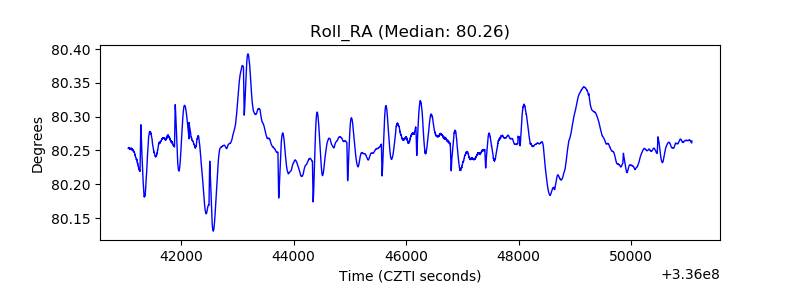 |
| Veto Counter | 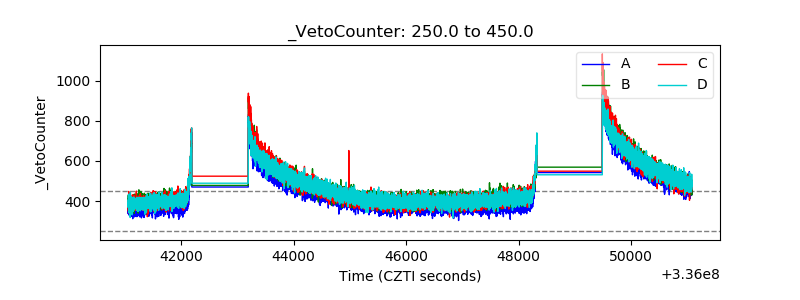 |