| Param | Original file | Final file |
|---|---|---|
| Filename | modeM0/AS1A09_095T02_9000003840_26545cztM0_level2.evt | modeM0/AS1A09_095T02_9000003840_26545cztM0_level2_quad_clean.evt |
| Size (bytes) | 589,999,680 | 115,176,960 |
| Size | 562.7 MB | 109.8 MB |
| Events in quadrant A | 3,757,558 | 801,122 |
| Events in quadrant B | 3,511,021 | 810,179 |
| Events in quadrant C | 4,930,466 | 710,187 |
| Events in quadrant D | 5,256,725 | 740,871 |
| Mode M9 | |||
|---|---|---|---|
| Quadrant | BADHDUFLAG | Total packets | Discarded packets |
| A | 0 | 13 | 0 |
| B | 0 | 13 | 0 |
| C | 0 | 13 | 0 |
| D | 0 | 13 | 0 |
| Mode M0 | |||
|---|---|---|---|
| Quadrant | BADHDUFLAG | Total packets | Discarded packets |
| A | 0 | 15176 | 0 |
| B | 0 | 14202 | 0 |
| C | 0 | 18786 | 0 |
| D | 0 | 19888 | 0 |
| Quadrant | Total seconds | Saturated seconds | Saturation percentage |
|---|---|---|---|
| A | 6102 | 49 | 0.803015% |
| B | 6103 | 69 | 1.130592% |
| C | 6103 | 783 | 12.829756% |
| D | 6103 | 366 | 5.997051% |
Noise dominated data is calculated using 1-second bins in cleaned event files. If a bin has >2000 counts, and if more than 50% of those come from <1% of pixels, then it is considered to be noise-dominated and hence unusable.
| Quadrant | # 1 sec bins | Bins with >0 counts | Bins with >2000 counts | High rate bins dominated by noise | Noise dominated (total time) | Noise dominated (detector-on time) | Marked lightcurve |
|---|---|---|---|---|---|---|---|
| A | 7377 | 6102 | 0 | 0 | 0.00% | 0.00% | 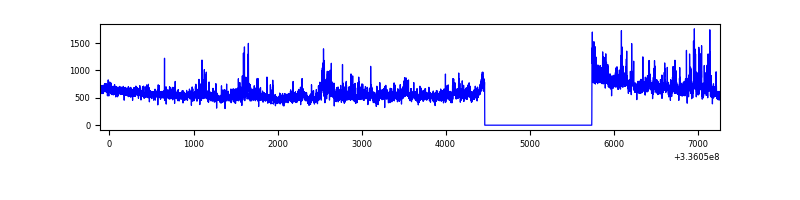 |
| B | 7378 | 6104 | 22 | 22 | 0.30% | 0.36% | 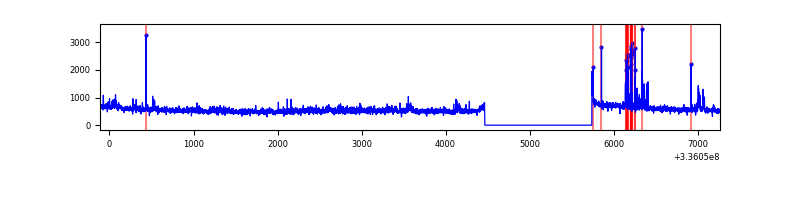 |
| C | 7377 | 6103 | 456 | 456 | 6.18% | 7.47% | 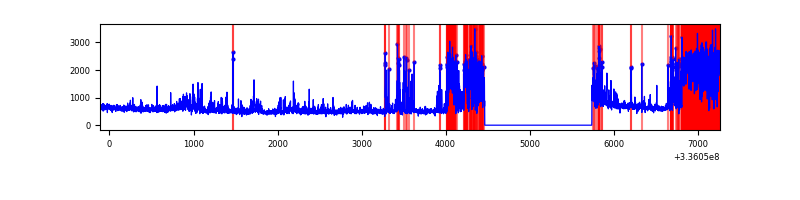 |
| D | 7378 | 6103 | 288 | 288 | 3.90% | 4.72% | 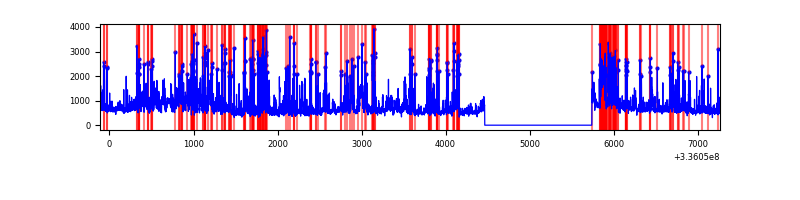 |
Top three noisy pixels from each quadrant. If the there are fewer than three noisy pixels in the level2.evt file, extra rows are filled as -1
| Pixel properties | Quadrant properties | ||||||
|---|---|---|---|---|---|---|---|
| Quadrant | DetID | PixID | Counts | Sigma | Mean | Median | Sigma |
| A | 0 | 13 | 494233 | 3069.12 | 826 | 813 | 160.8 |
| A | 5 | 168 | 74682 | 459.47 | 826 | 813 | 160.8 |
| A | 13 | 254 | 11347 | 65.52 | 826 | 813 | 160.8 |
| B | 3 | 64 | 283142 | 1921.62 | 808 | 790 | 146.9 |
| B | 3 | 112 | 22921 | 150.62 | 808 | 790 | 146.9 |
| B | 0 | 190 | 21726 | 142.49 | 808 | 790 | 146.9 |
| C | 4 | 254 | 1504126 | 9078.05 | 728 | 735 | 165.6 |
| C | 3 | 233 | 462744 | 2789.79 | 728 | 735 | 165.6 |
| C | 14 | 238 | 118867 | 713.33 | 728 | 735 | 165.6 |
| D | 7 | 80 | 1031204 | 5613.94 | 777 | 761 | 183.6 |
| D | 1 | 52 | 908474 | 4945.3 | 777 | 761 | 183.6 |
| D | 2 | 250 | 279002 | 1515.88 | 777 | 761 | 183.6 |
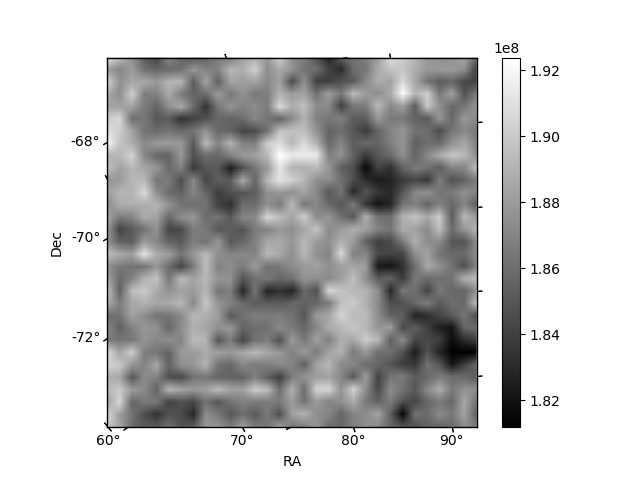
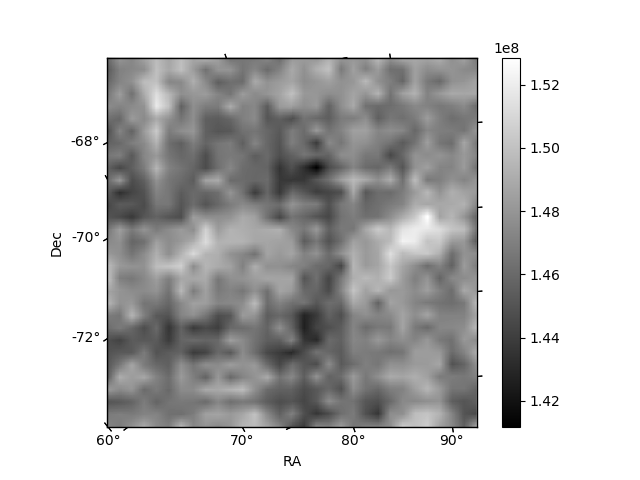
Histogram calculated using DETX and DETY for each event in the final _common_clean file
| Quadrant A | 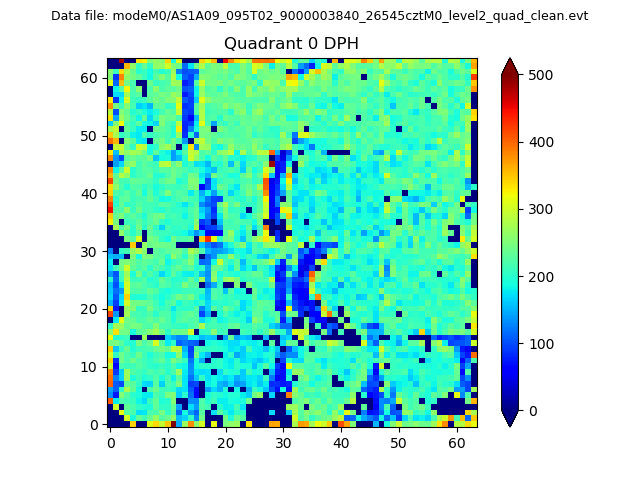 |
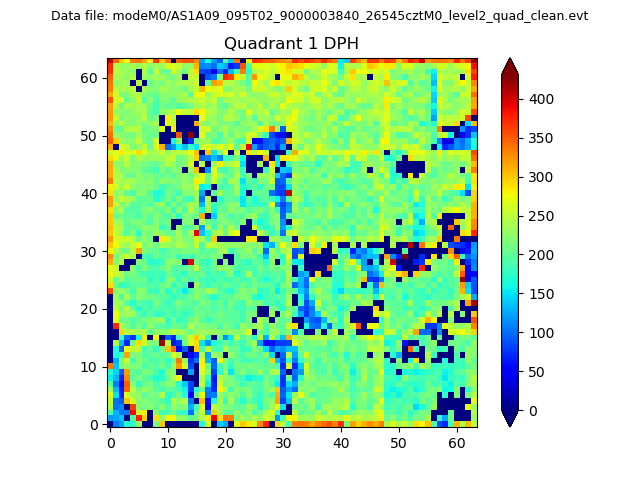 |
Quadrant B |
|---|---|---|---|
| Quadrant D |  |
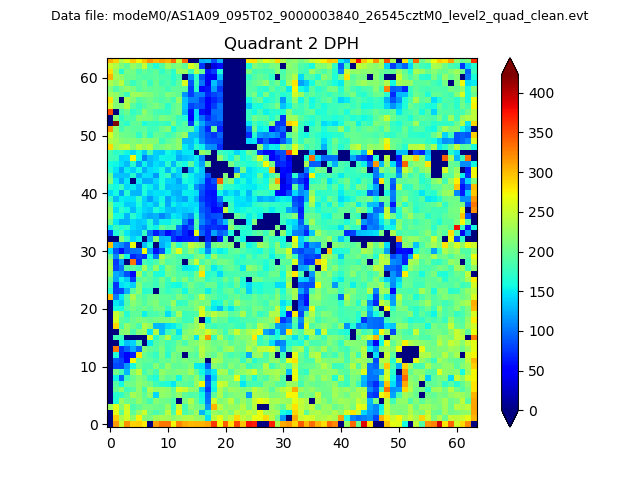 |
Quadrant C |
| Plot type | Count rate plots | Images |
|---|---|---|
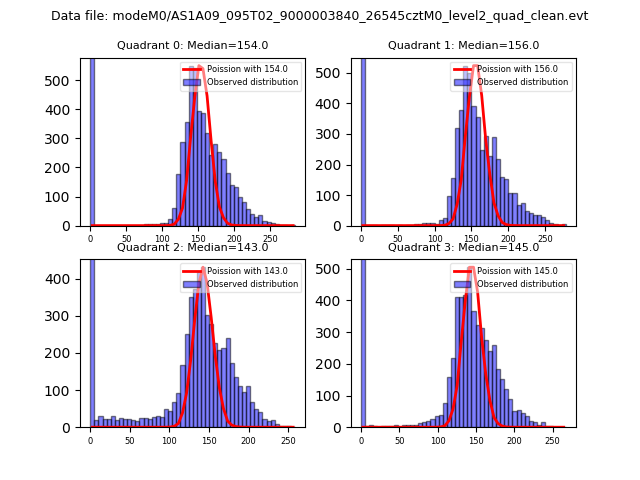
| Comparison with Poisson distribution Blue bars denote a histogram of data divided into 1 sec bins. Red curve is a Poisson curve with rate = median count rate of data. |
 |
 |
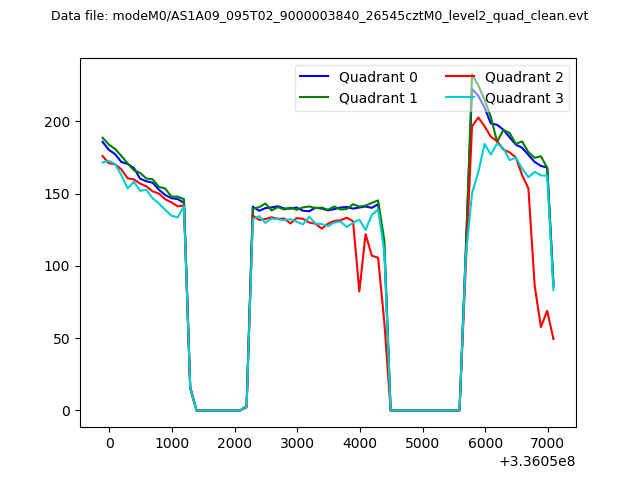
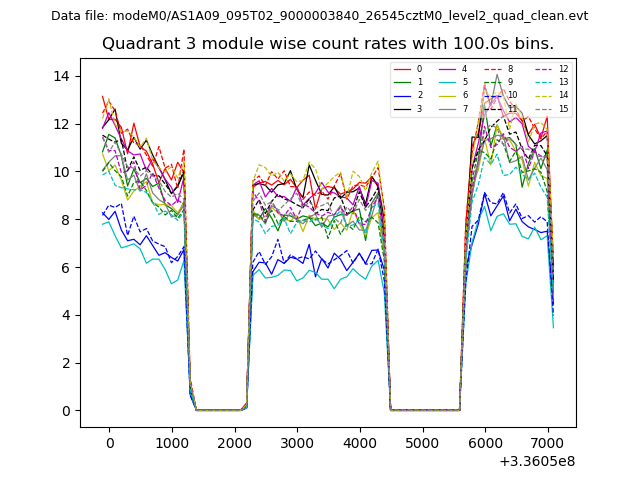
| Quadrant-wise count rates Data is divided into 100 sec bins |
 |
|
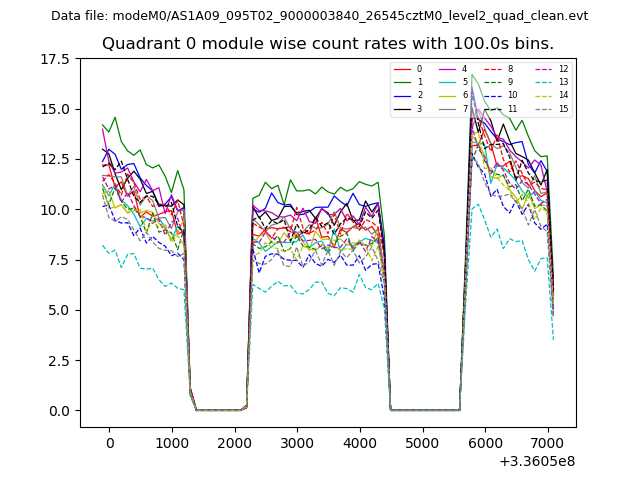
| Module-wise count rates for Quadrant A Data is divided into 100 sec bins |
 |
 |
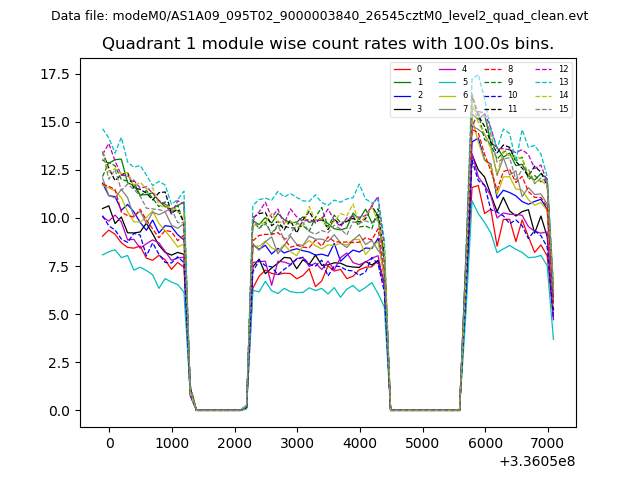
| Module-wise count rates for Quadrant B Data is divided into 100 sec bins |
 |
 |
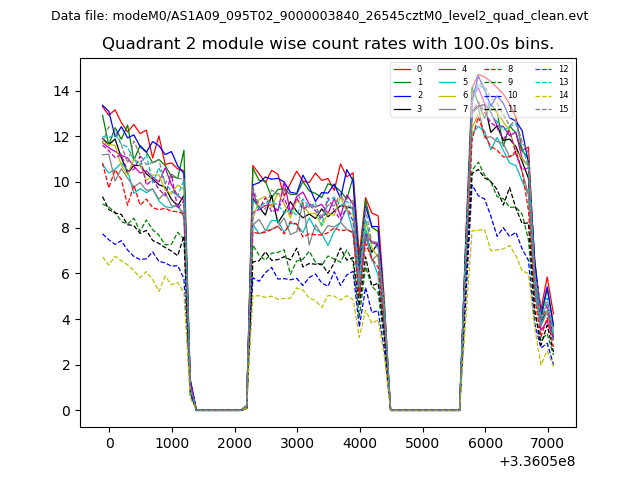
| Module-wise count rates for Quadrant C Data is divided into 100 sec bins |
 |
 |
| Module-wise count rates for Quadrant D Data is divided into 100 sec bins |
 |
 |
| Parameter | Plot |
|---|---|
| CZT HV Monitor | 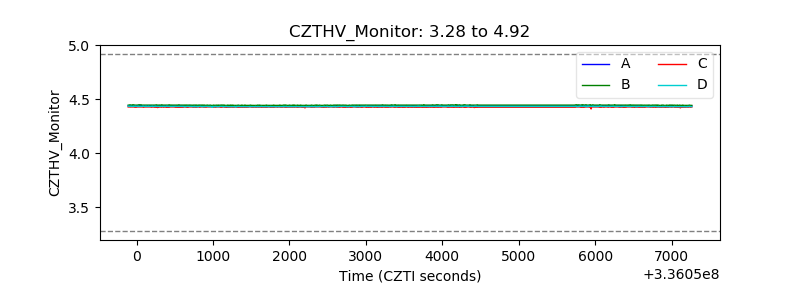 |
| D_VDD | 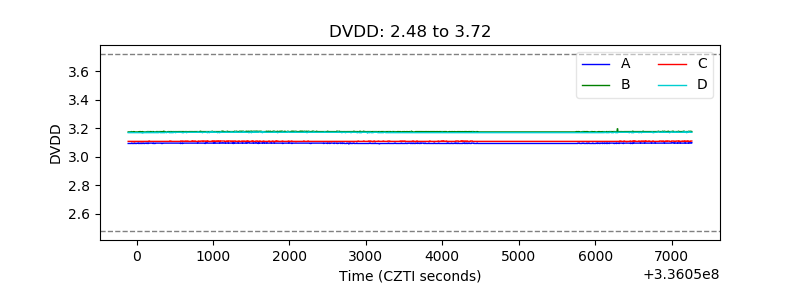 |
| Temperature 1 | 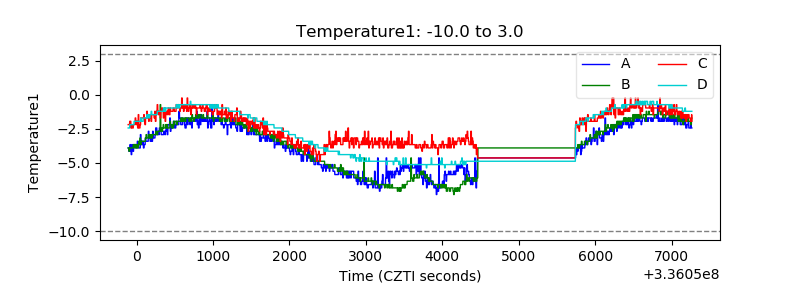 |
| Veto HV Monitor | 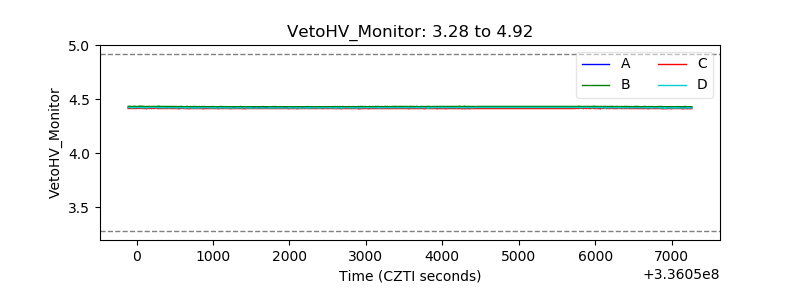 |
| Veto LLD | 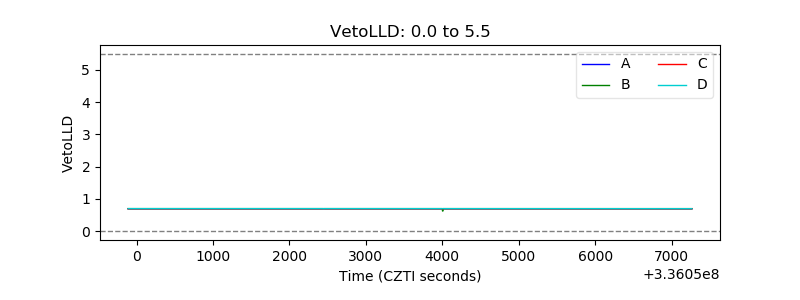 |
| Alpha Counter | 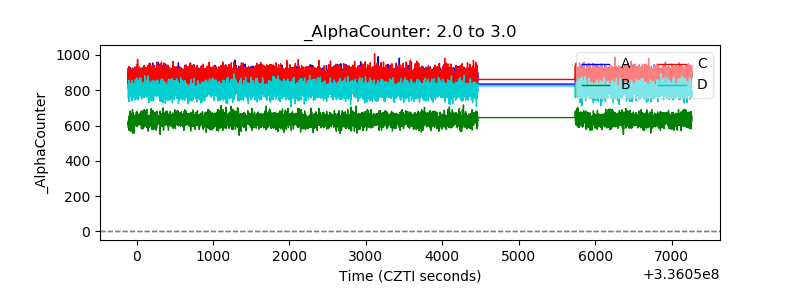 |
| _CPM_Rate | 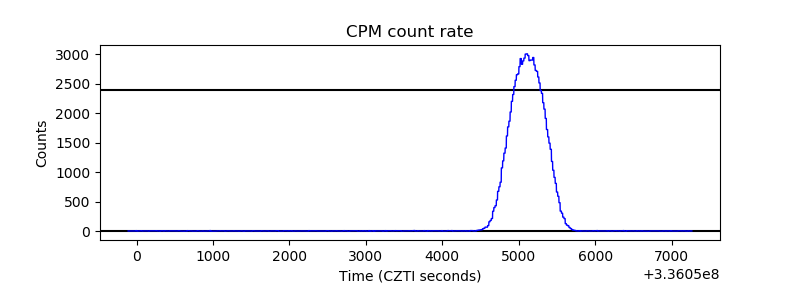 |
| CZT Counter |  |
| +2.5 Volts monitor |  |
| +5 Volts monitor |  |
| _ROLL_ROT | 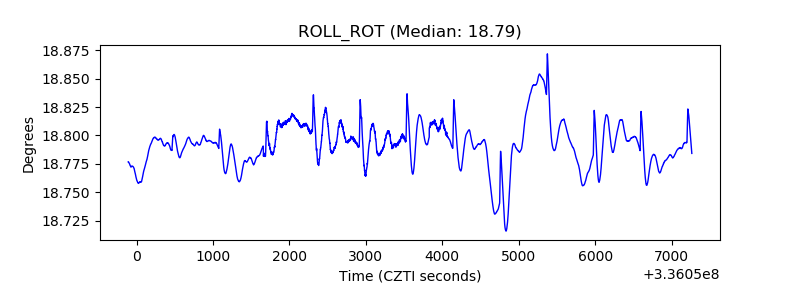 |
| _Roll_DEC |  |
| _Roll_RA | 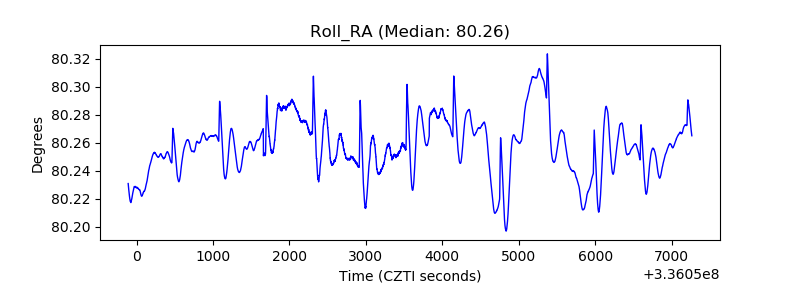 |
| Veto Counter | 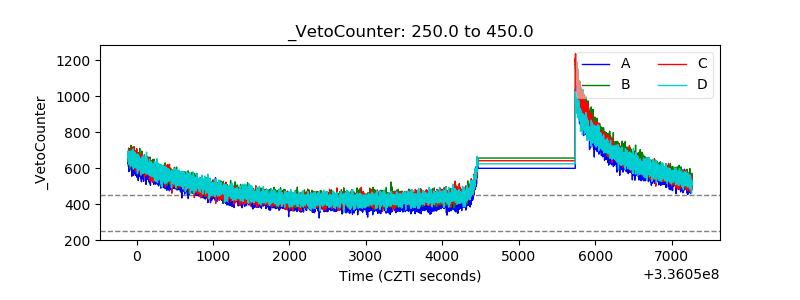 |