| Param | Original file | Final file |
|---|---|---|
| Filename | modeM0/AS1A09_095T02_9000003840_26546cztM0_level2.evt | modeM0/AS1A09_095T02_9000003840_26546cztM0_level2_quad_clean.evt |
| Size (bytes) | 603,492,480 | 105,295,680 |
| Size | 575.5 MB | 100.4 MB |
| Events in quadrant A | 3,655,123 | 735,883 |
| Events in quadrant B | 3,574,476 | 744,450 |
| Events in quadrant C | 4,910,347 | 658,354 |
| Events in quadrant D | 5,737,564 | 637,430 |
| Mode M9 | |||
|---|---|---|---|
| Quadrant | BADHDUFLAG | Total packets | Discarded packets |
| A | 0 | 14 | 0 |
| B | 0 | 14 | 0 |
| C | 0 | 14 | 0 |
| D | 0 | 14 | 0 |
| Mode M0 | |||
|---|---|---|---|
| Quadrant | BADHDUFLAG | Total packets | Discarded packets |
| A | 0 | 14840 | 0 |
| B | 0 | 14397 | 0 |
| C | 0 | 18599 | 0 |
| D | 0 | 21125 | 0 |
| Quadrant | Total seconds | Saturated seconds | Saturation percentage |
|---|---|---|---|
| A | 5909 | 109 | 1.844644% |
| B | 5909 | 137 | 2.318497% |
| C | 5909 | 757 | 12.810966% |
| D | 5909 | 791 | 13.386360% |
Noise dominated data is calculated using 1-second bins in cleaned event files. If a bin has >2000 counts, and if more than 50% of those come from <1% of pixels, then it is considered to be noise-dominated and hence unusable.
| Quadrant | # 1 sec bins | Bins with >0 counts | Bins with >2000 counts | High rate bins dominated by noise | Noise dominated (total time) | Noise dominated (detector-on time) | Marked lightcurve |
|---|---|---|---|---|---|---|---|
| A | 7229 | 5909 | 26 | 26 | 0.36% | 0.44% | 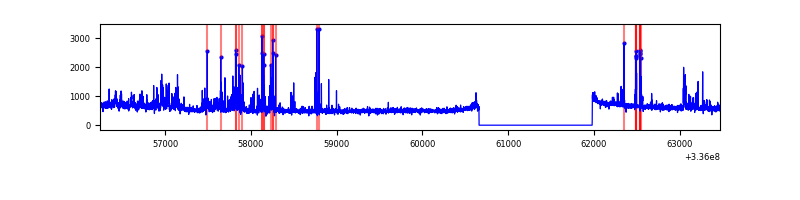 |
| B | 7229 | 5909 | 40 | 40 | 0.55% | 0.68% | 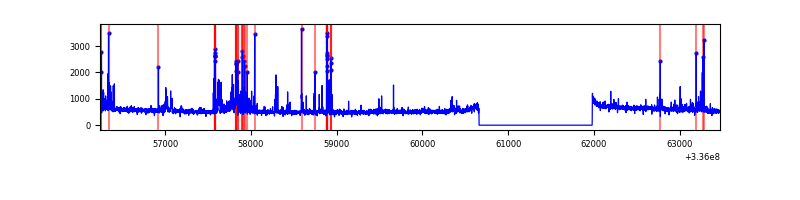 |
| C | 7229 | 5909 | 490 | 490 | 6.78% | 8.29% | 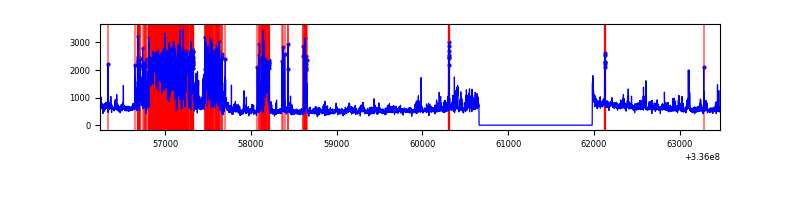 |
| D | 7229 | 5909 | 666 | 666 | 9.21% | 11.27% | 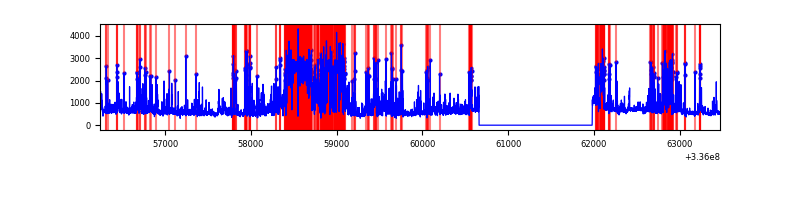 |
Top three noisy pixels from each quadrant. If the there are fewer than three noisy pixels in the level2.evt file, extra rows are filled as -1
| Pixel properties | Quadrant properties | ||||||
|---|---|---|---|---|---|---|---|
| Quadrant | DetID | PixID | Counts | Sigma | Mean | Median | Sigma |
| A | 0 | 13 | 423331 | 2645.5 | 821 | 810 | 159.7 |
| A | 5 | 168 | 64914 | 401.37 | 821 | 810 | 159.7 |
| A | 13 | 254 | 10735 | 62.14 | 821 | 810 | 159.7 |
| B | 3 | 64 | 357937 | 2422.25 | 808 | 792 | 147.4 |
| B | 3 | 112 | 24529 | 160.99 | 808 | 792 | 147.4 |
| B | 5 | 172 | 23222 | 152.13 | 808 | 792 | 147.4 |
| C | 4 | 254 | 1580003 | 9570.92 | 726 | 733 | 165.0 |
| C | 3 | 233 | 380106 | 2299.13 | 726 | 733 | 165.0 |
| C | 14 | 238 | 120490 | 725.77 | 726 | 733 | 165.0 |
| D | 1 | 52 | 1712229 | 9814.33 | 742 | 726 | 174.4 |
| D | 7 | 80 | 904757 | 5184.01 | 742 | 726 | 174.4 |
| D | 2 | 250 | 225427 | 1288.51 | 742 | 726 | 174.4 |
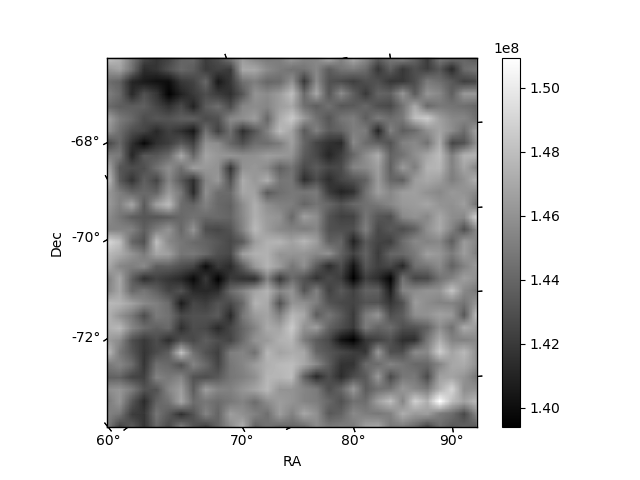
Histogram calculated using DETX and DETY for each event in the final _common_clean file
| Quadrant A | 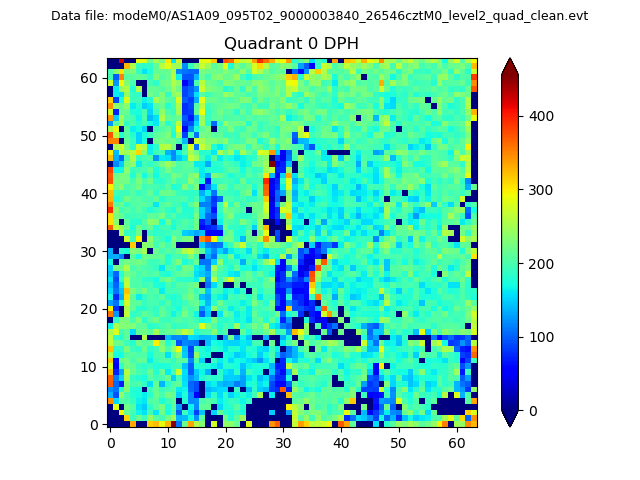 |
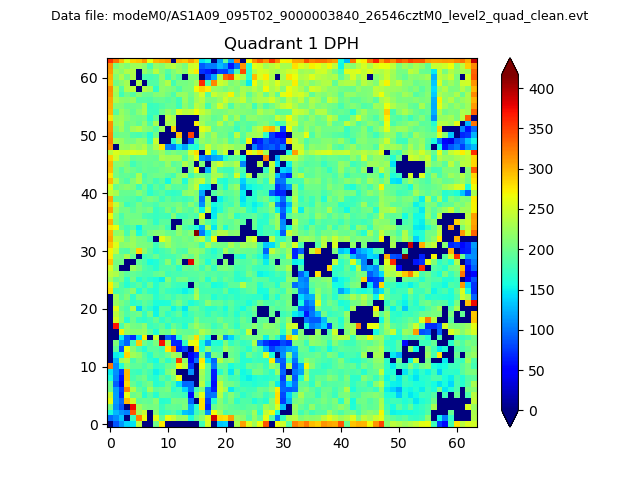 |
Quadrant B |
|---|---|---|---|
| Quadrant D |  |
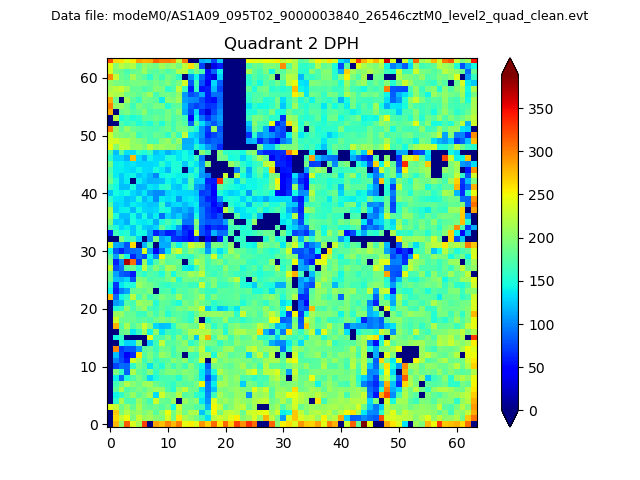 |
Quadrant C |
| Plot type | Count rate plots | Images |
|---|---|---|
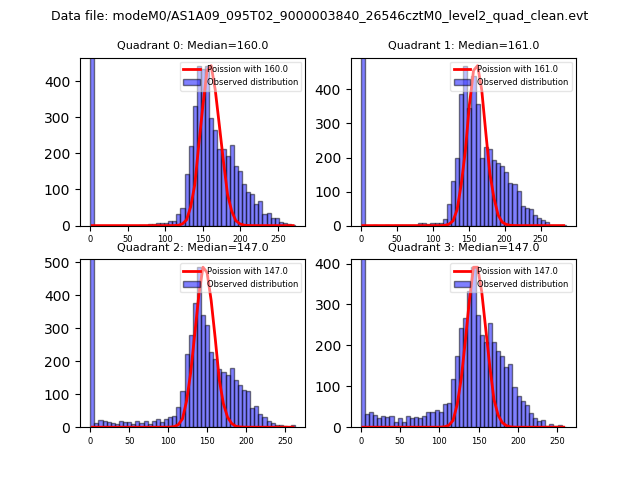
| Comparison with Poisson distribution Blue bars denote a histogram of data divided into 1 sec bins. Red curve is a Poisson curve with rate = median count rate of data. |
 |
 |
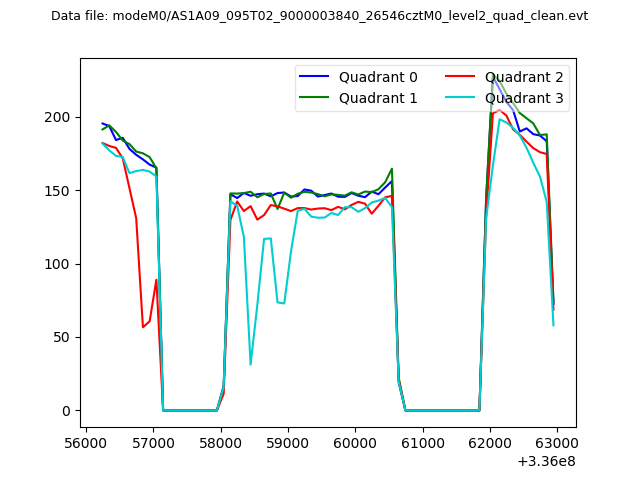
| Quadrant-wise count rates Data is divided into 100 sec bins |
 |
|
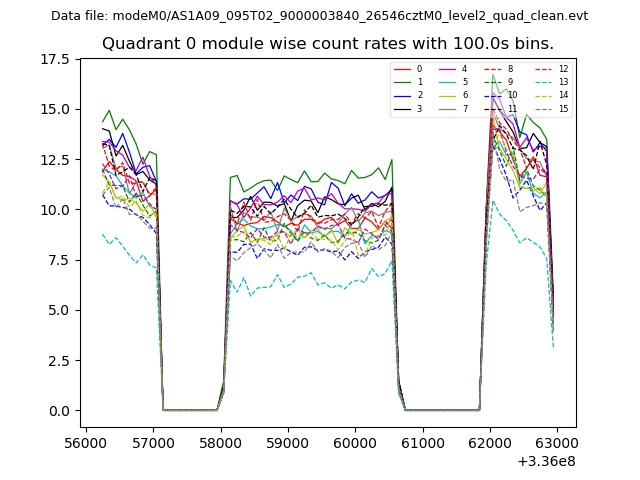
| Module-wise count rates for Quadrant A Data is divided into 100 sec bins |
 |
 |
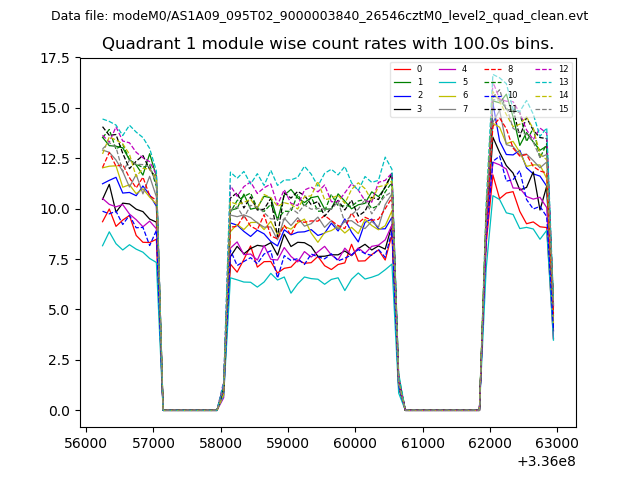
| Module-wise count rates for Quadrant B Data is divided into 100 sec bins |
 |
 |
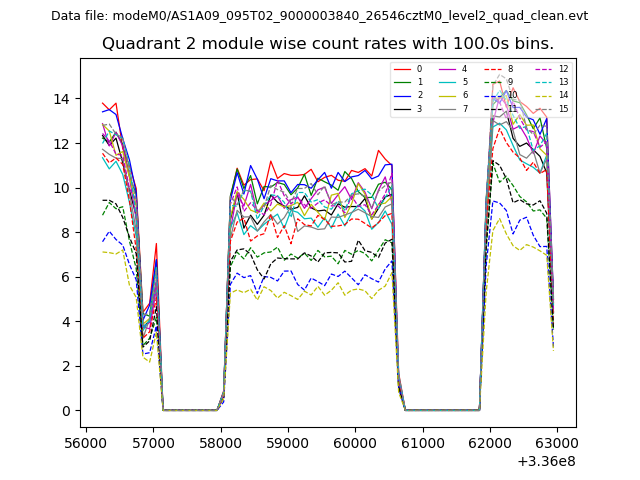
| Module-wise count rates for Quadrant C Data is divided into 100 sec bins |
 |
 |
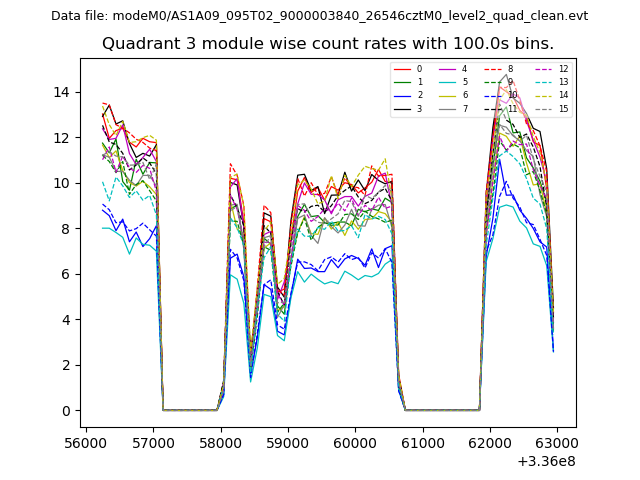
| Module-wise count rates for Quadrant D Data is divided into 100 sec bins |
 |
 |
| Parameter | Plot |
|---|---|
| CZT HV Monitor | 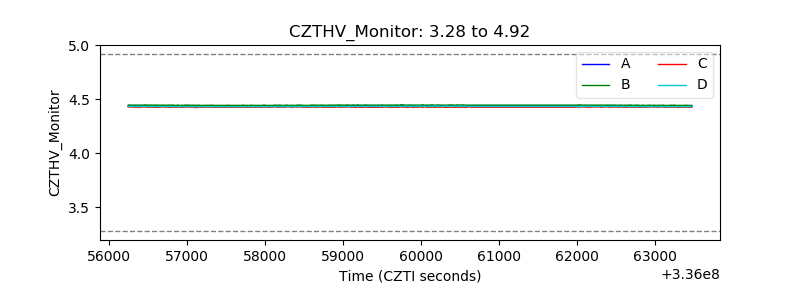 |
| D_VDD | 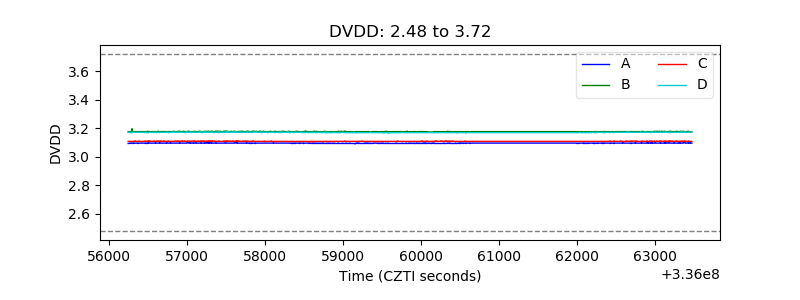 |
| Temperature 1 | 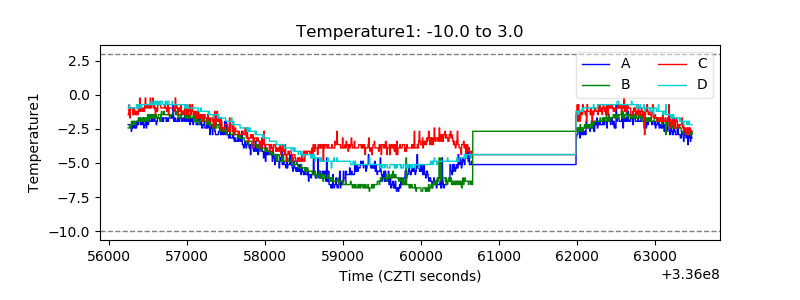 |
| Veto HV Monitor |  |
| Veto LLD | 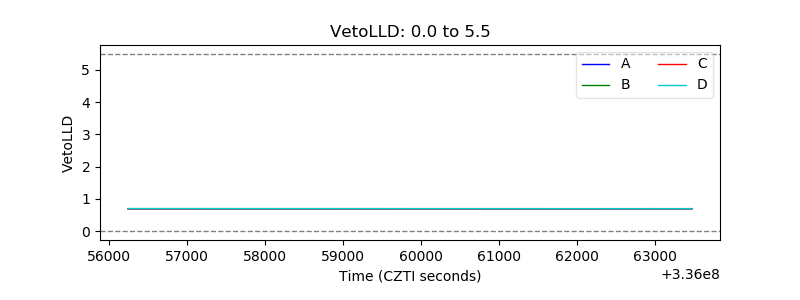 |
| Alpha Counter | 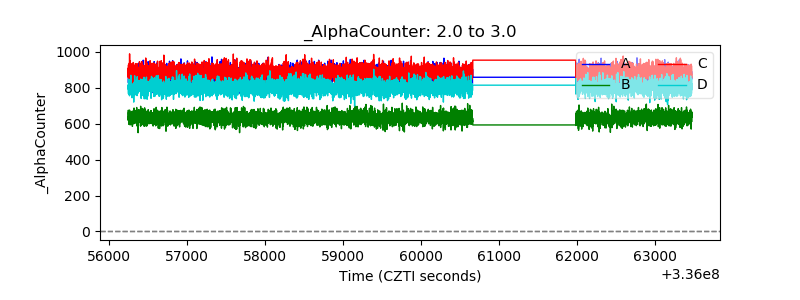 |
| _CPM_Rate |  |
| CZT Counter | 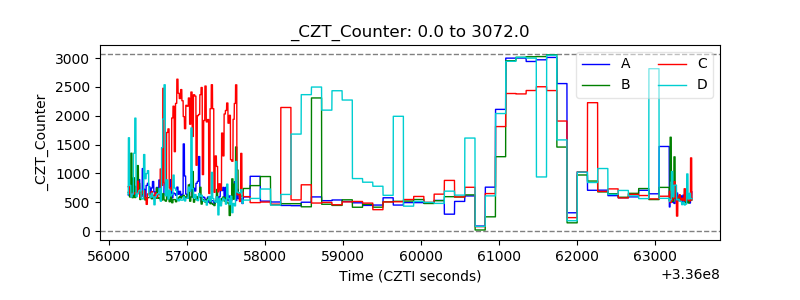 |
| +2.5 Volts monitor |  |
| +5 Volts monitor |  |
| _ROLL_ROT | 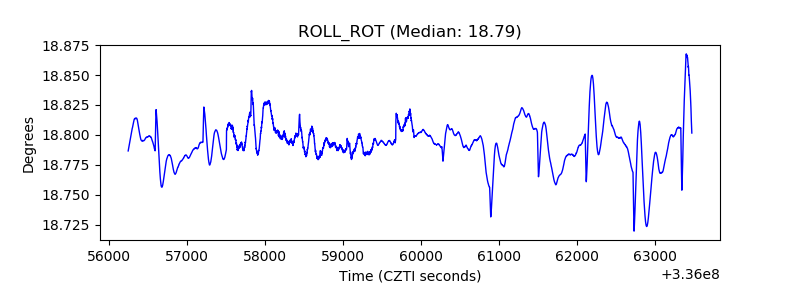 |
| _Roll_DEC | 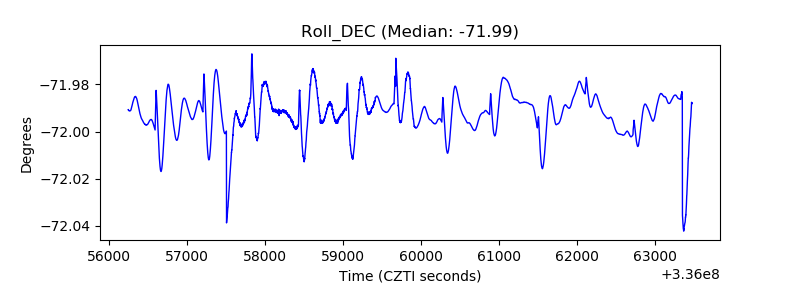 |
| _Roll_RA | 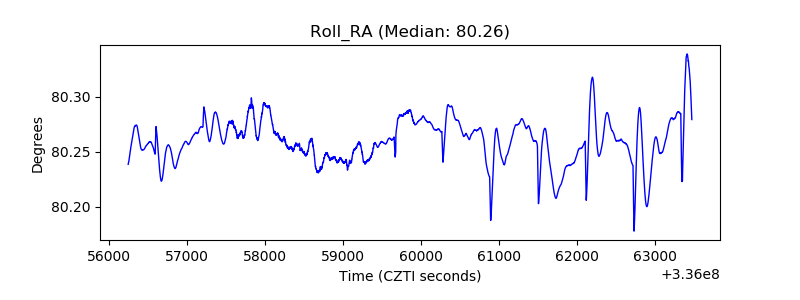 |
| Veto Counter | 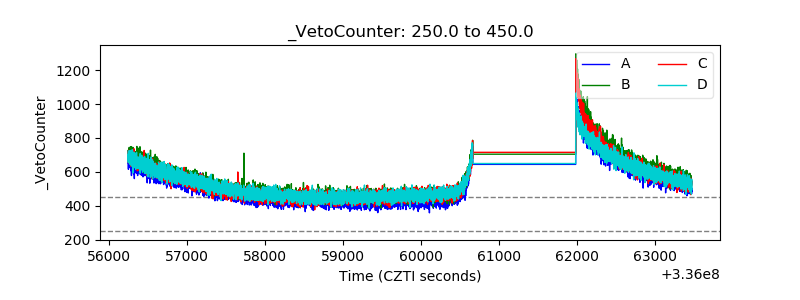 |