| Param | Original file | Final file |
|---|---|---|
| Filename | modeM0/AS1A09_095T02_9000003840_26548cztM0_level2.evt | modeM0/AS1A09_095T02_9000003840_26548cztM0_level2_quad_clean.evt |
| Size (bytes) | 531,103,680 | 93,744,000 |
| Size | 506.5 MB | 89.4 MB |
| Events in quadrant A | 3,694,661 | 614,662 |
| Events in quadrant B | 3,992,494 | 622,856 |
| Events in quadrant C | 3,273,535 | 592,707 |
| Events in quadrant D | 4,714,578 | 586,883 |
| Mode M9 | |||
|---|---|---|---|
| Quadrant | BADHDUFLAG | Total packets | Discarded packets |
| A | 0 | 14 | 0 |
| B | 0 | 14 | 0 |
| C | 0 | 14 | 0 |
| D | 0 | 14 | 0 |
| Mode M0 | |||
|---|---|---|---|
| Quadrant | BADHDUFLAG | Total packets | Discarded packets |
| A | 0 | 14674 | 0 |
| B | 0 | 15760 | 0 |
| C | 0 | 13436 | 0 |
| D | 0 | 18007 | 0 |
| Quadrant | Total seconds | Saturated seconds | Saturation percentage |
|---|---|---|---|
| A | 6040 | 238 | 3.940397% |
| B | 6041 | 263 | 4.353584% |
| C | 6041 | 120 | 1.986426% |
| D | 6041 | 378 | 6.257242% |
Noise dominated data is calculated using 1-second bins in cleaned event files. If a bin has >2000 counts, and if more than 50% of those come from <1% of pixels, then it is considered to be noise-dominated and hence unusable.
| Quadrant | # 1 sec bins | Bins with >0 counts | Bins with >2000 counts | High rate bins dominated by noise | Noise dominated (total time) | Noise dominated (detector-on time) | Marked lightcurve |
|---|---|---|---|---|---|---|---|
| A | 7365 | 6040 | 146 | 146 | 1.98% | 2.42% | 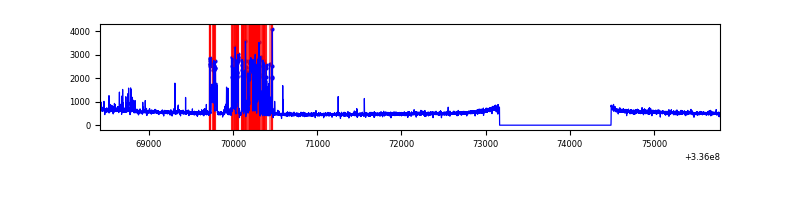 |
| B | 7366 | 6041 | 128 | 128 | 1.74% | 2.12% | 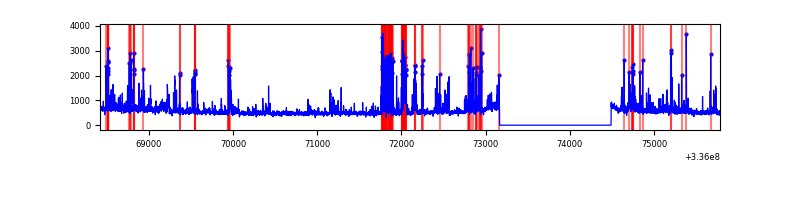 |
| C | 7366 | 6041 | 1 | 1 | 0.01% | 0.02% | 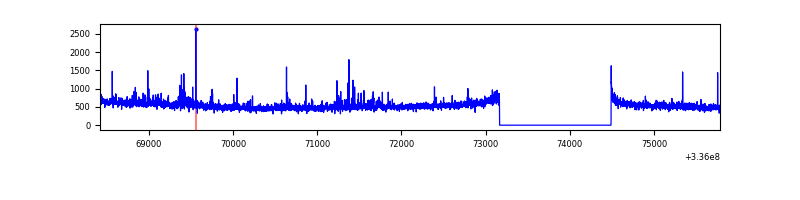 |
| D | 7365 | 6041 | 295 | 295 | 4.01% | 4.88% | 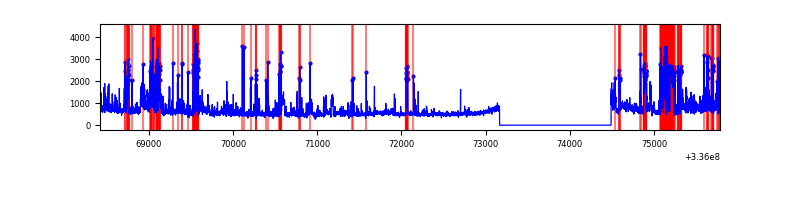 |
Top three noisy pixels from each quadrant. If the there are fewer than three noisy pixels in the level2.evt file, extra rows are filled as -1
| Pixel properties | Quadrant properties | ||||||
|---|---|---|---|---|---|---|---|
| Quadrant | DetID | PixID | Counts | Sigma | Mean | Median | Sigma |
| A | 0 | 13 | 603091 | 3855.8 | 798 | 785 | 156.2 |
| A | 5 | 168 | 11936 | 71.39 | 798 | 785 | 156.2 |
| A | 13 | 254 | 10224 | 60.43 | 798 | 785 | 156.2 |
| B | 3 | 64 | 652617 | 4534.96 | 791 | 776 | 143.7 |
| B | 5 | 172 | 182778 | 1266.22 | 791 | 776 | 143.7 |
| B | 3 | 112 | 30471 | 206.59 | 791 | 776 | 143.7 |
| C | 3 | 233 | 167209 | 963.42 | 759 | 766 | 172.8 |
| C | 14 | 238 | 125636 | 722.79 | 759 | 766 | 172.8 |
| C | 14 | 225 | 14699 | 80.65 | 759 | 766 | 172.8 |
| D | 1 | 52 | 1354481 | 7507.03 | 753 | 737 | 180.3 |
| D | 2 | 250 | 189548 | 1047.03 | 753 | 737 | 180.3 |
| D | 7 | 80 | 179207 | 989.68 | 753 | 737 | 180.3 |
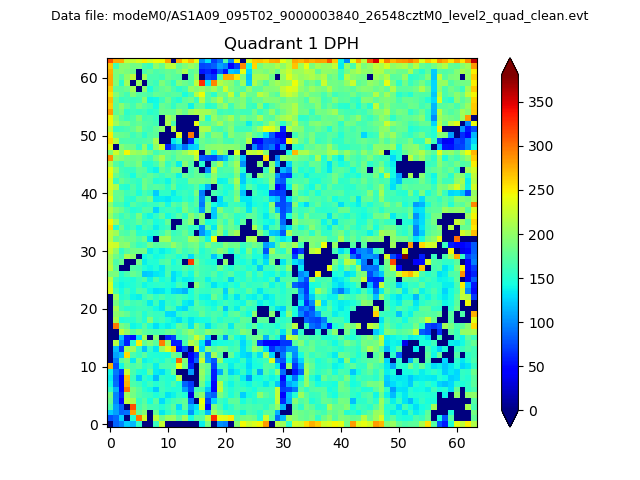
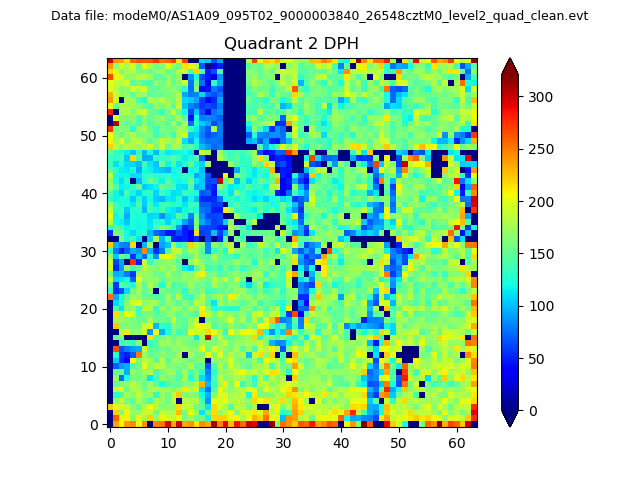
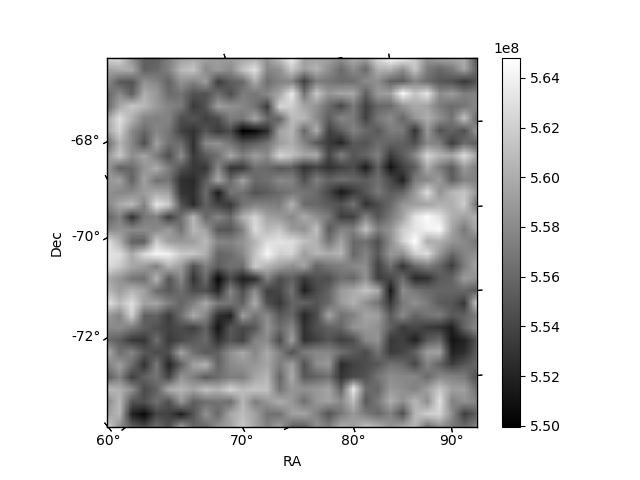
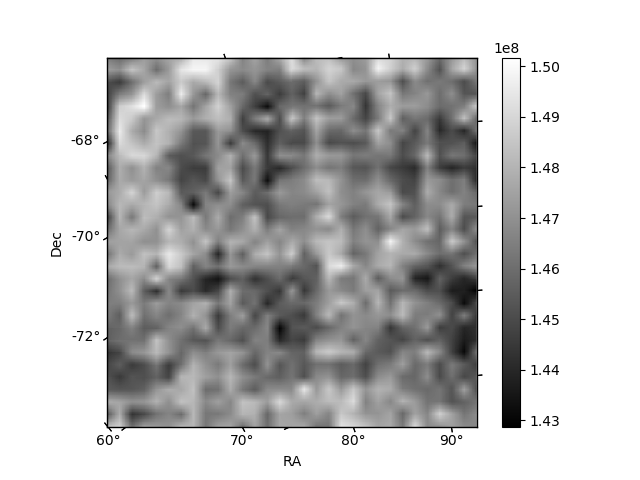
Histogram calculated using DETX and DETY for each event in the final _common_clean file
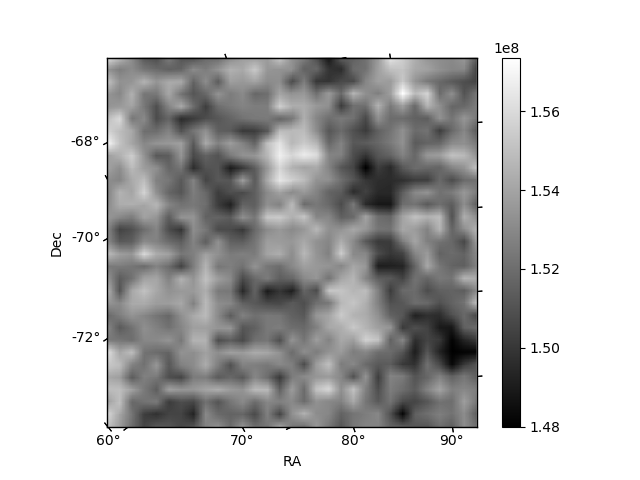
| Quadrant A |  |
 |
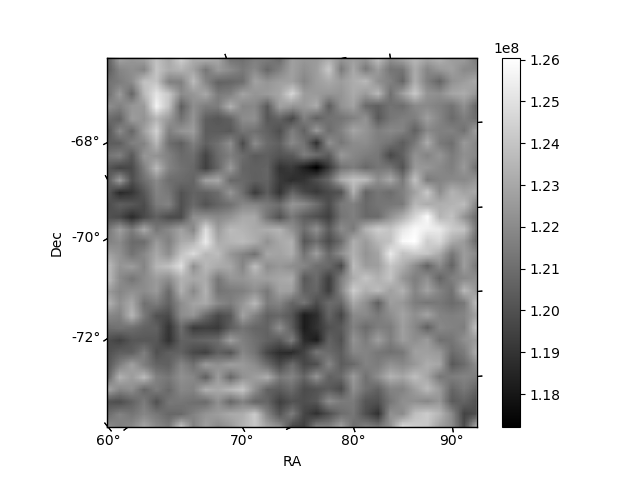
Quadrant B |
|---|---|---|---|
| Quadrant D | 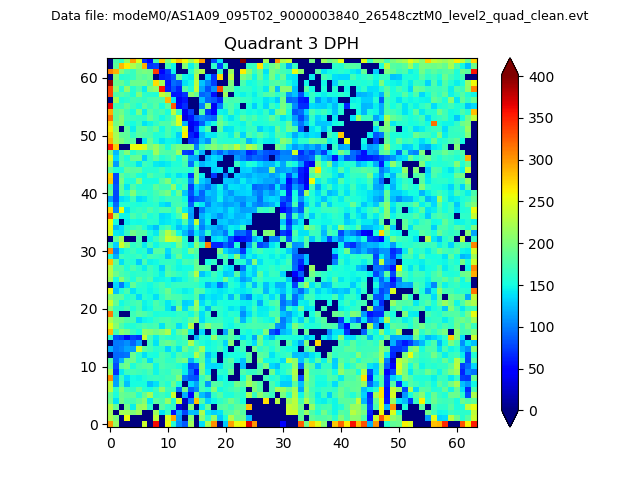 |
 |
Quadrant C |
| Plot type | Count rate plots | Images |
|---|---|---|
| Comparison with Poisson distribution Blue bars denote a histogram of data divided into 1 sec bins. Red curve is a Poisson curve with rate = median count rate of data. |
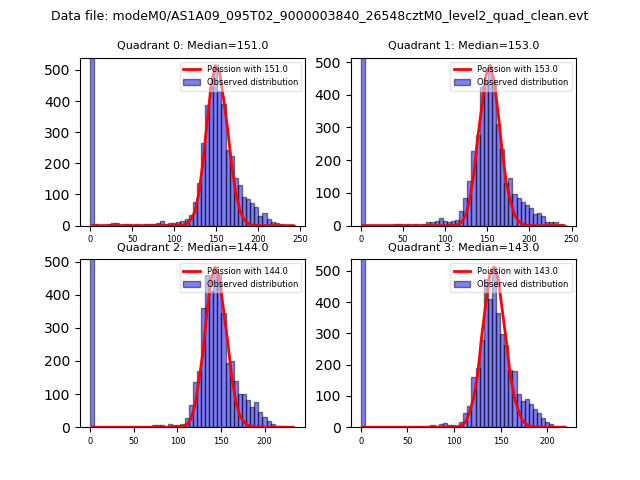 |
 |
| Quadrant-wise count rates Data is divided into 100 sec bins |
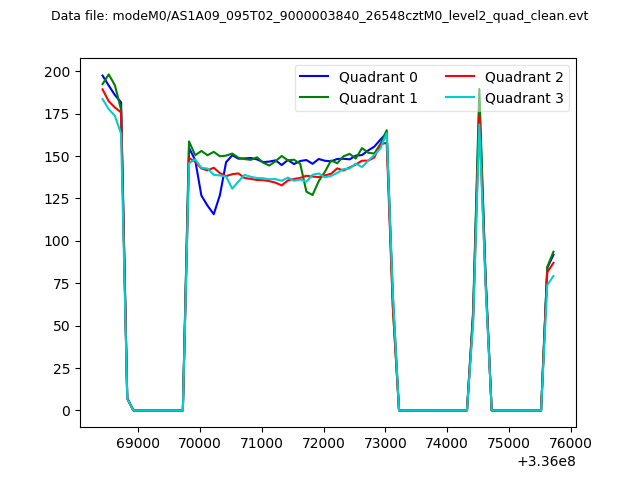 |
|
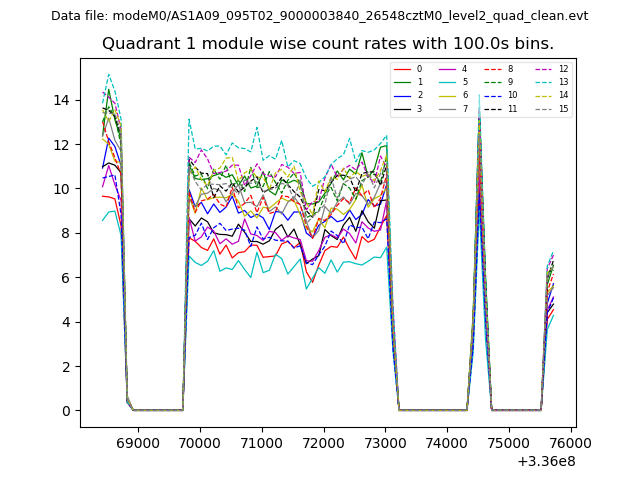
| Module-wise count rates for Quadrant A Data is divided into 100 sec bins |
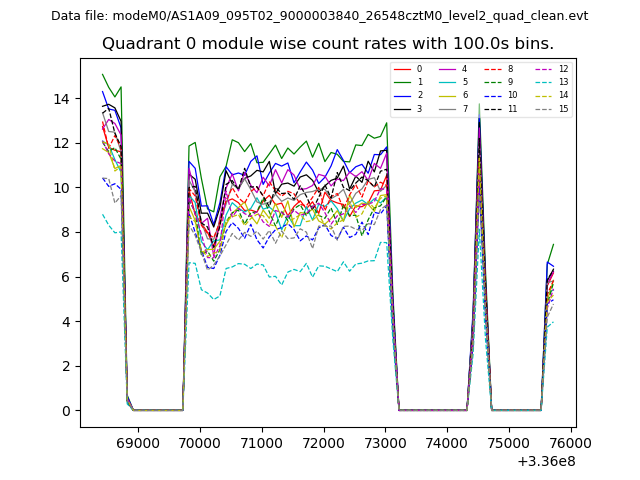 |
 |
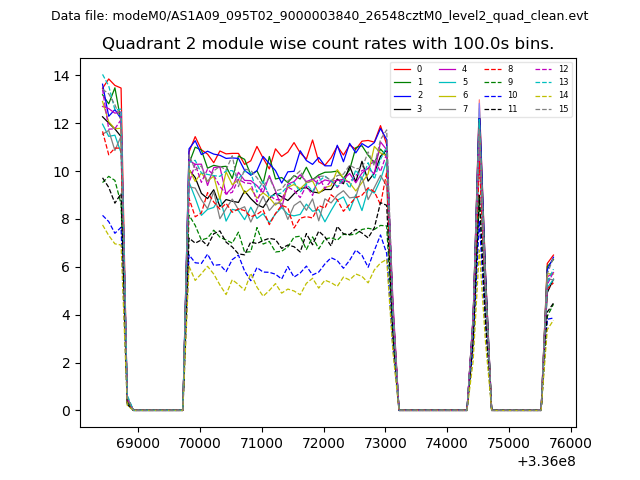
| Module-wise count rates for Quadrant B Data is divided into 100 sec bins |
 |
 |
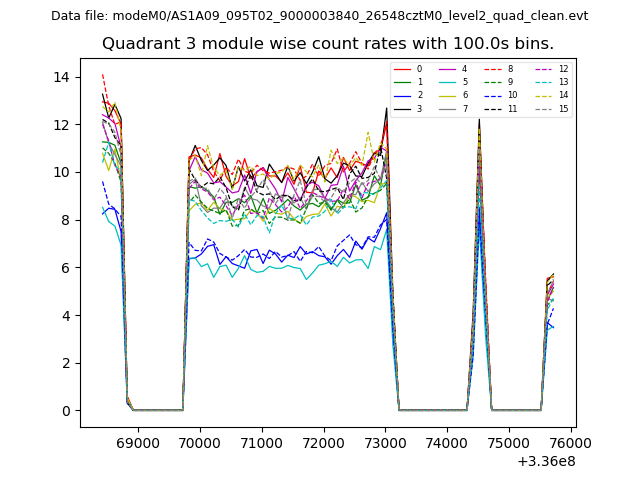
| Module-wise count rates for Quadrant C Data is divided into 100 sec bins |
 |
 |
| Module-wise count rates for Quadrant D Data is divided into 100 sec bins |
 |
 |
| Parameter | Plot |
|---|---|
| CZT HV Monitor | 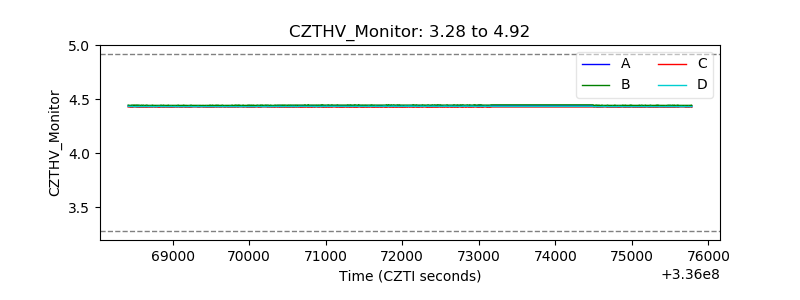 |
| D_VDD | 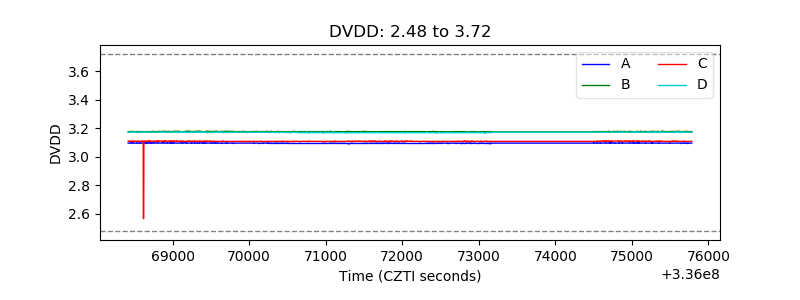 |
| Temperature 1 | 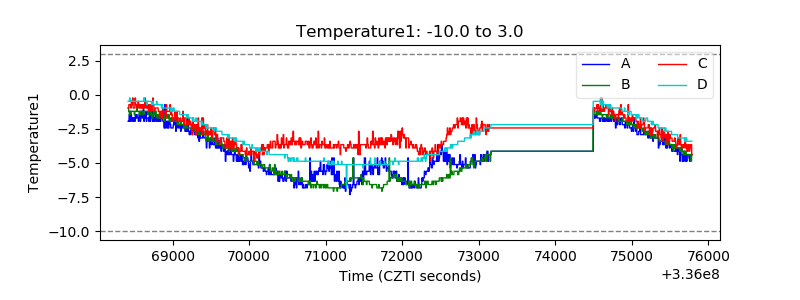 |
| Veto HV Monitor | 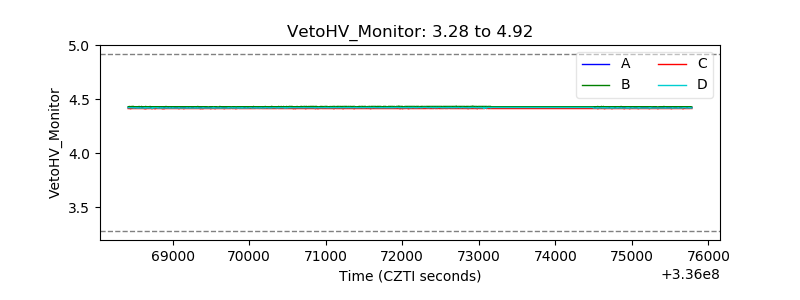 |
| Veto LLD | 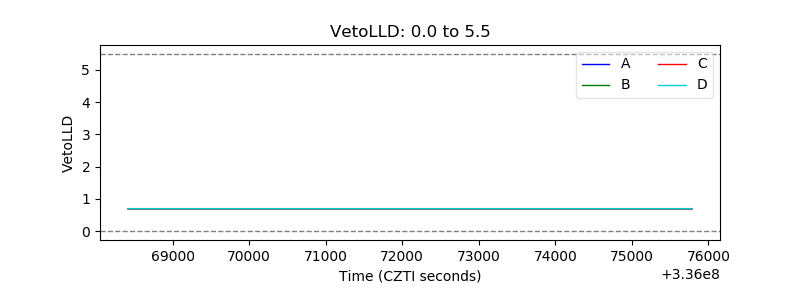 |
| Alpha Counter | 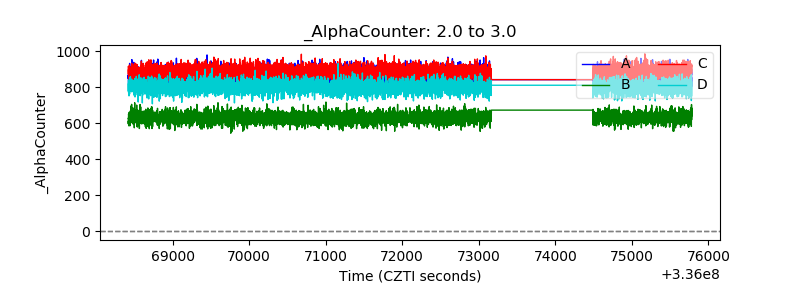 |
| _CPM_Rate | 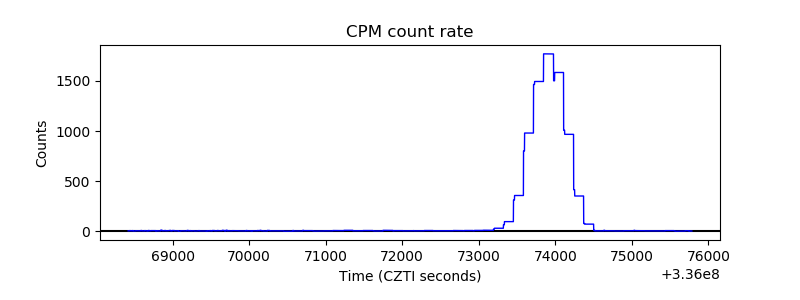 |
| CZT Counter | 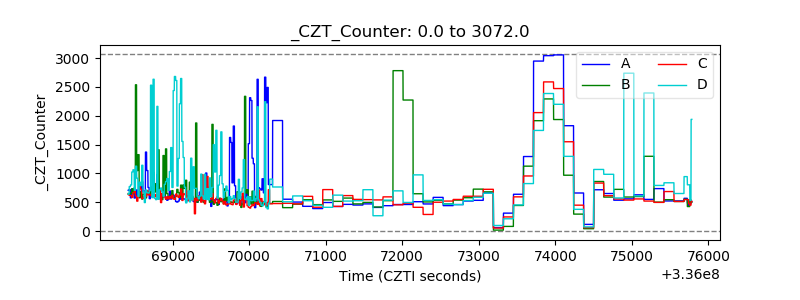 |
| +2.5 Volts monitor | 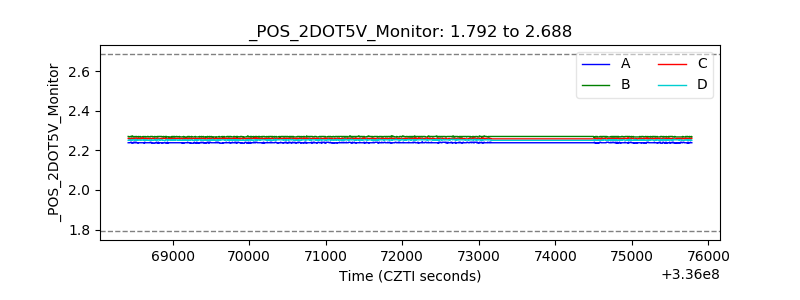 |
| +5 Volts monitor | 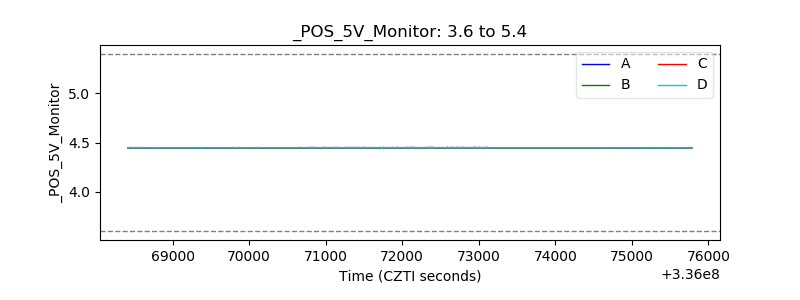 |
| _ROLL_ROT |  |
| _Roll_DEC | 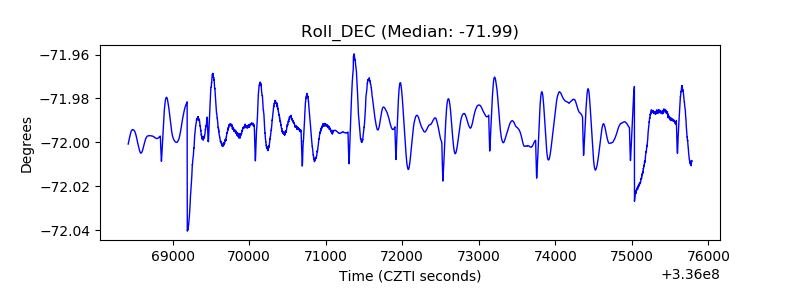 |
| _Roll_RA | 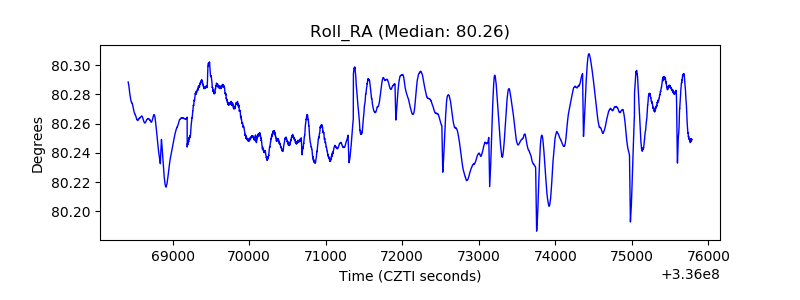 |
| Veto Counter | 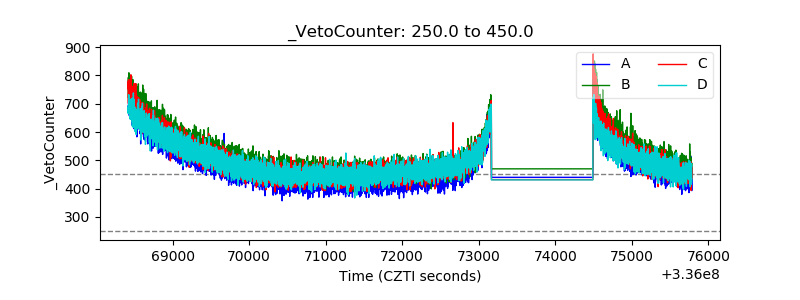 |