| Param | Original file | Final file |
|---|---|---|
| Filename | modeM0/AS1A09_095T02_9000003840_26549cztM0_level2.evt | modeM0/AS1A09_095T02_9000003840_26549cztM0_level2_quad_clean.evt |
| Size (bytes) | 539,709,120 | 100,618,560 |
| Size | 514.7 MB | 96.0 MB |
| Events in quadrant A | 3,233,371 | 666,922 |
| Events in quadrant B | 3,776,693 | 675,991 |
| Events in quadrant C | 3,219,913 | 639,465 |
| Events in quadrant D | 5,679,002 | 615,804 |
| Mode M9 | |||
|---|---|---|---|
| Quadrant | BADHDUFLAG | Total packets | Discarded packets |
| A | 0 | 13 | 0 |
| B | 0 | 14 | 0 |
| C | 0 | 14 | 0 |
| D | 0 | 14 | 0 |
| Mode M0 | |||
|---|---|---|---|
| Quadrant | BADHDUFLAG | Total packets | Discarded packets |
| A | 0 | 13480 | 0 |
| B | 0 | 15258 | 0 |
| C | 0 | 13441 | 0 |
| D | 0 | 21368 | 0 |
| Quadrant | Total seconds | Saturated seconds | Saturation percentage |
|---|---|---|---|
| A | 6438 | 34 | 0.528114% |
| B | 6438 | 87 | 1.351351% |
| C | 6438 | 62 | 0.963032% |
| D | 6438 | 530 | 8.232370% |
Noise dominated data is calculated using 1-second bins in cleaned event files. If a bin has >2000 counts, and if more than 50% of those come from <1% of pixels, then it is considered to be noise-dominated and hence unusable.
| Quadrant | # 1 sec bins | Bins with >0 counts | Bins with >2000 counts | High rate bins dominated by noise | Noise dominated (total time) | Noise dominated (detector-on time) | Marked lightcurve |
|---|---|---|---|---|---|---|---|
| A | 7563 | 6439 | 3 | 3 | 0.04% | 0.05% | 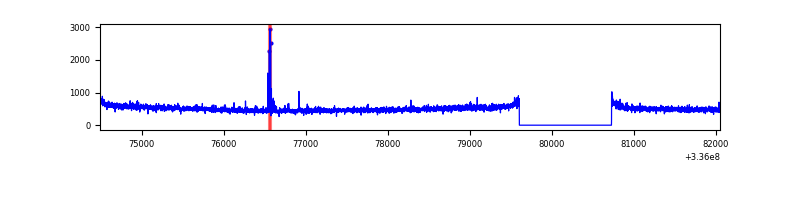 |
| B | 7563 | 6439 | 27 | 27 | 0.36% | 0.42% | 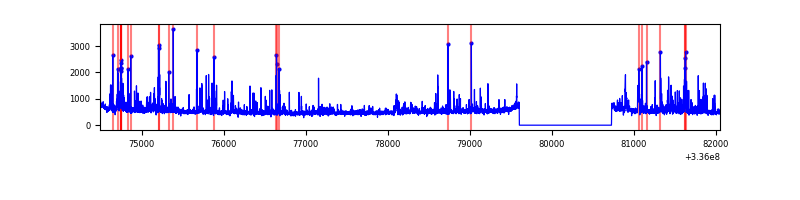 |
| C | 7563 | 6439 | 1 | 1 | 0.01% | 0.02% | 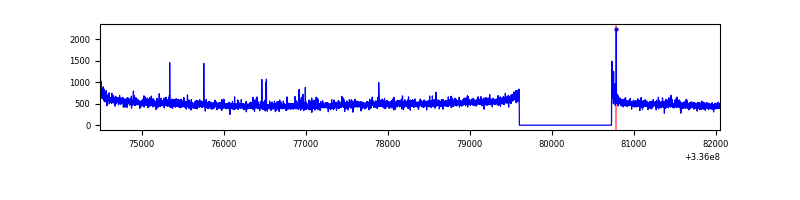 |
| D | 7563 | 6439 | 402 | 402 | 5.32% | 6.24% | 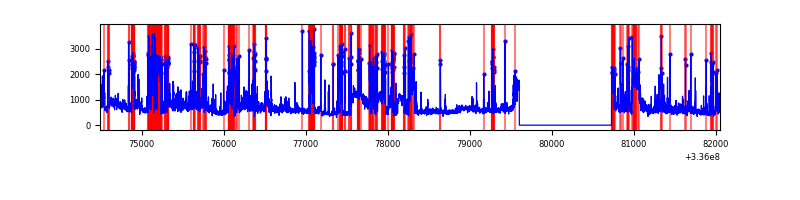 |
Top three noisy pixels from each quadrant. If the there are fewer than three noisy pixels in the level2.evt file, extra rows are filled as -1
| Pixel properties | Quadrant properties | ||||||
|---|---|---|---|---|---|---|---|
| Quadrant | DetID | PixID | Counts | Sigma | Mean | Median | Sigma |
| A | 0 | 13 | 47601 | 292.11 | 815 | 798 | 160.2 |
| A | 5 | 168 | 45018 | 275.99 | 815 | 798 | 160.2 |
| A | 13 | 254 | 10885 | 62.96 | 815 | 798 | 160.2 |
| B | 3 | 64 | 411882 | 2754.84 | 811 | 793 | 149.2 |
| B | 5 | 172 | 135279 | 901.23 | 811 | 793 | 149.2 |
| B | 3 | 112 | 34919 | 228.69 | 811 | 793 | 149.2 |
| C | 14 | 238 | 126845 | 709.37 | 774 | 781 | 177.7 |
| C | 3 | 233 | 55703 | 309.05 | 774 | 781 | 177.7 |
| C | 0 | 10 | 7763 | 39.29 | 774 | 781 | 177.7 |
| D | 7 | 80 | 1265537 | 6866.35 | 760 | 742 | 184.2 |
| D | 1 | 52 | 1224406 | 6643.06 | 760 | 742 | 184.2 |
| D | 2 | 250 | 164814 | 890.72 | 760 | 742 | 184.2 |
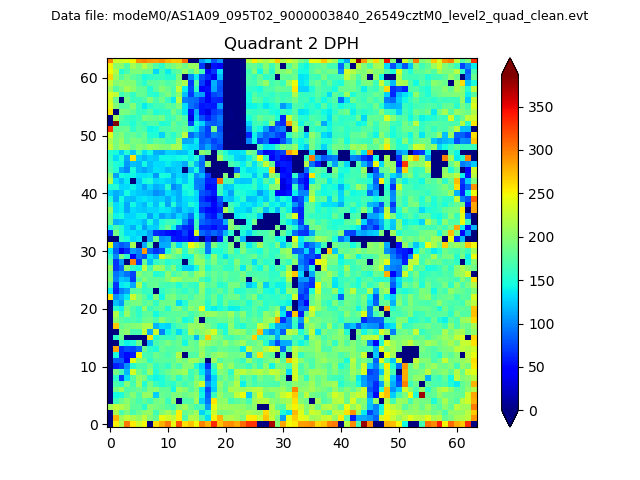
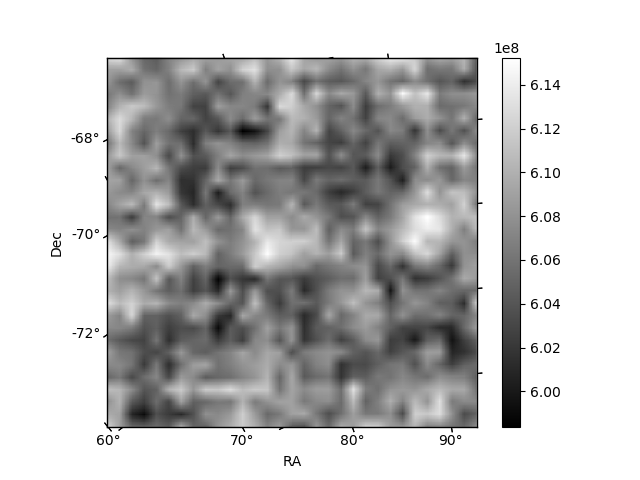
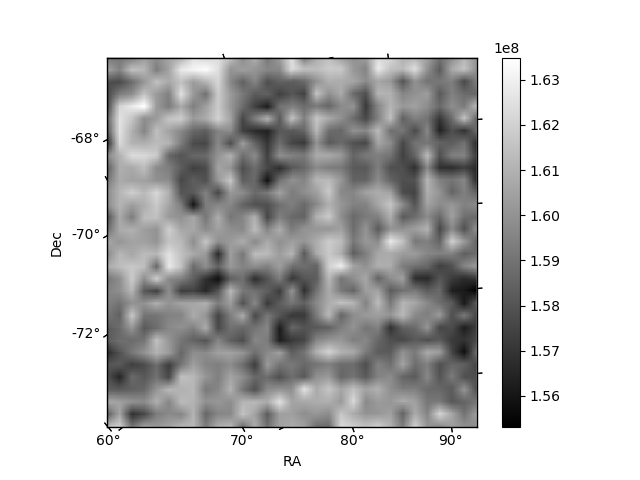
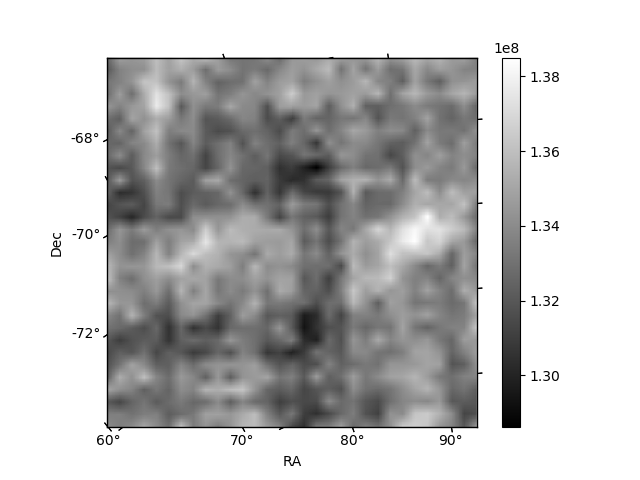
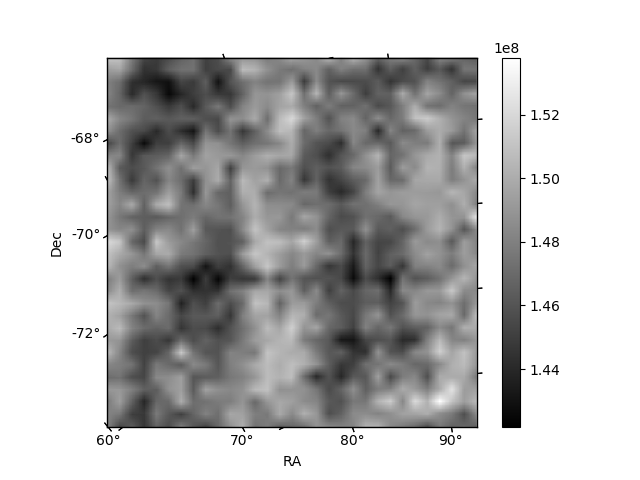
Histogram calculated using DETX and DETY for each event in the final _common_clean file
| Quadrant A | 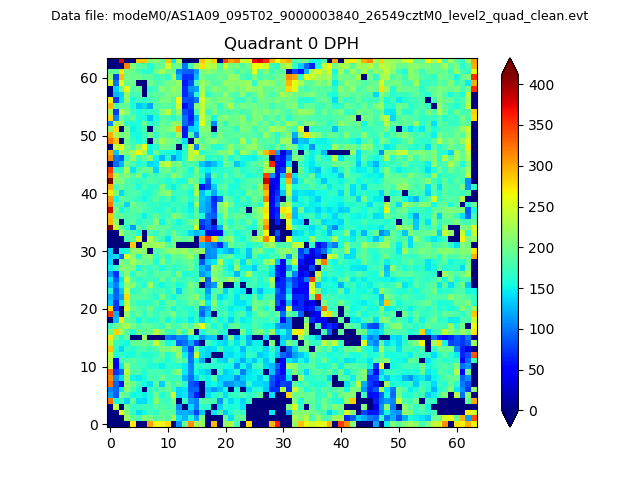 |
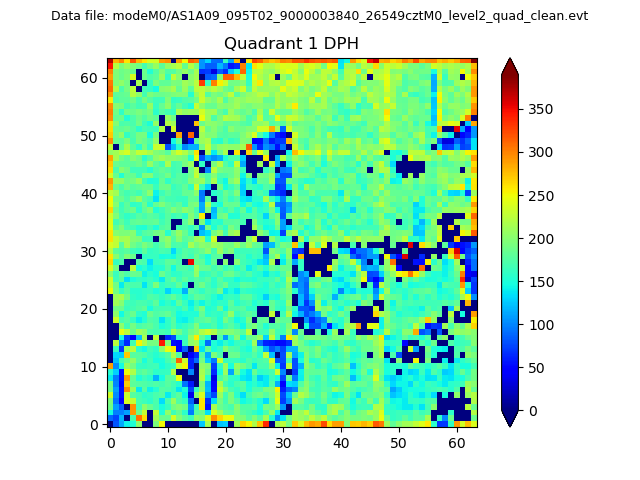 |
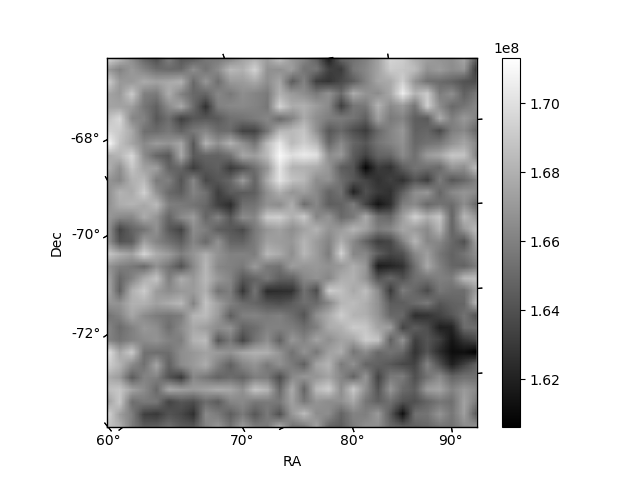
Quadrant B |
|---|---|---|---|
| Quadrant D | 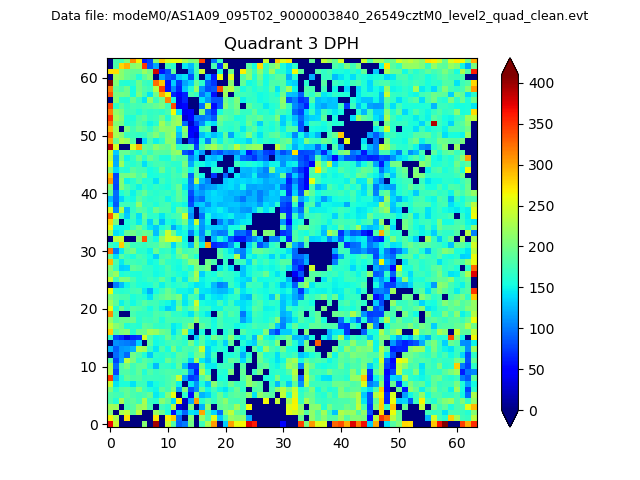 |
 |
Quadrant C |
| Plot type | Count rate plots | Images |
|---|---|---|
| Comparison with Poisson distribution Blue bars denote a histogram of data divided into 1 sec bins. Red curve is a Poisson curve with rate = median count rate of data. |
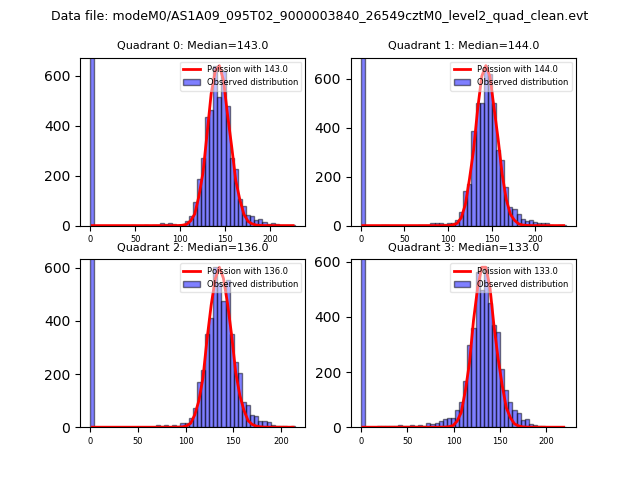 |
 |
| Quadrant-wise count rates Data is divided into 100 sec bins |
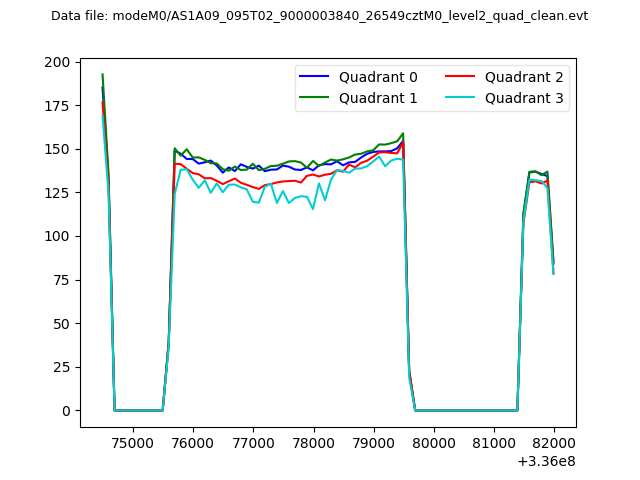 |
|
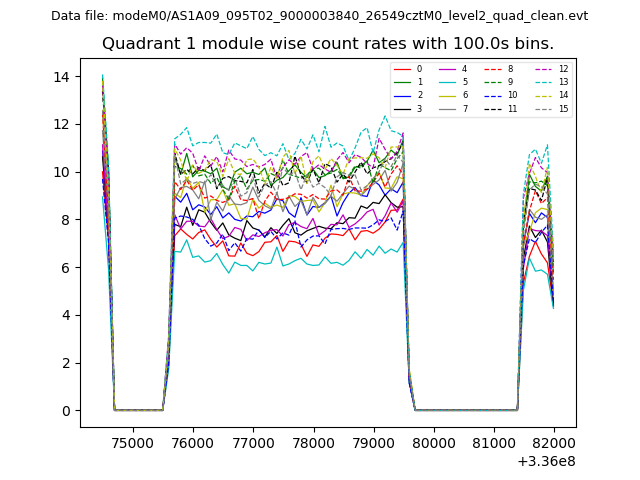
| Module-wise count rates for Quadrant A Data is divided into 100 sec bins |
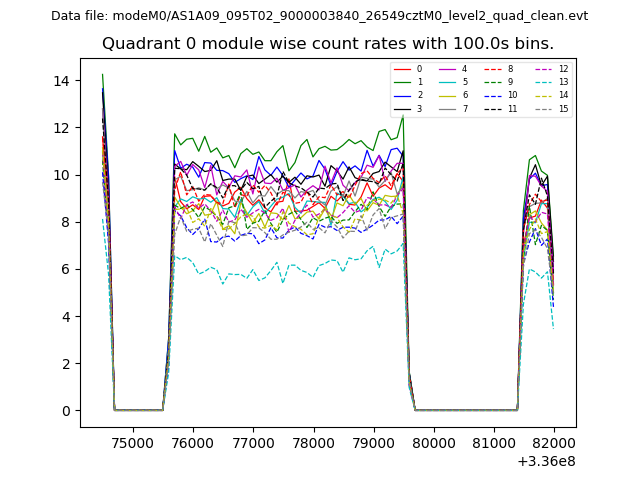 |
 |
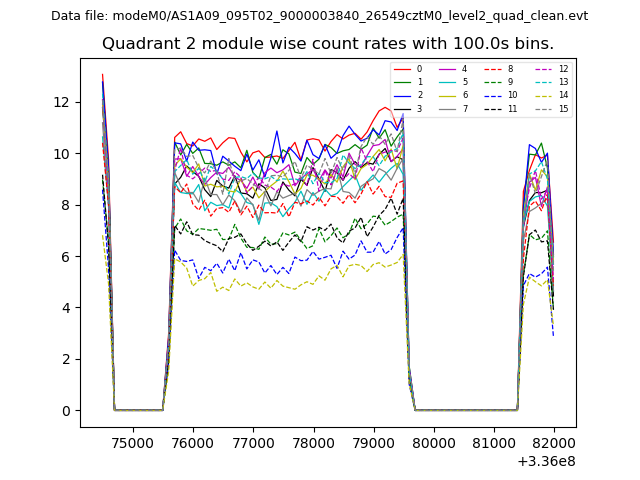
| Module-wise count rates for Quadrant B Data is divided into 100 sec bins |
 |
 |
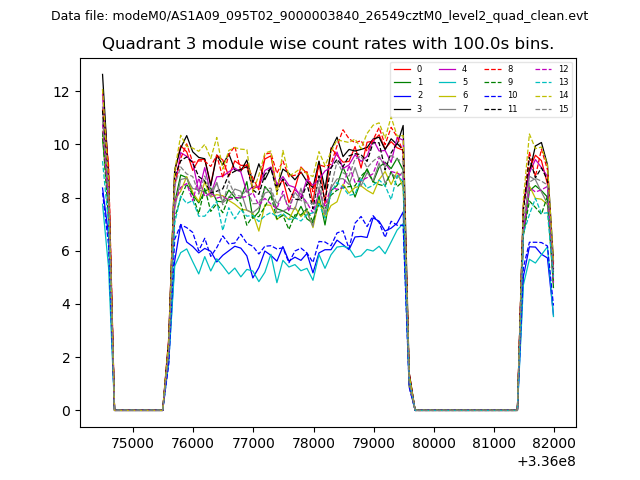
| Module-wise count rates for Quadrant C Data is divided into 100 sec bins |
 |
 |
| Module-wise count rates for Quadrant D Data is divided into 100 sec bins |
 |
 |
| Parameter | Plot |
|---|---|
| CZT HV Monitor | 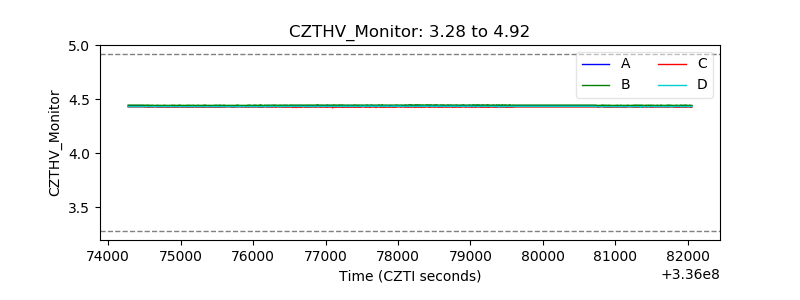 |
| D_VDD | 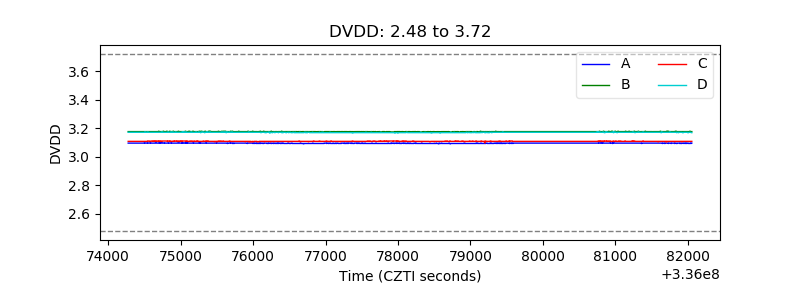 |
| Temperature 1 | 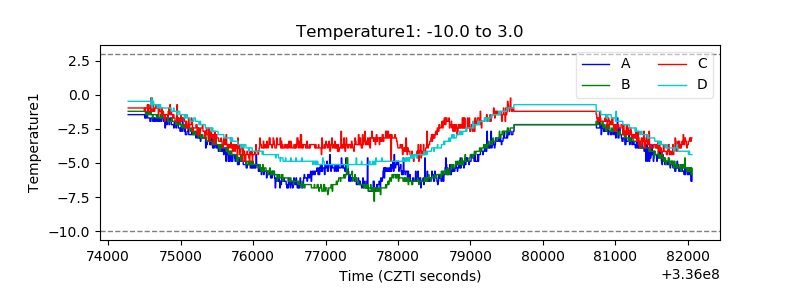 |
| Veto HV Monitor | 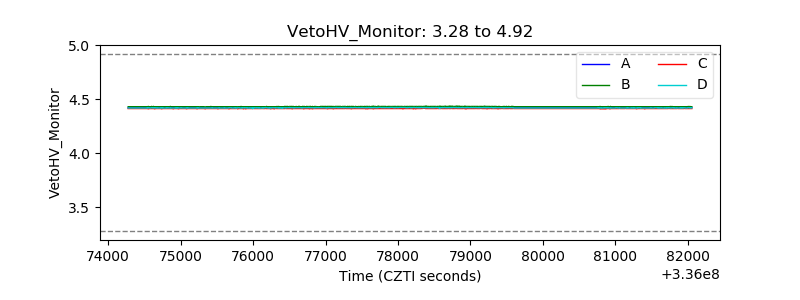 |
| Veto LLD | 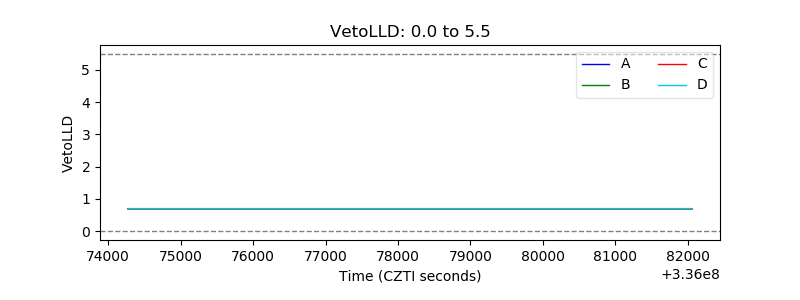 |
| Alpha Counter | 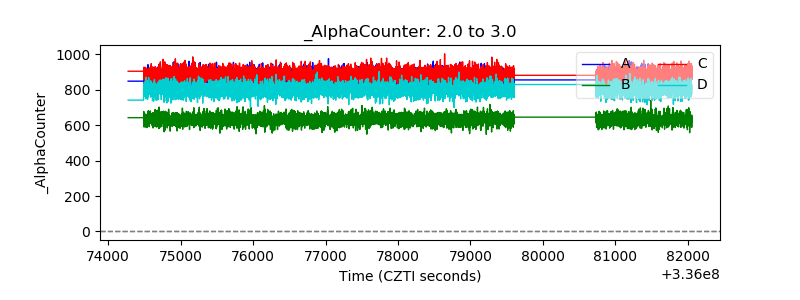 |
| _CPM_Rate | 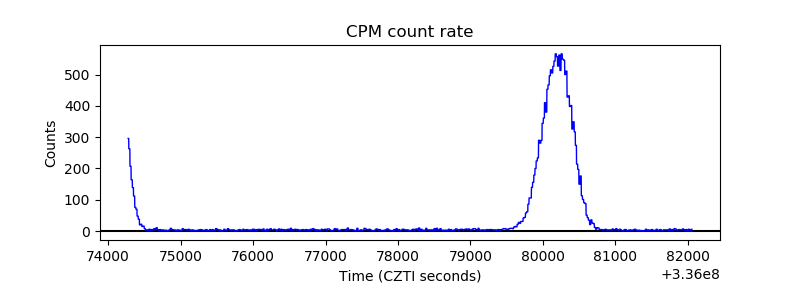 |
| CZT Counter | 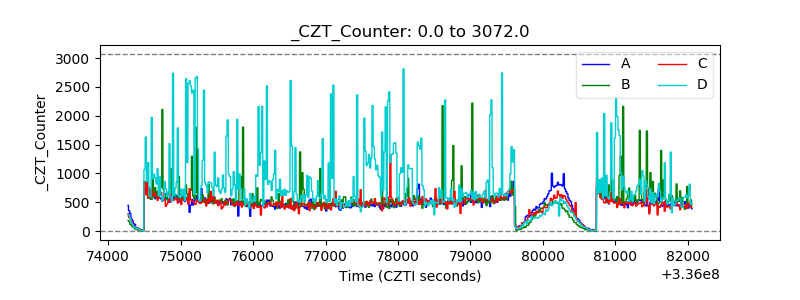 |
| +2.5 Volts monitor | 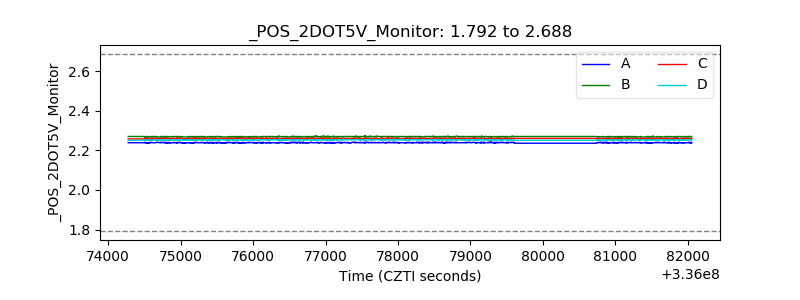 |
| +5 Volts monitor | 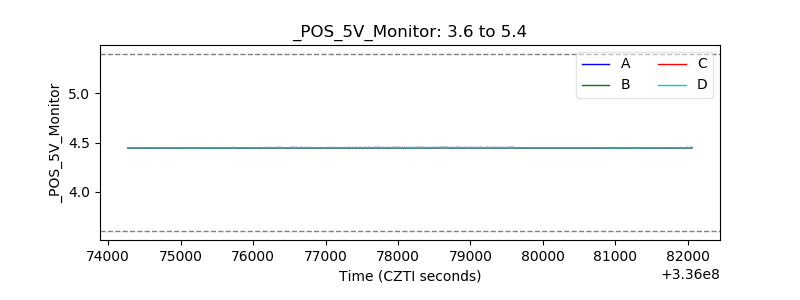 |
| _ROLL_ROT | 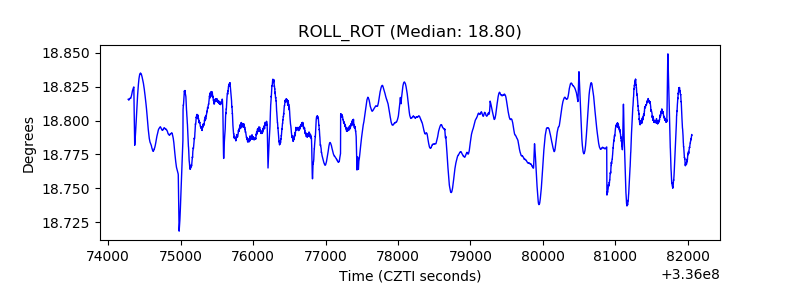 |
| _Roll_DEC |  |
| _Roll_RA | 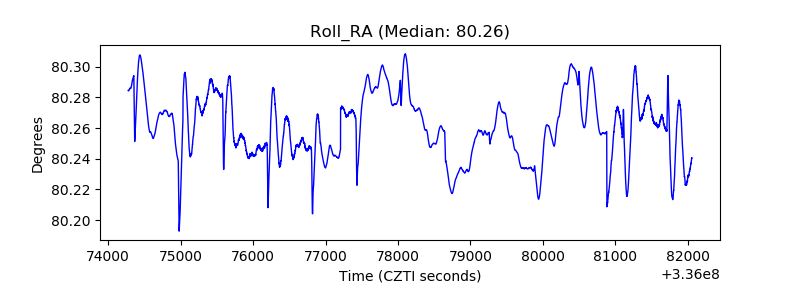 |
| Veto Counter | 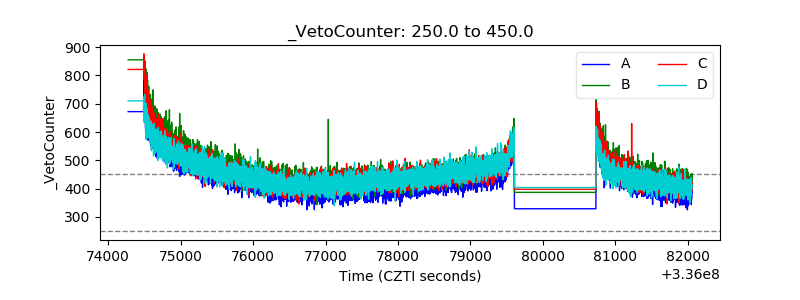 |