| Param | Original file | Final file |
|---|---|---|
| Filename | modeM0/AS1A09_095T02_9000003840_26550cztM0_level2.evt | modeM0/AS1A09_095T02_9000003840_26550cztM0_level2_quad_clean.evt |
| Size (bytes) | 516,896,640 | 114,183,360 |
| Size | 493.0 MB | 108.9 MB |
| Events in quadrant A | 3,381,092 | 758,971 |
| Events in quadrant B | 3,590,167 | 767,512 |
| Events in quadrant C | 3,305,897 | 735,364 |
| Events in quadrant D | 4,914,375 | 721,136 |
| Mode M9 | |||
|---|---|---|---|
| Quadrant | BADHDUFLAG | Total packets | Discarded packets |
| A | 0 | 7 | 0 |
| B | 0 | 7 | 0 |
| C | 0 | 7 | 0 |
| D | 0 | 7 | 0 |
| Mode M0 | |||
|---|---|---|---|
| Quadrant | BADHDUFLAG | Total packets | Discarded packets |
| A | 0 | 14386 | 0 |
| B | 0 | 15000 | 0 |
| C | 0 | 14047 | 0 |
| D | 0 | 19201 | 0 |
| Quadrant | Total seconds | Saturated seconds | Saturation percentage |
|---|---|---|---|
| A | 6820 | 56 | 0.821114% |
| B | 6820 | 121 | 1.774194% |
| C | 6821 | 62 | 0.908958% |
| D | 6820 | 317 | 4.648094% |
Noise dominated data is calculated using 1-second bins in cleaned event files. If a bin has >2000 counts, and if more than 50% of those come from <1% of pixels, then it is considered to be noise-dominated and hence unusable.
| Quadrant | # 1 sec bins | Bins with >0 counts | Bins with >2000 counts | High rate bins dominated by noise | Noise dominated (total time) | Noise dominated (detector-on time) | Marked lightcurve |
|---|---|---|---|---|---|---|---|
| A | 7495 | 6821 | 4 | 4 | 0.05% | 0.06% | 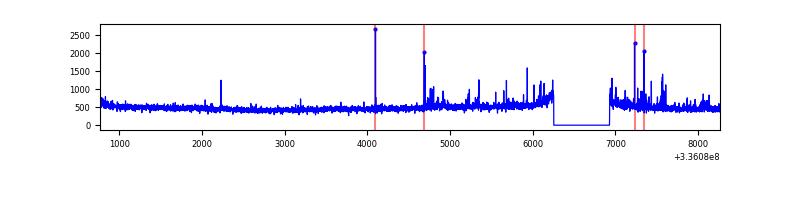 |
| B | 7495 | 6821 | 19 | 19 | 0.25% | 0.28% | 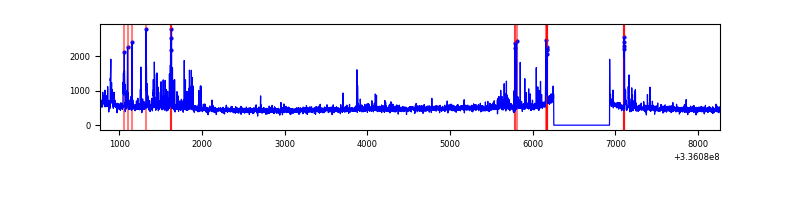 |
| C | 7496 | 6822 | 1 | 1 | 0.01% | 0.01% | 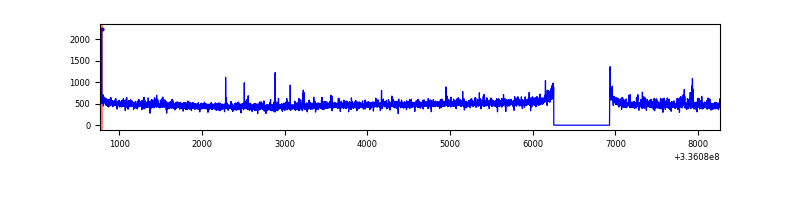 |
| D | 7495 | 6821 | 215 | 215 | 2.87% | 3.15% | 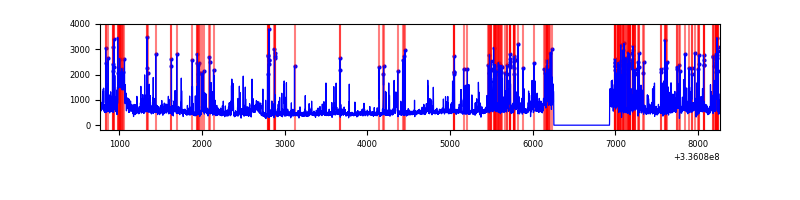 |
Top three noisy pixels from each quadrant. If the there are fewer than three noisy pixels in the level2.evt file, extra rows are filled as -1
| Pixel properties | Quadrant properties | ||||||
|---|---|---|---|---|---|---|---|
| Quadrant | DetID | PixID | Counts | Sigma | Mean | Median | Sigma |
| A | 0 | 13 | 144570 | 872.23 | 830 | 815 | 164.8 |
| A | 5 | 168 | 36514 | 216.6 | 830 | 815 | 164.8 |
| A | 13 | 254 | 11120 | 62.53 | 830 | 815 | 164.8 |
| B | 3 | 64 | 192353 | 1235.34 | 823 | 803 | 155.1 |
| B | 5 | 172 | 134196 | 860.28 | 823 | 803 | 155.1 |
| B | 3 | 112 | 30637 | 192.41 | 823 | 803 | 155.1 |
| C | 14 | 238 | 130606 | 706.36 | 792 | 797 | 183.8 |
| C | 3 | 233 | 80648 | 434.51 | 792 | 797 | 183.8 |
| C | 13 | 61 | 5494 | 25.56 | 792 | 797 | 183.8 |
| D | 1 | 52 | 1452568 | 7671.62 | 788 | 768 | 189.2 |
| D | 2 | 250 | 197871 | 1041.53 | 788 | 768 | 189.2 |
| D | 7 | 80 | 126349 | 663.6 | 788 | 768 | 189.2 |
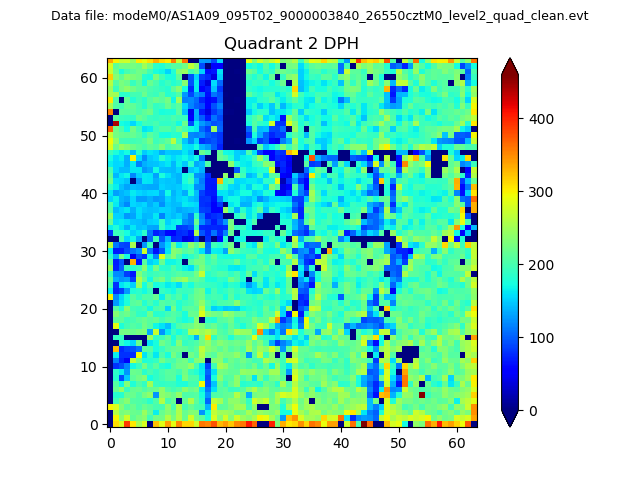
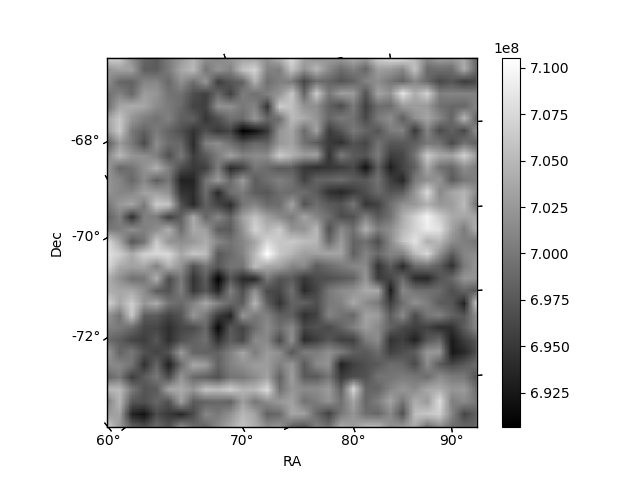
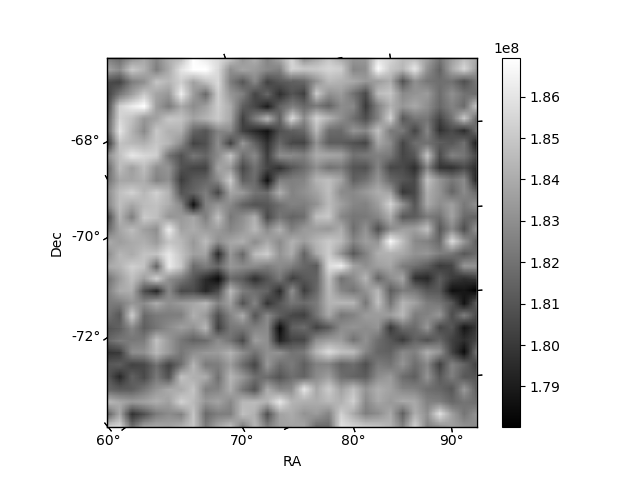
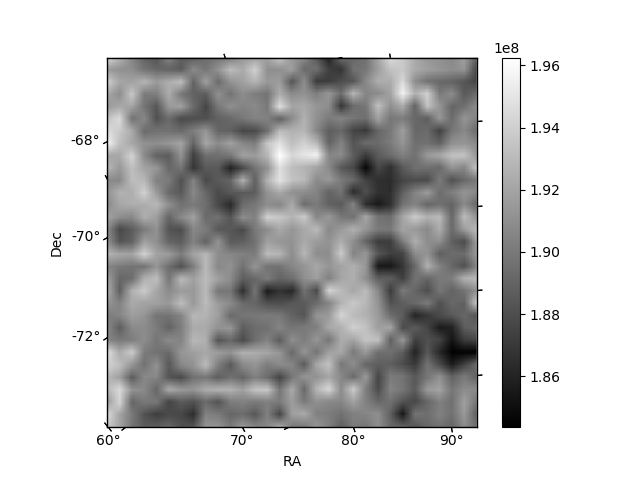
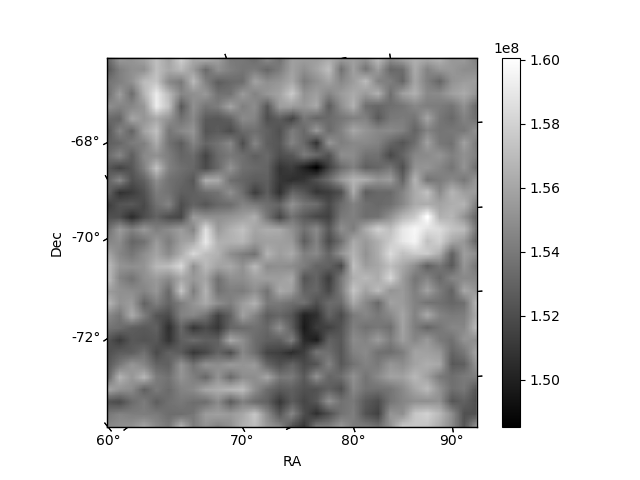
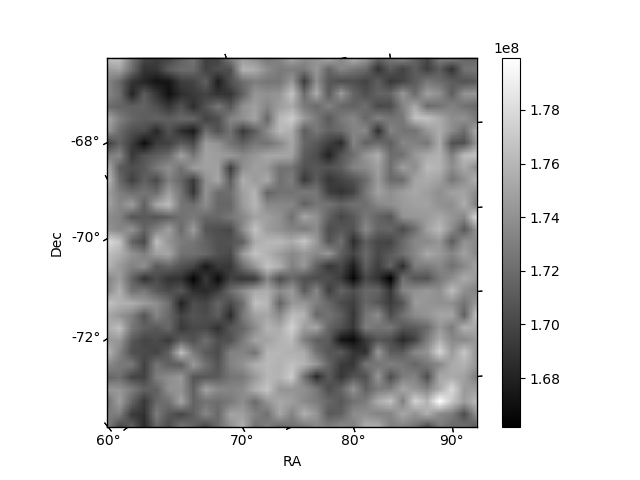
Histogram calculated using DETX and DETY for each event in the final _common_clean file
| Quadrant A | 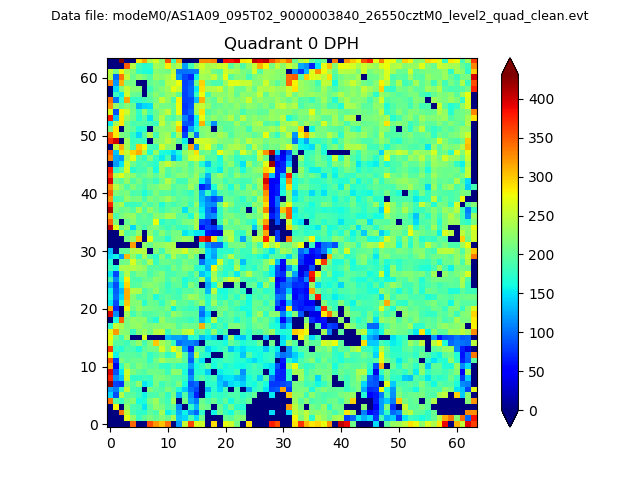 |
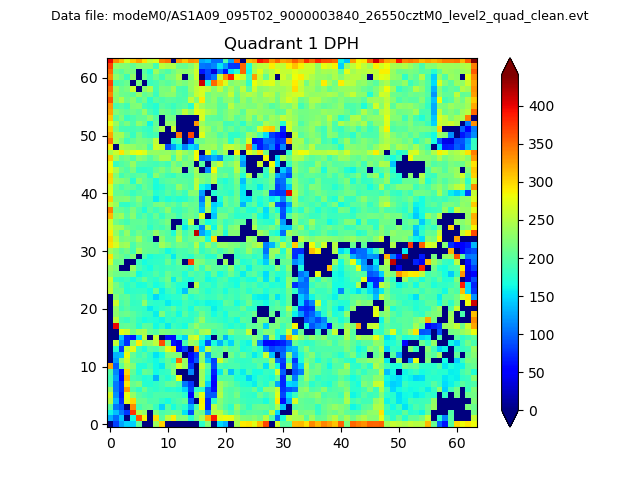 |
Quadrant B |
|---|---|---|---|
| Quadrant D | 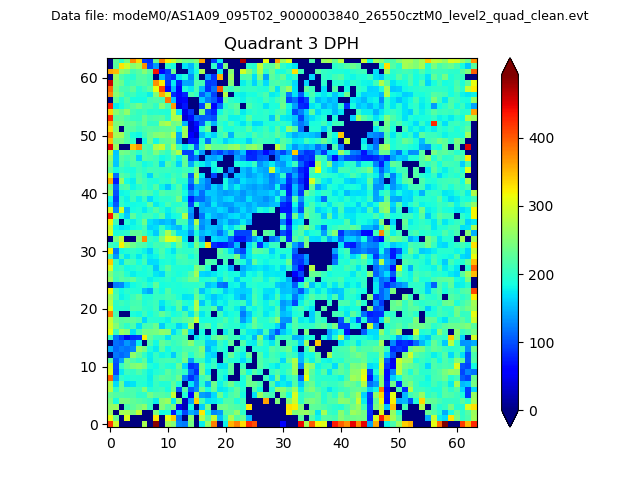 |
 |
Quadrant C |
| Plot type | Count rate plots | Images |
|---|---|---|
| Comparison with Poisson distribution Blue bars denote a histogram of data divided into 1 sec bins. Red curve is a Poisson curve with rate = median count rate of data. |
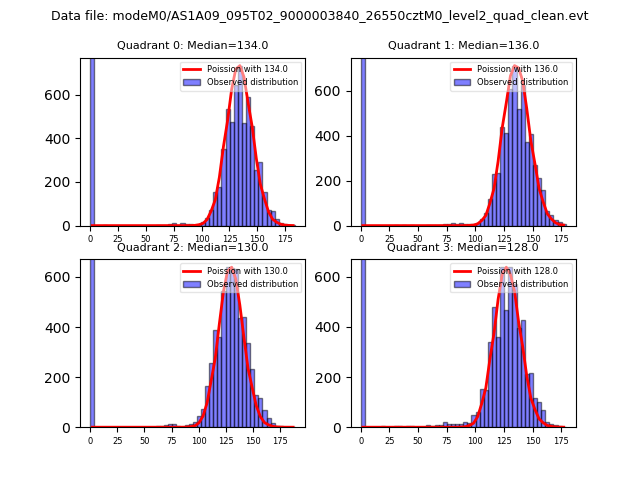 |
 |
| Quadrant-wise count rates Data is divided into 100 sec bins |
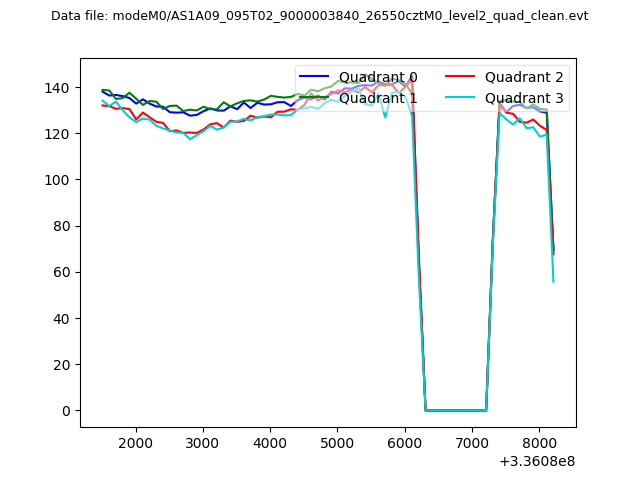 |
|
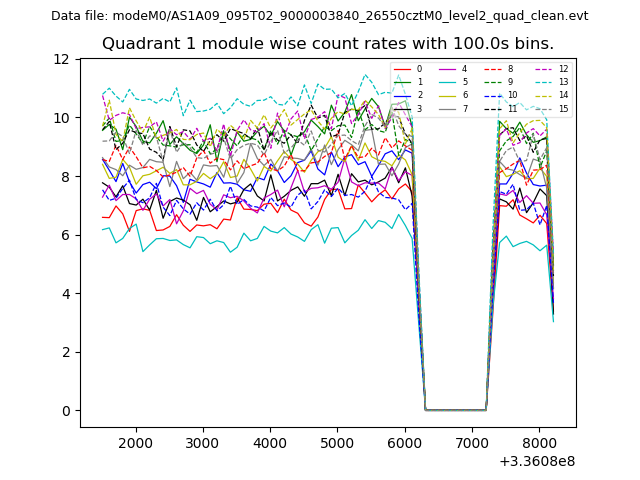
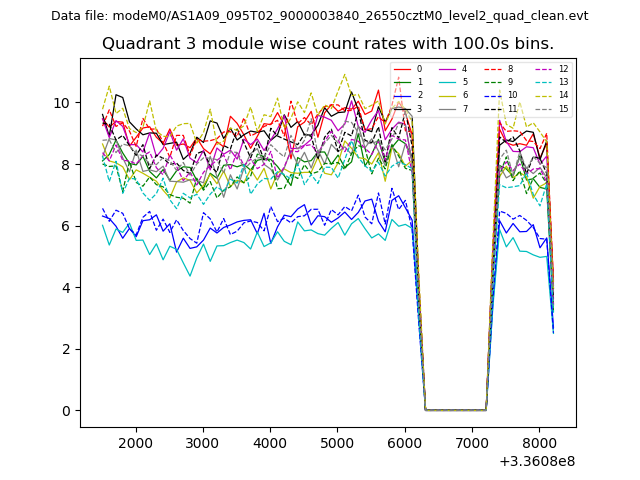
| Module-wise count rates for Quadrant A Data is divided into 100 sec bins |
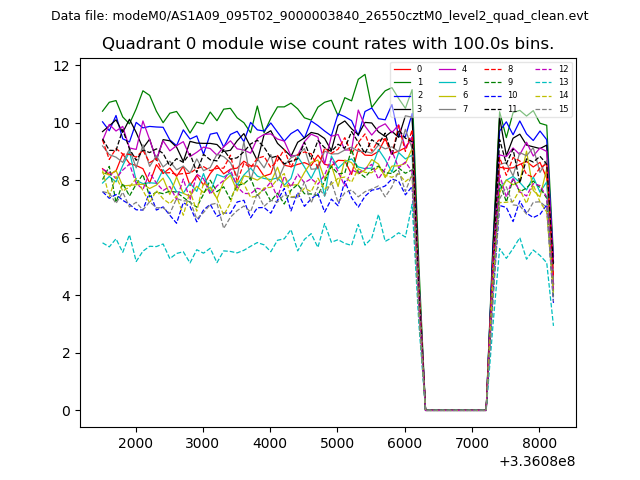 |
 |
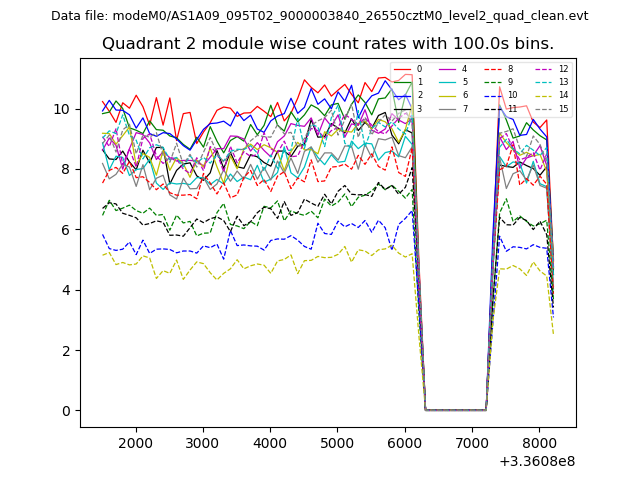
| Module-wise count rates for Quadrant B Data is divided into 100 sec bins |
 |
 |
| Module-wise count rates for Quadrant C Data is divided into 100 sec bins |
 |
 |
| Module-wise count rates for Quadrant D Data is divided into 100 sec bins |
 |
 |
| Parameter | Plot |
|---|---|
| CZT HV Monitor | 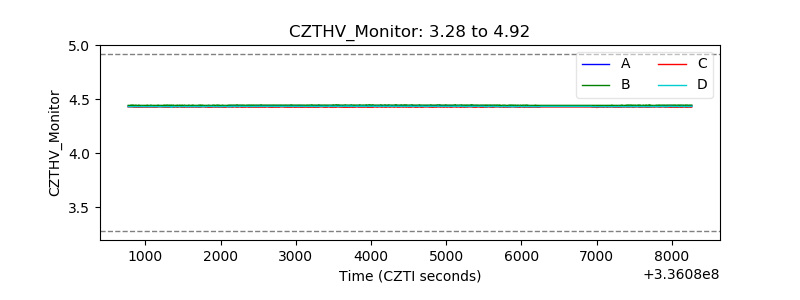 |
| D_VDD | 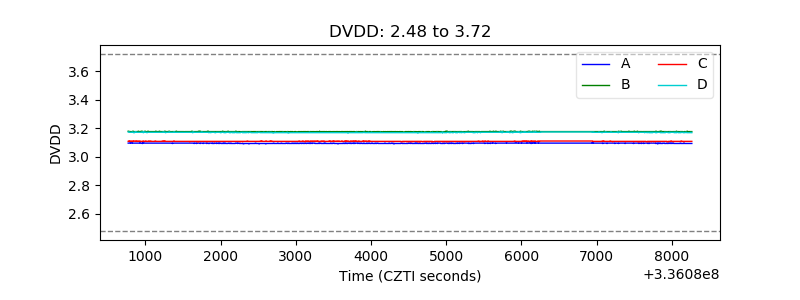 |
| Temperature 1 | 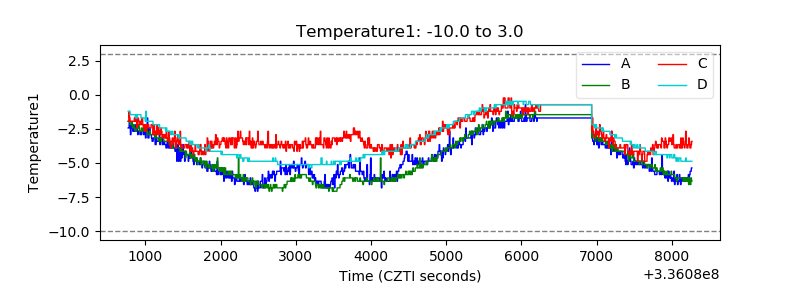 |
| Veto HV Monitor | 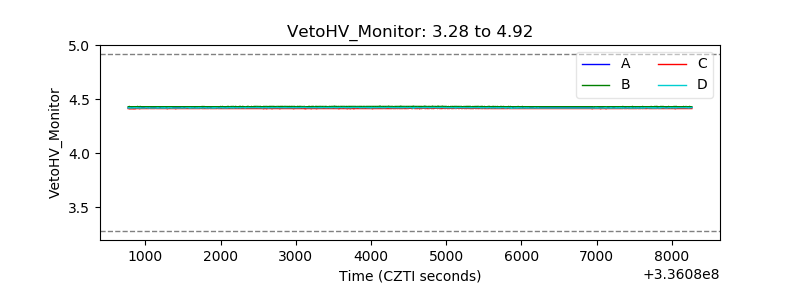 |
| Veto LLD | 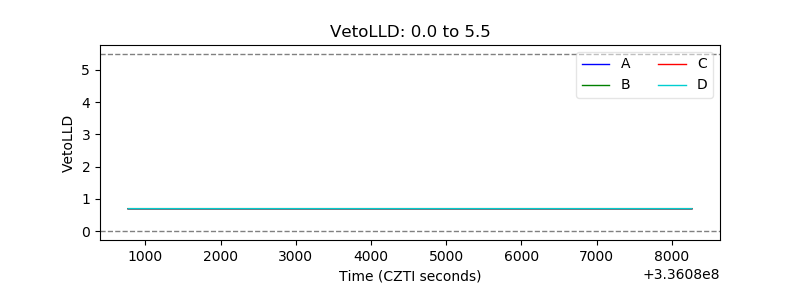 |
| Alpha Counter | 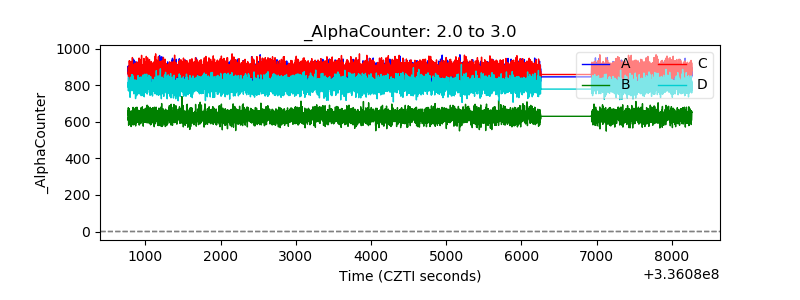 |
| _CPM_Rate | 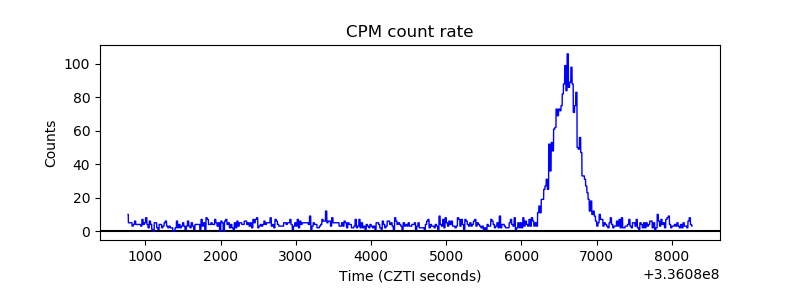 |
| CZT Counter | 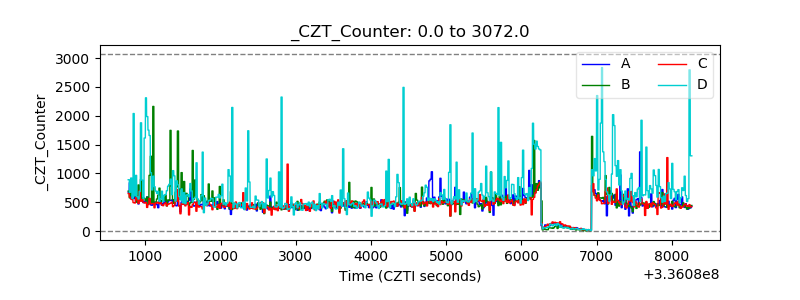 |
| +2.5 Volts monitor |  |
| +5 Volts monitor |  |
| _ROLL_ROT | 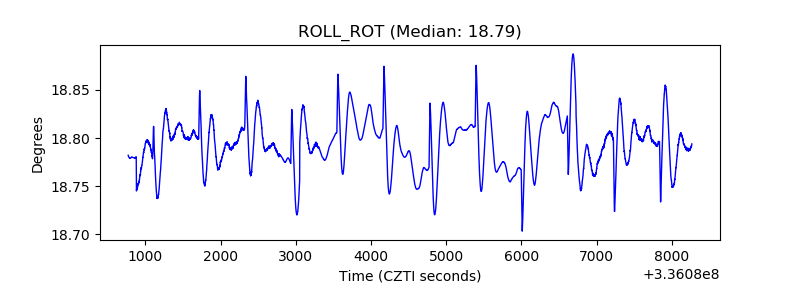 |
| _Roll_DEC | 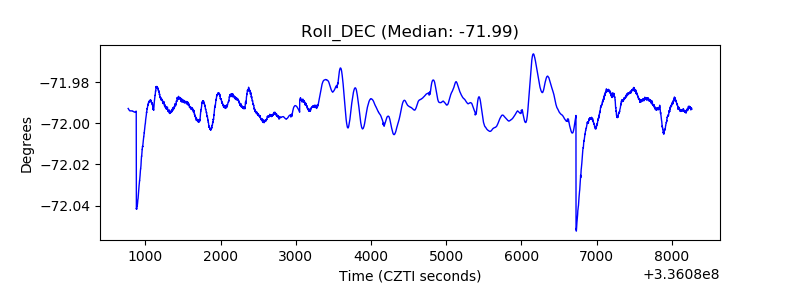 |
| _Roll_RA | 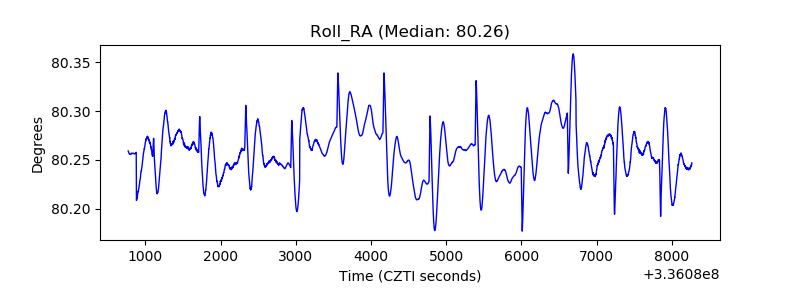 |
| Veto Counter | 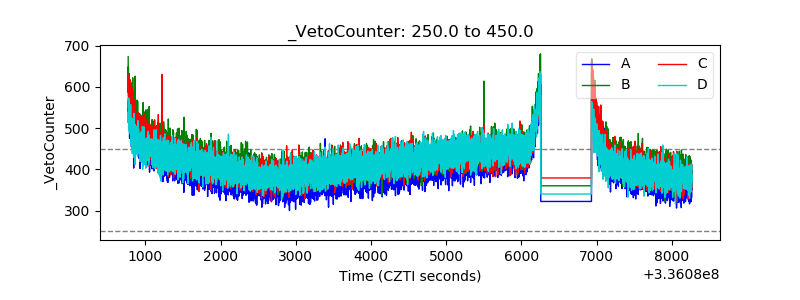 |