| Param | Original file | Final file |
|---|---|---|
| Filename | modeM0/AS1A09_095T02_9000003840_26551cztM0_level2.evt | modeM0/AS1A09_095T02_9000003840_26551cztM0_level2_quad_clean.evt |
| Size (bytes) | 575,677,440 | 124,729,920 |
| Size | 549.0 MB | 119.0 MB |
| Events in quadrant A | 3,776,122 | 830,655 |
| Events in quadrant B | 4,015,931 | 834,623 |
| Events in quadrant C | 3,736,045 | 806,078 |
| Events in quadrant D | 5,393,611 | 780,474 |
| Mode M9 | |||
|---|---|---|---|
| Quadrant | BADHDUFLAG | Total packets | Discarded packets |
| A | 0 | 10 | 0 |
| B | 0 | 10 | 0 |
| C | 0 | 10 | 0 |
| D | 0 | 10 | 0 |
| Mode M0 | |||
|---|---|---|---|
| Quadrant | BADHDUFLAG | Total packets | Discarded packets |
| A | 0 | 16142 | 0 |
| B | 0 | 16895 | 0 |
| C | 0 | 15888 | 0 |
| D | 0 | 21165 | 0 |
| Quadrant | Total seconds | Saturated seconds | Saturation percentage |
|---|---|---|---|
| A | 7561 | 117 | 1.547414% |
| B | 7562 | 247 | 3.266332% |
| C | 7562 | 157 | 2.076170% |
| D | 7561 | 519 | 6.864171% |
Noise dominated data is calculated using 1-second bins in cleaned event files. If a bin has >2000 counts, and if more than 50% of those come from <1% of pixels, then it is considered to be noise-dominated and hence unusable.
| Quadrant | # 1 sec bins | Bins with >0 counts | Bins with >2000 counts | High rate bins dominated by noise | Noise dominated (total time) | Noise dominated (detector-on time) | Marked lightcurve |
|---|---|---|---|---|---|---|---|
| A | 8511 | 7563 | 8 | 8 | 0.09% | 0.11% | 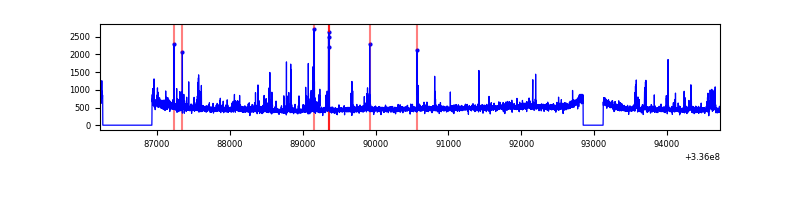 |
| B | 8512 | 7563 | 84 | 84 | 0.99% | 1.11% | 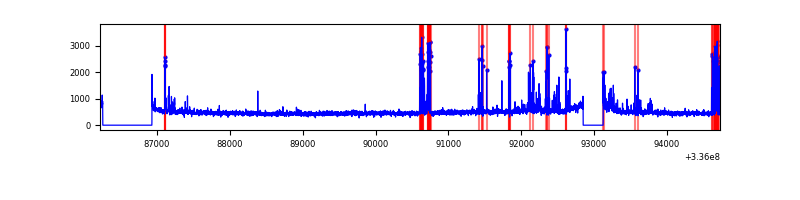 |
| C | 8512 | 7564 | 0 | 0 | 0.00% | 0.00% | 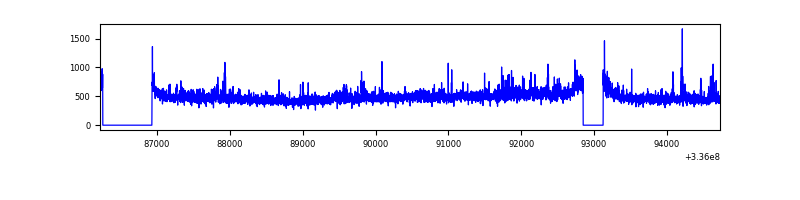 |
| D | 8511 | 7562 | 351 | 351 | 4.12% | 4.64% | 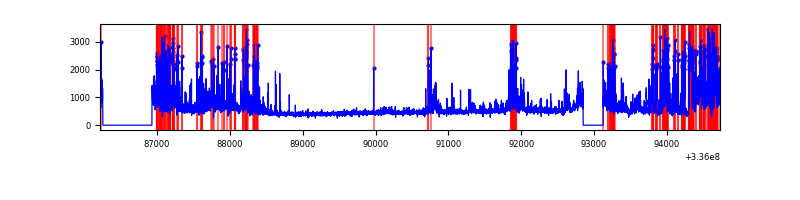 |
Top three noisy pixels from each quadrant. If the there are fewer than three noisy pixels in the level2.evt file, extra rows are filled as -1
| Pixel properties | Quadrant properties | ||||||
|---|---|---|---|---|---|---|---|
| Quadrant | DetID | PixID | Counts | Sigma | Mean | Median | Sigma |
| A | 0 | 13 | 247928 | 1356.04 | 910 | 893 | 182.2 |
| A | 5 | 168 | 21369 | 112.4 | 910 | 893 | 182.2 |
| A | 13 | 254 | 12081 | 61.41 | 910 | 893 | 182.2 |
| B | 3 | 64 | 333250 | 1937.78 | 903 | 880 | 171.5 |
| B | 5 | 172 | 109161 | 631.3 | 903 | 880 | 171.5 |
| B | 3 | 112 | 28182 | 159.18 | 903 | 880 | 171.5 |
| C | 3 | 233 | 195030 | 959.49 | 872 | 876 | 202.4 |
| C | 14 | 238 | 141714 | 696.01 | 872 | 876 | 202.4 |
| C | 13 | 61 | 6105 | 25.84 | 872 | 876 | 202.4 |
| D | 1 | 52 | 1248076 | 6085.84 | 861 | 839 | 204.9 |
| D | 7 | 80 | 550311 | 2681.12 | 861 | 839 | 204.9 |
| D | 2 | 250 | 203393 | 988.35 | 861 | 839 | 204.9 |
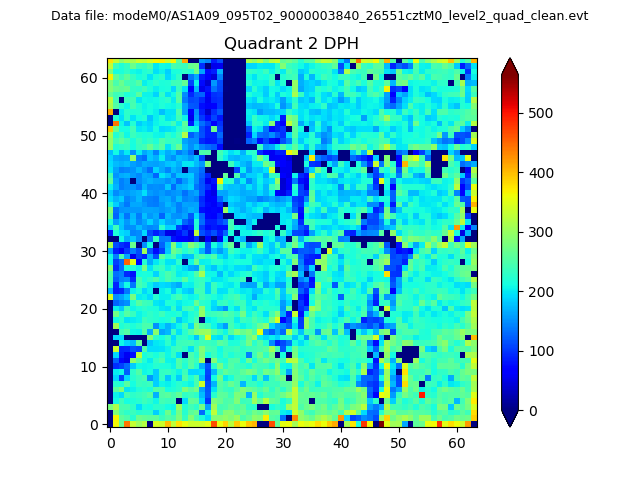
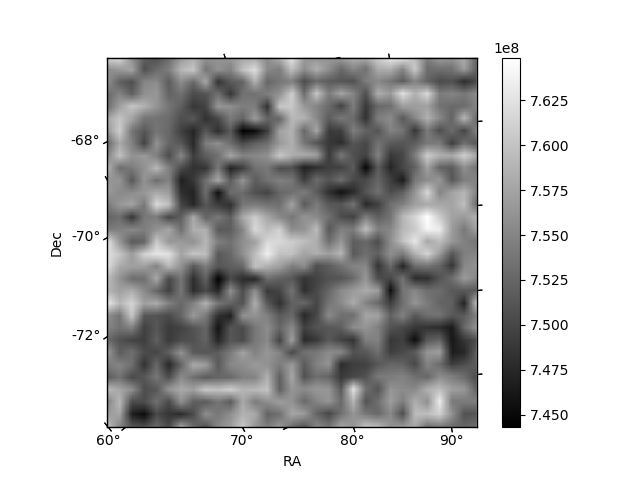
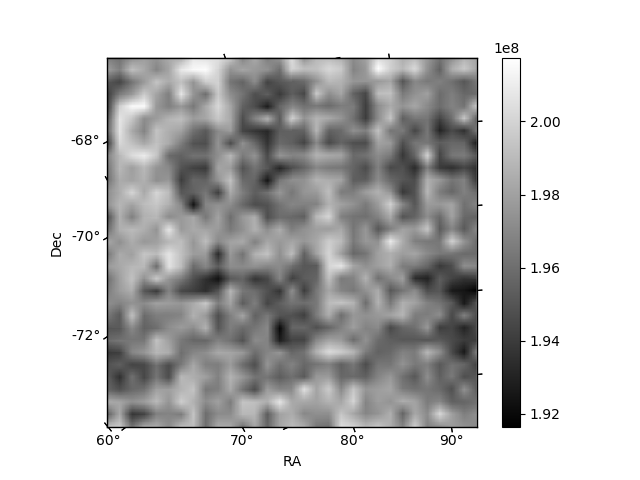
Histogram calculated using DETX and DETY for each event in the final _common_clean file
| Quadrant A | 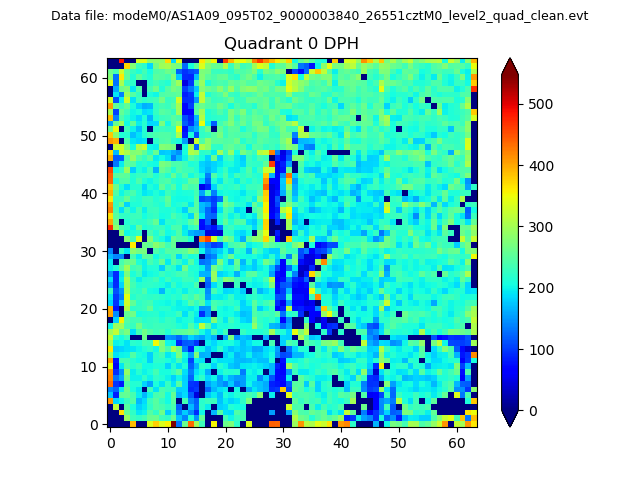 |
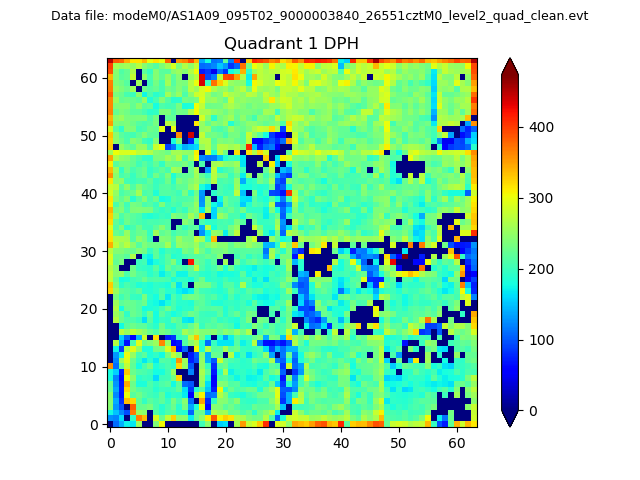 |
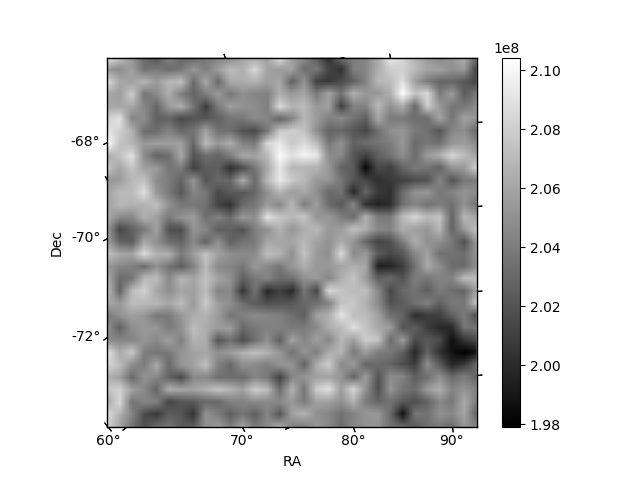
Quadrant B |
|---|---|---|---|
| Quadrant D | 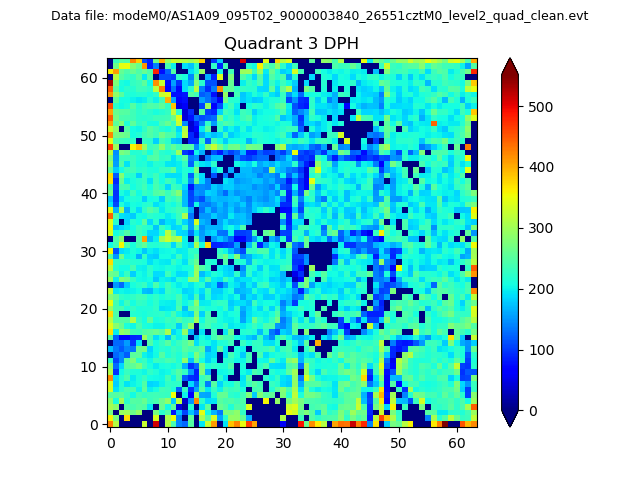 |
 |
Quadrant C |
| Plot type | Count rate plots | Images |
|---|---|---|
| Comparison with Poisson distribution Blue bars denote a histogram of data divided into 1 sec bins. Red curve is a Poisson curve with rate = median count rate of data. |
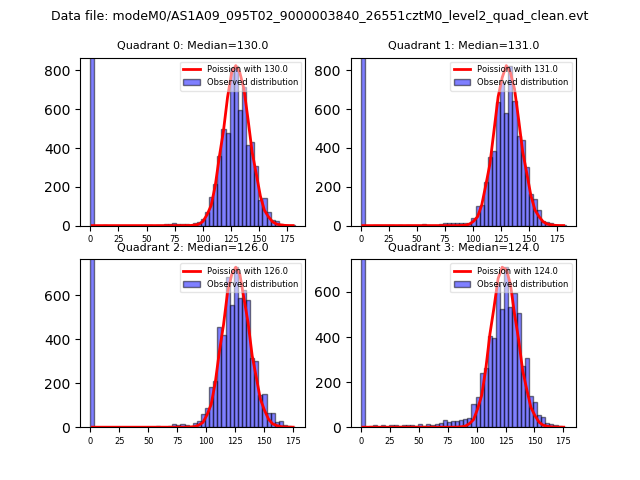 |
 |
| Quadrant-wise count rates Data is divided into 100 sec bins |
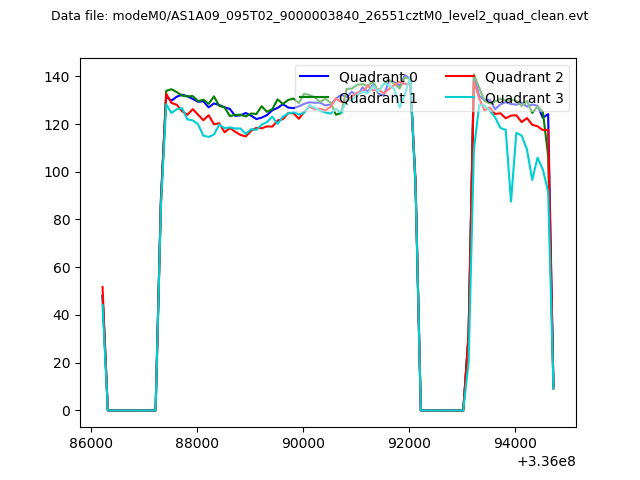 |
|
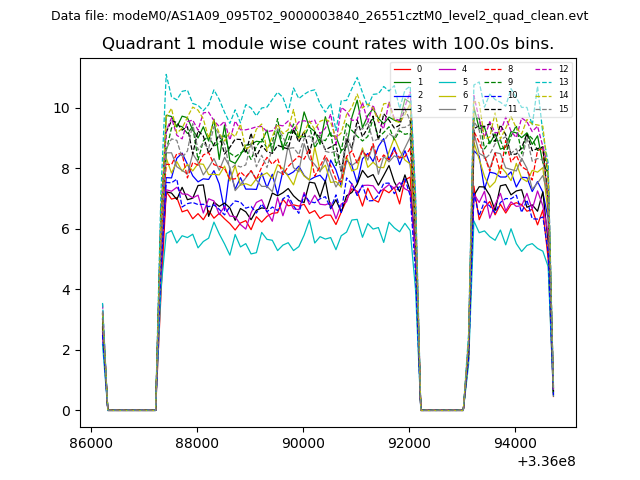
| Module-wise count rates for Quadrant A Data is divided into 100 sec bins |
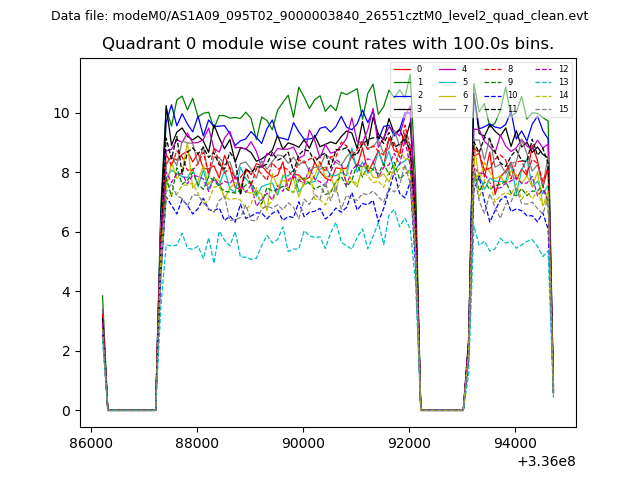 |
 |
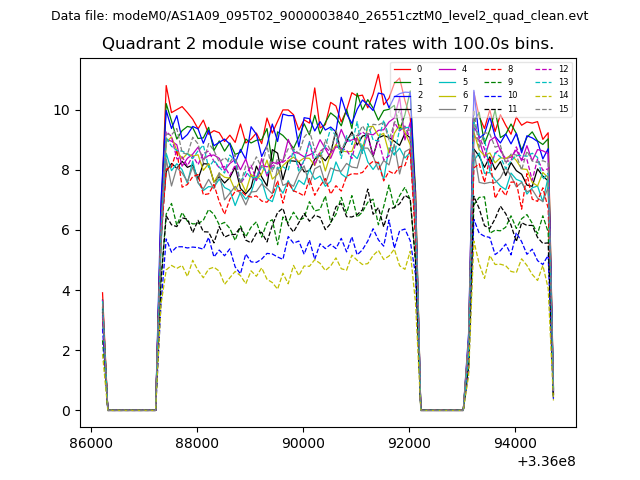
| Module-wise count rates for Quadrant B Data is divided into 100 sec bins |
 |
 |
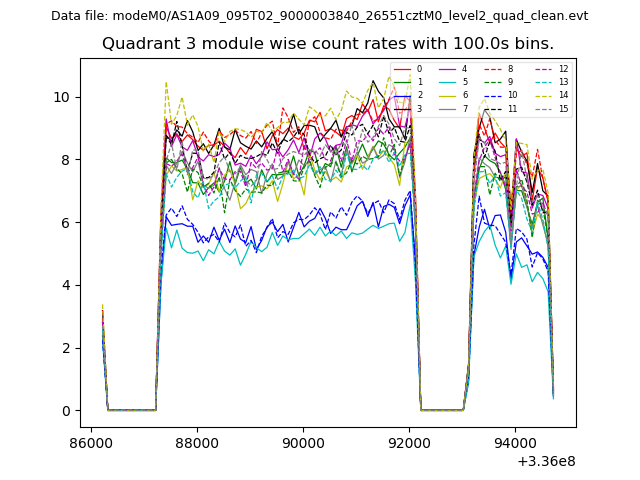
| Module-wise count rates for Quadrant C Data is divided into 100 sec bins |
 |
 |
| Module-wise count rates for Quadrant D Data is divided into 100 sec bins |
 |
 |
| Parameter | Plot |
|---|---|
| CZT HV Monitor | 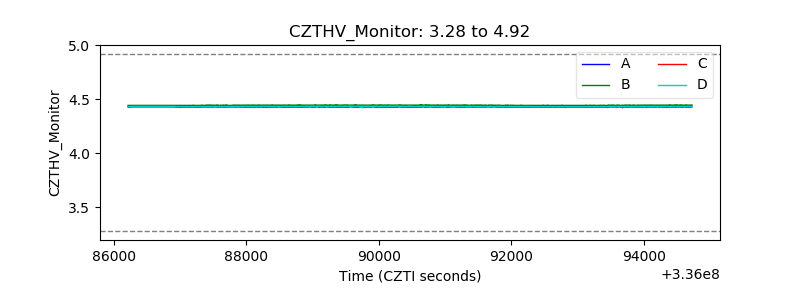 |
| D_VDD | 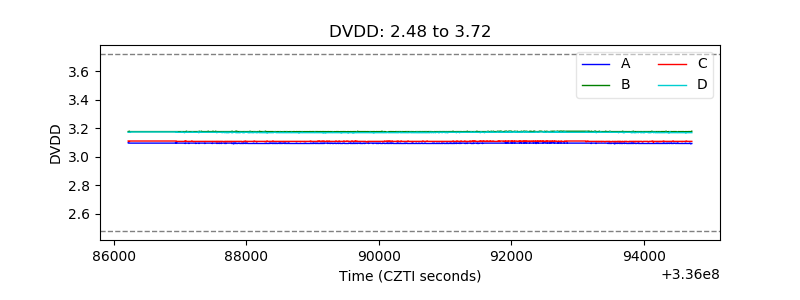 |
| Temperature 1 | 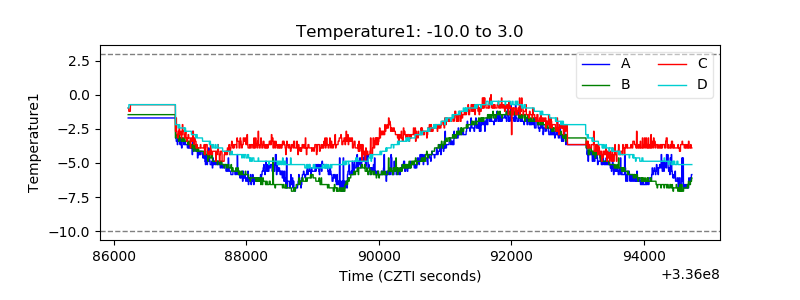 |
| Veto HV Monitor | 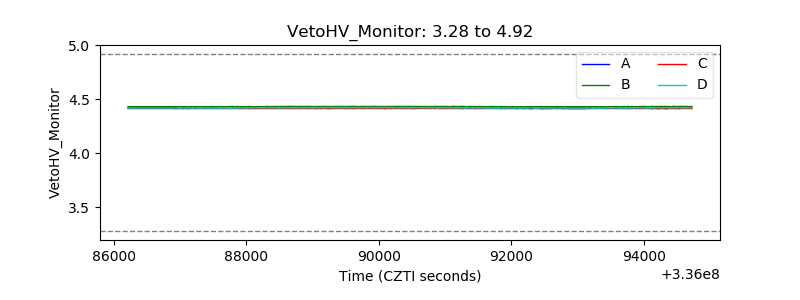 |
| Veto LLD | 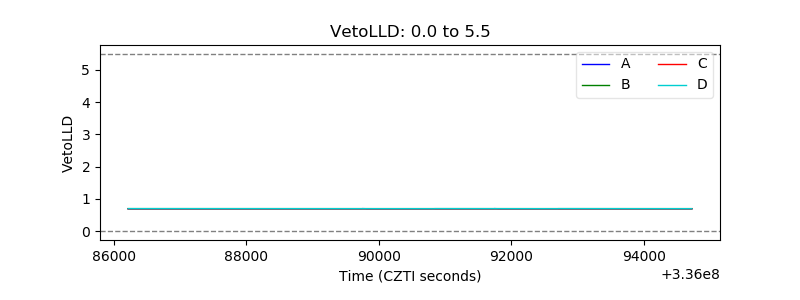 |
| Alpha Counter | 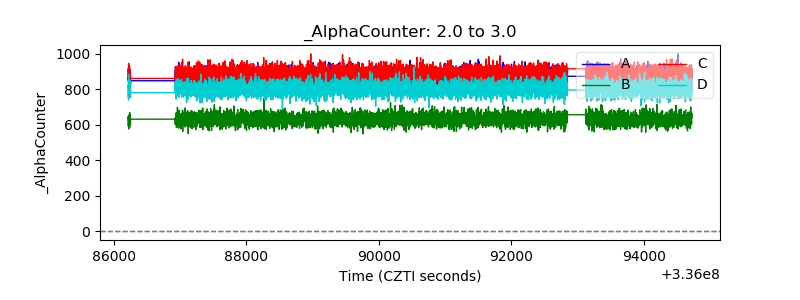 |
| _CPM_Rate | 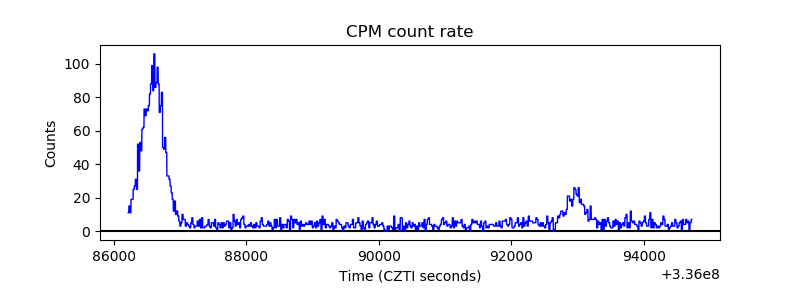 |
| CZT Counter | 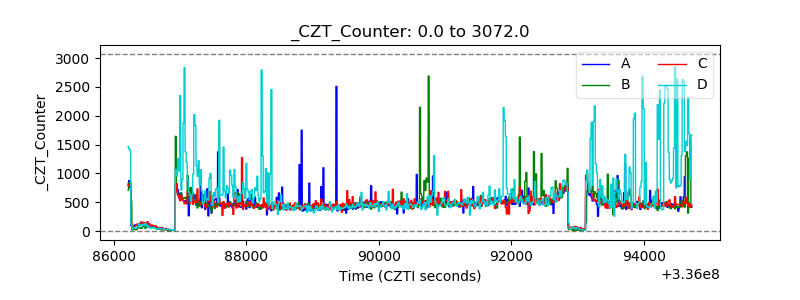 |
| +2.5 Volts monitor | 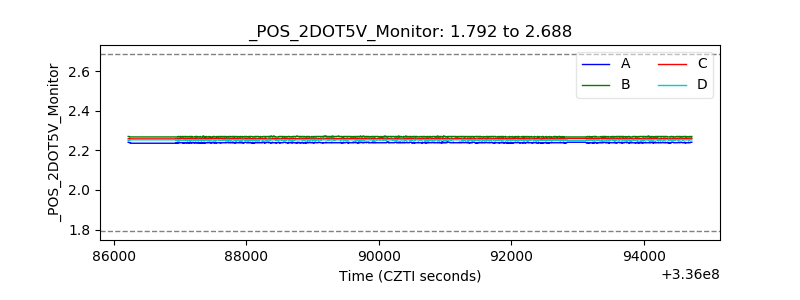 |
| +5 Volts monitor | 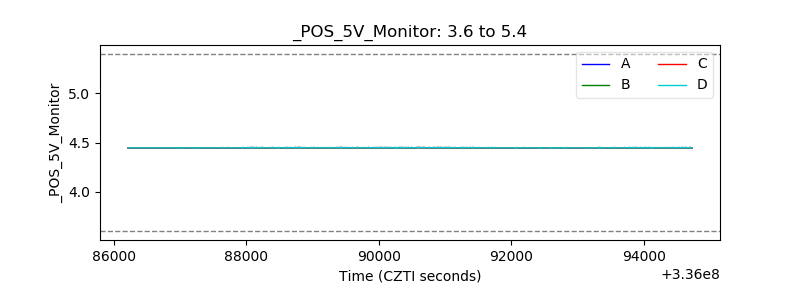 |
| _ROLL_ROT | 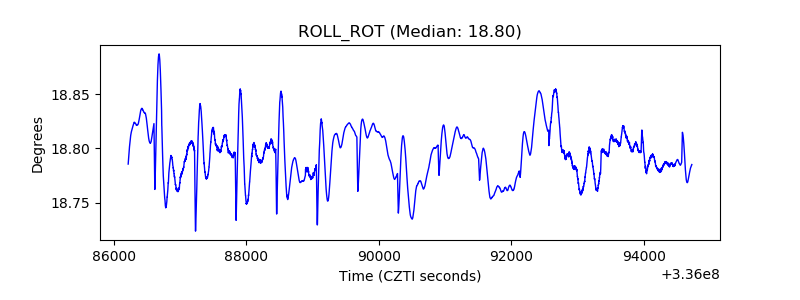 |
| _Roll_DEC | 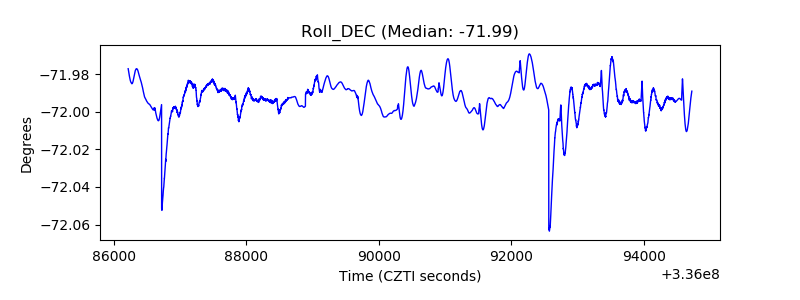 |
| _Roll_RA | 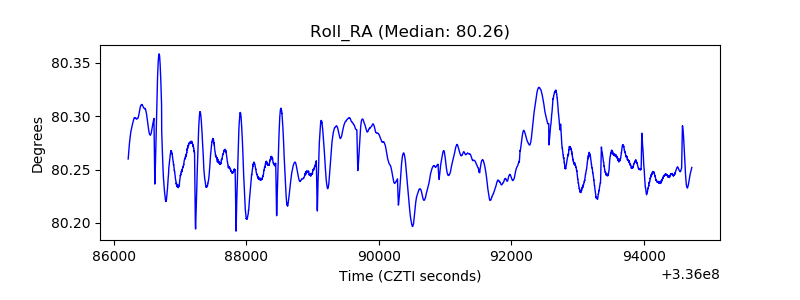 |
| Veto Counter | 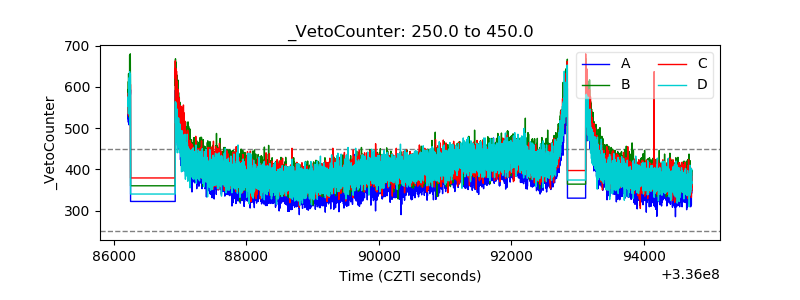 |