| Param | Original file | Final file |
|---|---|---|
| Filename | modeM0/AS1A09_095T02_9000003840_26552cztM0_level2.evt | modeM0/AS1A09_095T02_9000003840_26552cztM0_level2_quad_clean.evt |
| Size (bytes) | 862,822,080 | 118,200,960 |
| Size | 822.9 MB | 112.7 MB |
| Events in quadrant A | 4,008,944 | 837,465 |
| Events in quadrant B | 4,263,011 | 852,026 |
| Events in quadrant C | 3,981,221 | 817,029 |
| Events in quadrant D | 13,343,419 | 522,782 |
| Mode M9 | |||
|---|---|---|---|
| Quadrant | BADHDUFLAG | Total packets | Discarded packets |
| A | 0 | 6 | 0 |
| B | 0 | 6 | 0 |
| C | 0 | 6 | 0 |
| D | 0 | 6 | 0 |
| Mode M0 | |||
|---|---|---|---|
| Quadrant | BADHDUFLAG | Total packets | Discarded packets |
| A | 0 | 17089 | 0 |
| B | 0 | 17921 | 0 |
| C | 0 | 16824 | 0 |
| D | 0 | 45058 | 0 |
| Quadrant | Total seconds | Saturated seconds | Saturation percentage |
|---|---|---|---|
| A | 7901 | 129 | 1.632705% |
| B | 7902 | 275 | 3.480132% |
| C | 7902 | 208 | 2.632245% |
| D | 7901 | 3881 | 49.120365% |
Noise dominated data is calculated using 1-second bins in cleaned event files. If a bin has >2000 counts, and if more than 50% of those come from <1% of pixels, then it is considered to be noise-dominated and hence unusable.
| Quadrant | # 1 sec bins | Bins with >0 counts | Bins with >2000 counts | High rate bins dominated by noise | Noise dominated (total time) | Noise dominated (detector-on time) | Marked lightcurve |
|---|---|---|---|---|---|---|---|
| A | 8446 | 7903 | 20 | 20 | 0.24% | 0.25% | 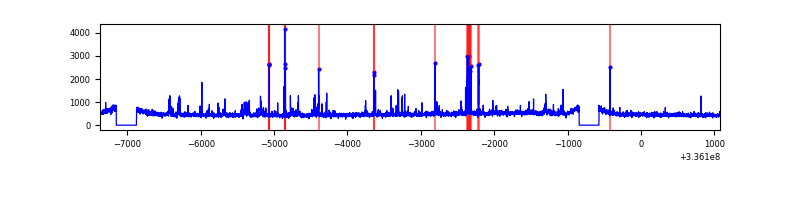 |
| B | 8447 | 7903 | 75 | 75 | 0.89% | 0.95% | 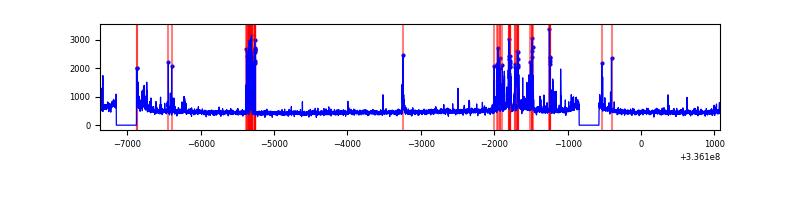 |
| C | 8447 | 7904 | 4 | 4 | 0.05% | 0.05% | 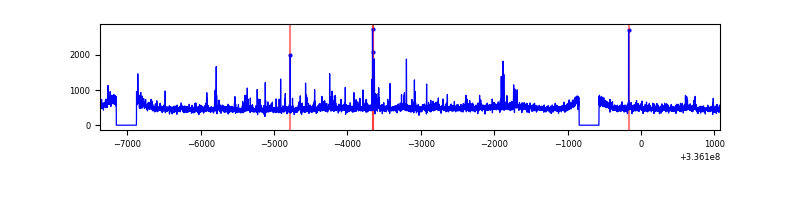 |
| D | 8446 | 7901 | 3544 | 3544 | 41.96% | 44.86% | 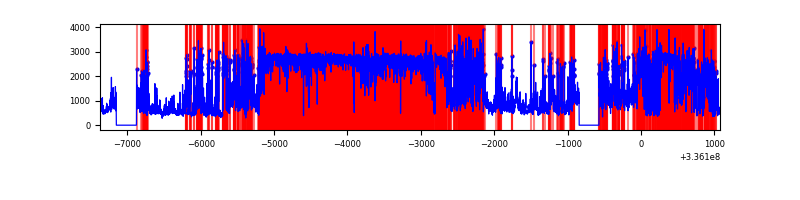 |
Top three noisy pixels from each quadrant. If the there are fewer than three noisy pixels in the level2.evt file, extra rows are filled as -1
| Pixel properties | Quadrant properties | ||||||
|---|---|---|---|---|---|---|---|
| Quadrant | DetID | PixID | Counts | Sigma | Mean | Median | Sigma |
| A | 0 | 13 | 306331 | 1614.06 | 947 | 924 | 189.2 |
| A | 5 | 168 | 45656 | 236.41 | 947 | 924 | 189.2 |
| A | 13 | 254 | 12251 | 59.86 | 947 | 924 | 189.2 |
| B | 5 | 172 | 269707 | 1497.92 | 941 | 916 | 179.4 |
| B | 3 | 64 | 234259 | 1300.37 | 941 | 916 | 179.4 |
| B | 3 | 112 | 42178 | 229.94 | 941 | 916 | 179.4 |
| C | 3 | 233 | 253785 | 1196.53 | 911 | 914 | 211.3 |
| C | 14 | 238 | 146544 | 689.09 | 911 | 914 | 211.3 |
| C | 4 | 254 | 26097 | 119.16 | 911 | 914 | 211.3 |
| D | 7 | 80 | 9148653 | 55242.99 | 690 | 670 | 165.6 |
| D | 1 | 52 | 1263666 | 7627.0 | 690 | 670 | 165.6 |
| D | 2 | 250 | 218037 | 1312.64 | 690 | 670 | 165.6 |
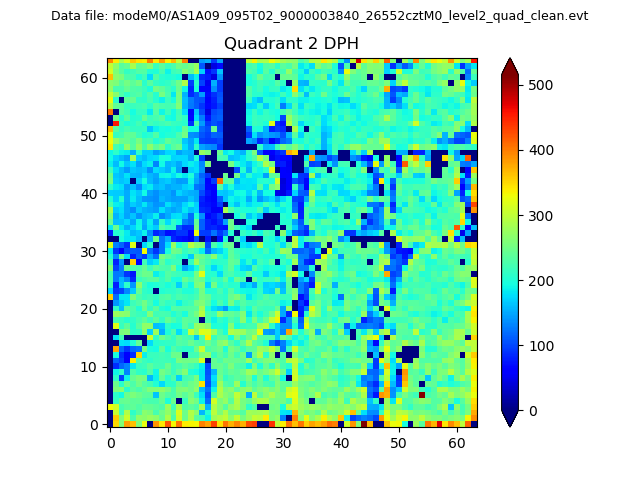
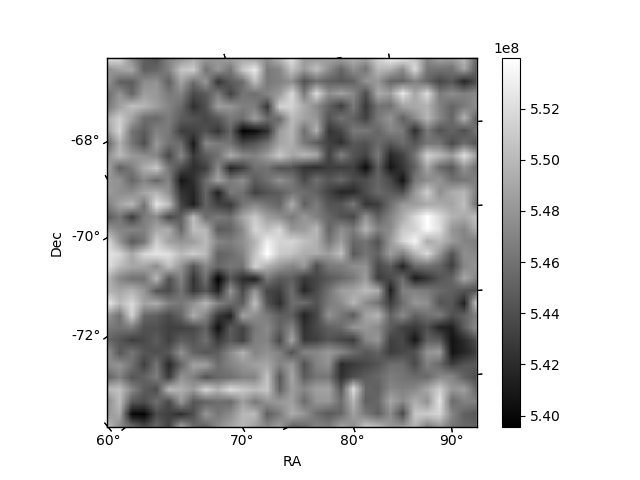
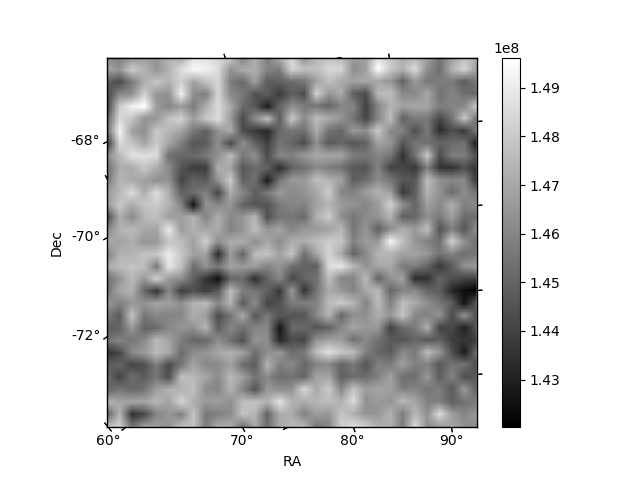
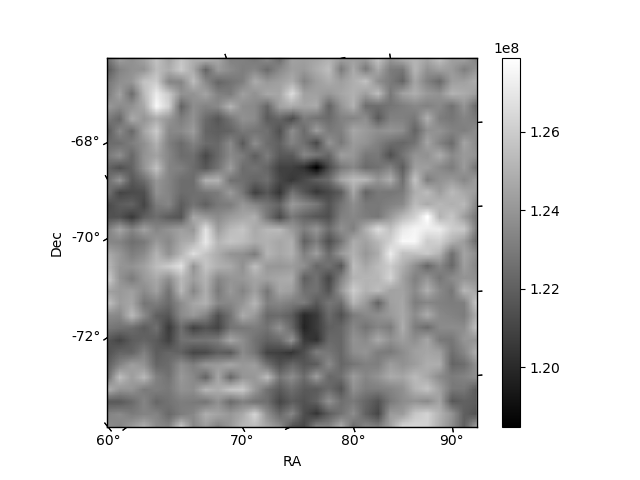
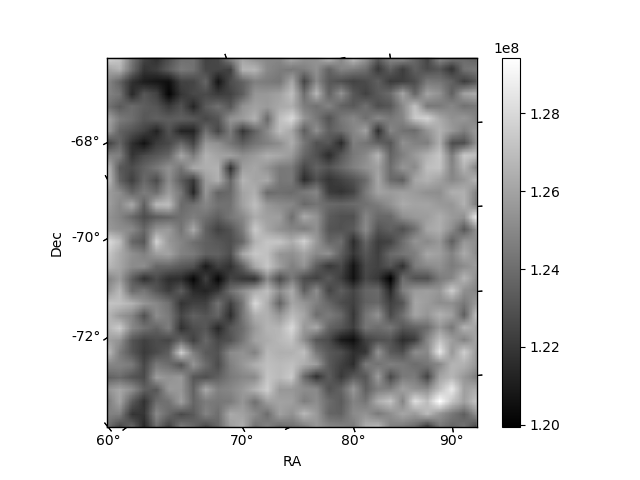
Histogram calculated using DETX and DETY for each event in the final _common_clean file
| Quadrant A | 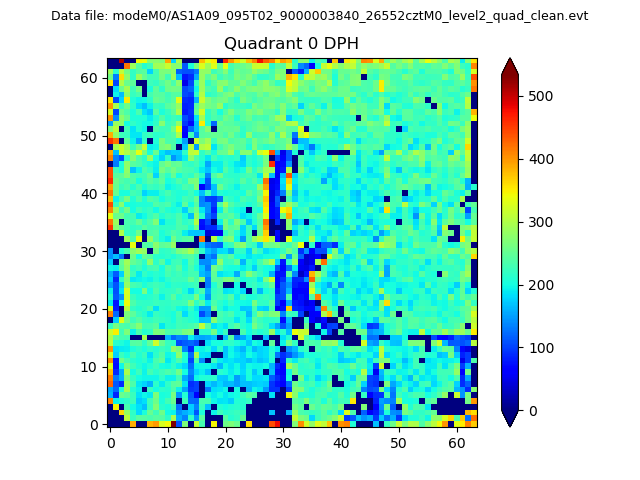 |
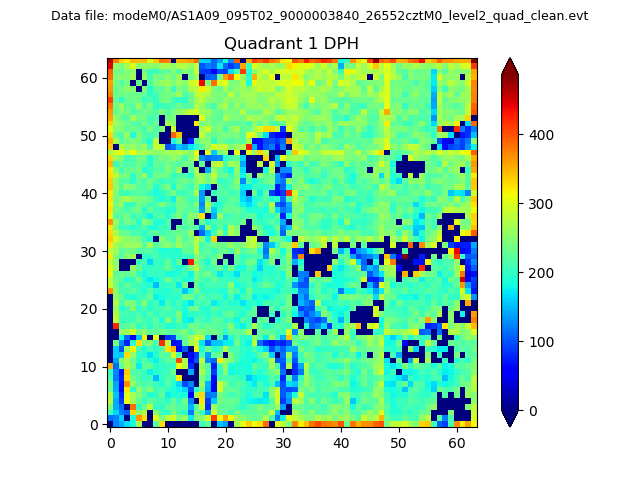 |
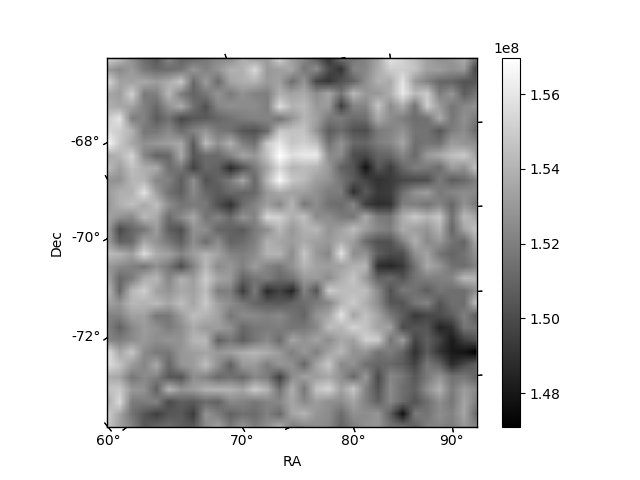
Quadrant B |
|---|---|---|---|
| Quadrant D | 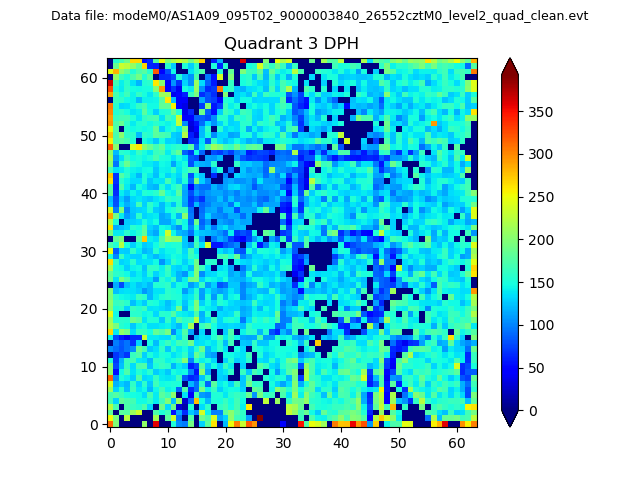 |
 |
Quadrant C |
| Plot type | Count rate plots | Images |
|---|---|---|
| Comparison with Poisson distribution Blue bars denote a histogram of data divided into 1 sec bins. Red curve is a Poisson curve with rate = median count rate of data. |
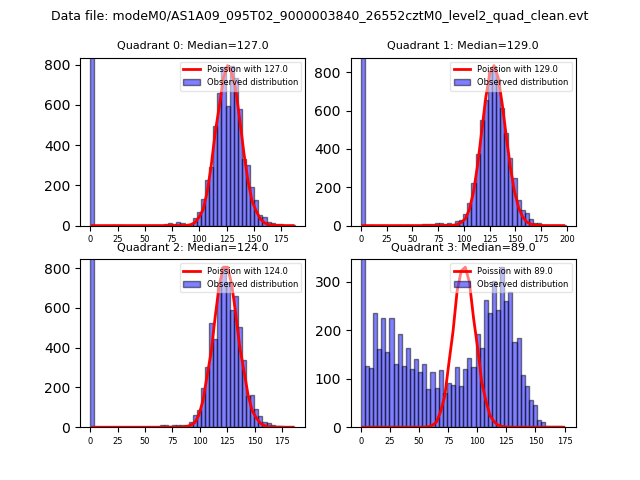 |
 |
| Quadrant-wise count rates Data is divided into 100 sec bins |
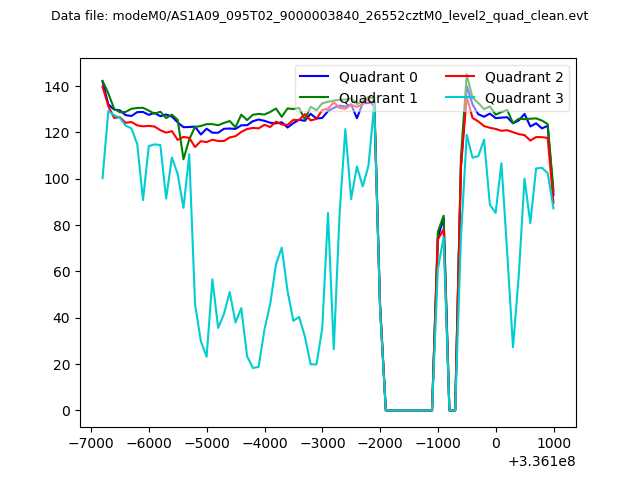 |
|
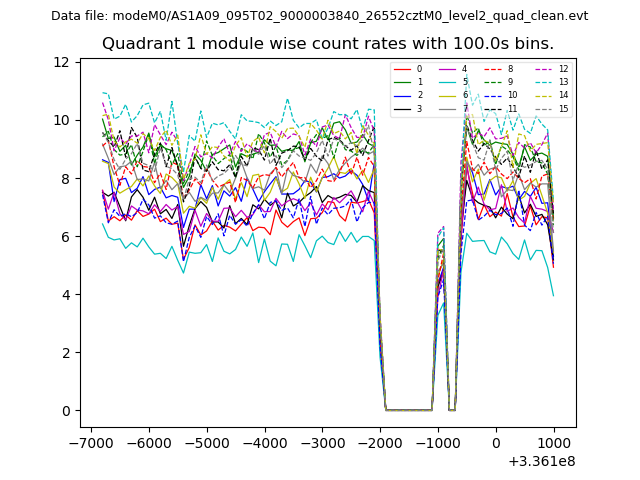
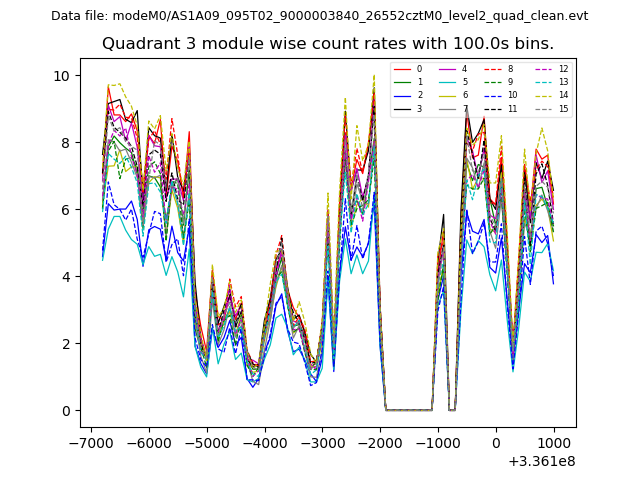
| Module-wise count rates for Quadrant A Data is divided into 100 sec bins |
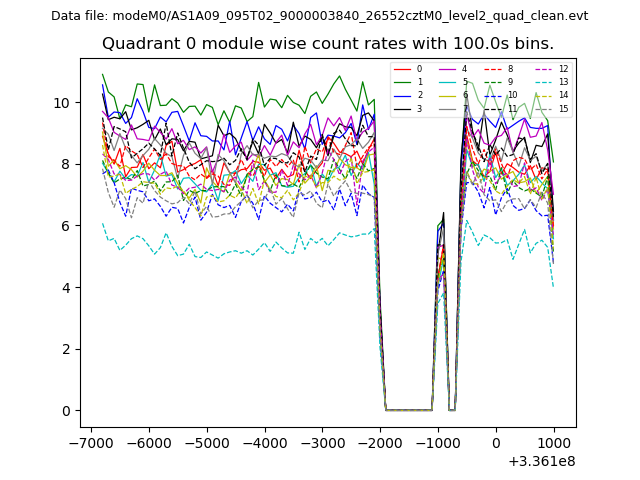 |
 |
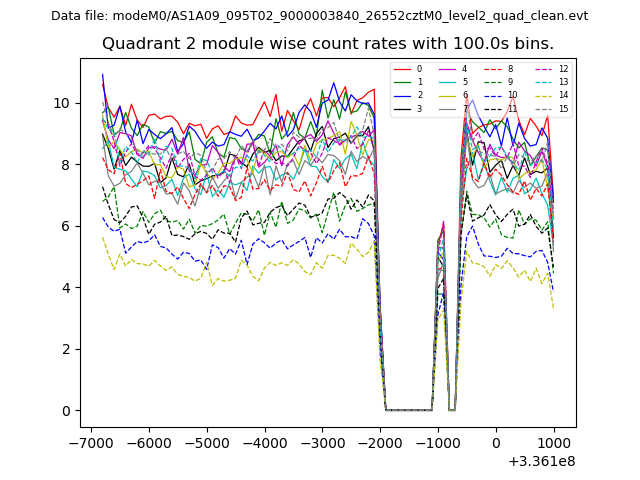
| Module-wise count rates for Quadrant B Data is divided into 100 sec bins |
 |
 |
| Module-wise count rates for Quadrant C Data is divided into 100 sec bins |
 |
 |
| Module-wise count rates for Quadrant D Data is divided into 100 sec bins |
 |
 |
| Parameter | Plot |
|---|---|
| CZT HV Monitor | 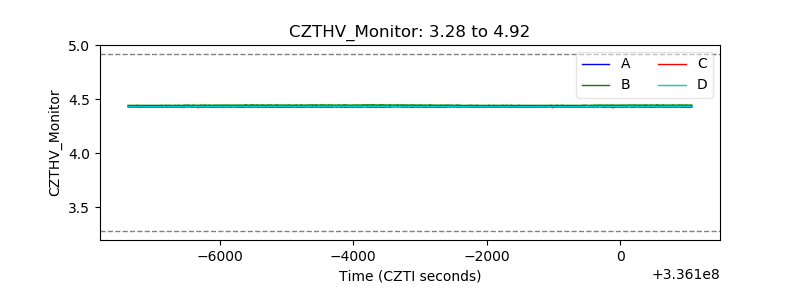 |
| D_VDD | 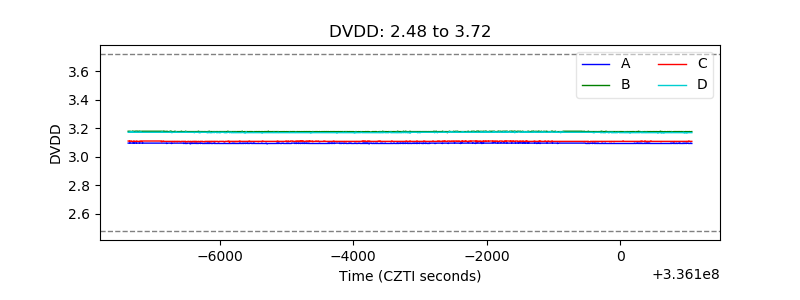 |
| Temperature 1 | 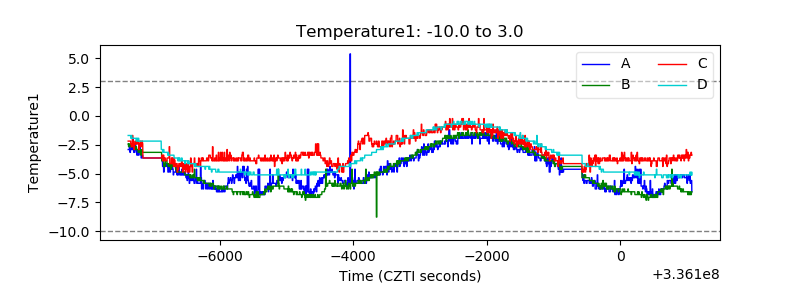 |
| Veto HV Monitor | 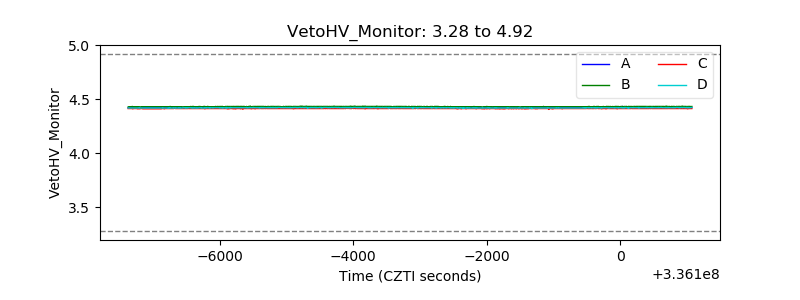 |
| Veto LLD | 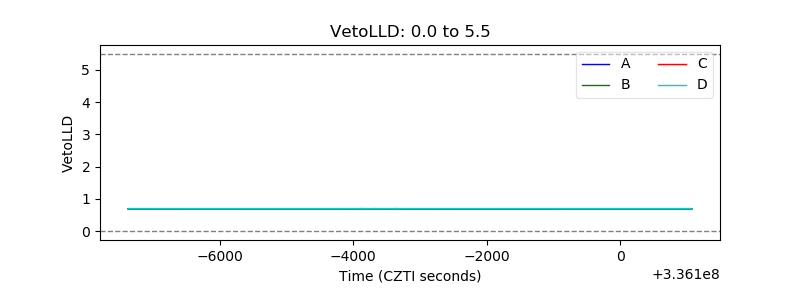 |
| Alpha Counter | 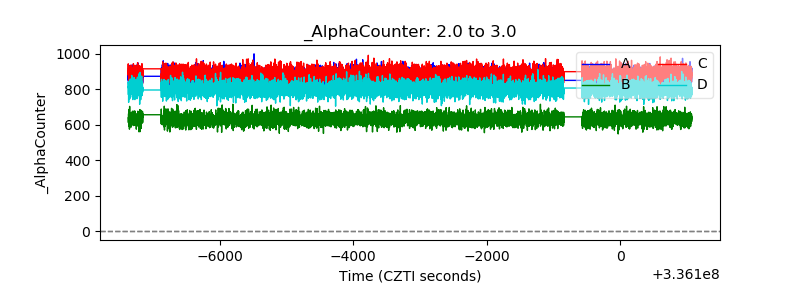 |
| _CPM_Rate | 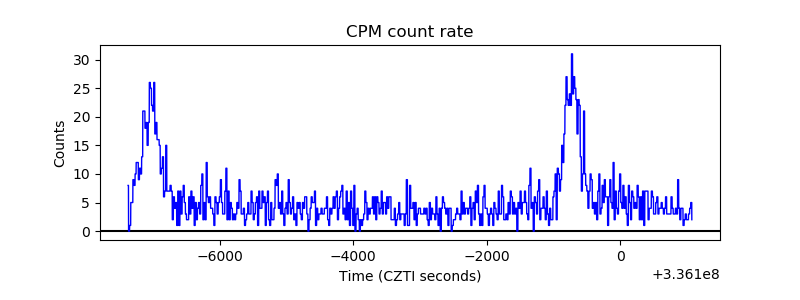 |
| CZT Counter | 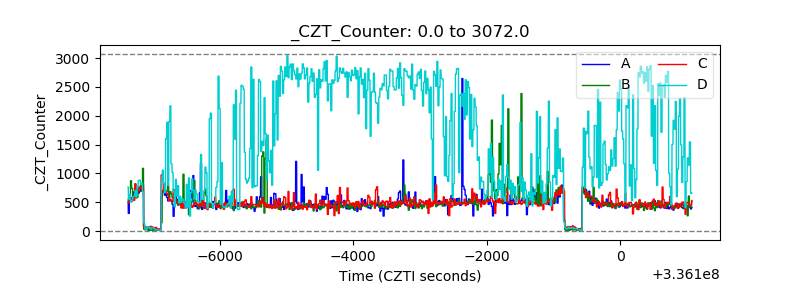 |
| +2.5 Volts monitor | 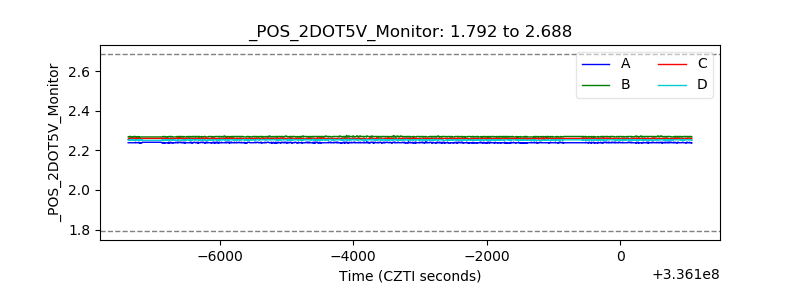 |
| +5 Volts monitor |  |
| _ROLL_ROT | 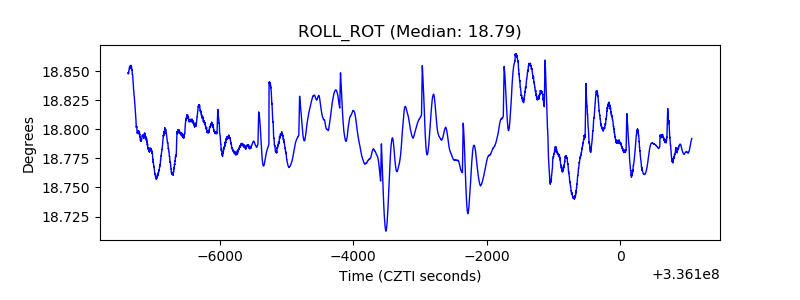 |
| _Roll_DEC | 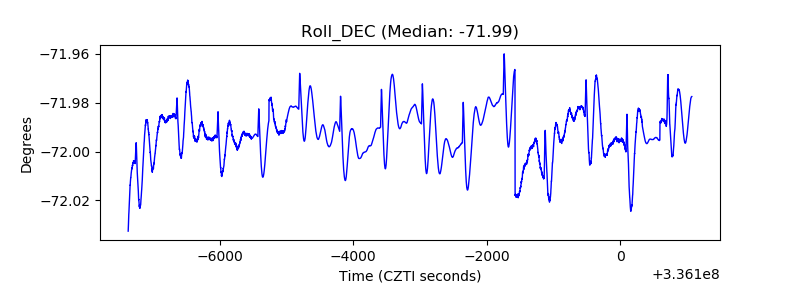 |
| _Roll_RA | 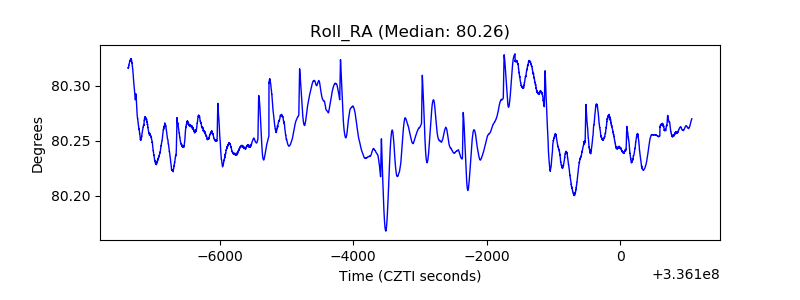 |
| Veto Counter | 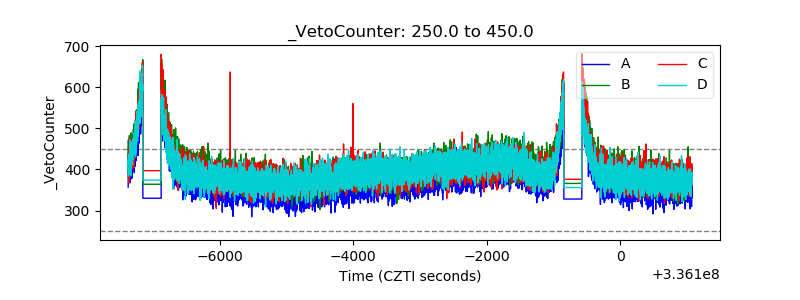 |