| Param | Original file | Final file |
|---|---|---|
| Filename | modeM0/AS1A09_095T02_9000003840_26555cztM0_level2.evt | modeM0/AS1A09_095T02_9000003840_26555cztM0_level2_quad_clean.evt |
| Size (bytes) | 1,050,359,040 | 167,336,640 |
| Size | 1001.7 MB | 159.6 MB |
| Events in quadrant A | 5,327,650 | 1,123,436 |
| Events in quadrant B | 5,570,682 | 1,144,562 |
| Events in quadrant C | 6,902,990 | 1,093,394 |
| Events in quadrant D | 13,264,035 | 942,020 |
| Mode M9 | |||
|---|---|---|---|
| Quadrant | BADHDUFLAG | Total packets | Discarded packets |
| A | 0 | 5 | 0 |
| B | 0 | 5 | 0 |
| C | 0 | 5 | 0 |
| D | 0 | 5 | 0 |
| Mode M0 | |||
|---|---|---|---|
| Quadrant | BADHDUFLAG | Total packets | Discarded packets |
| A | 0 | 22869 | 0 |
| B | 0 | 23713 | 0 |
| C | 0 | 27595 | 0 |
| D | 0 | 47014 | 0 |
| Quadrant | Total seconds | Saturated seconds | Saturation percentage |
|---|---|---|---|
| A | 11038 | 66 | 0.597934% |
| B | 11038 | 105 | 0.951259% |
| C | 11039 | 490 | 4.438808% |
| D | 11039 | 2453 | 22.221216% |
Noise dominated data is calculated using 1-second bins in cleaned event files. If a bin has >2000 counts, and if more than 50% of those come from <1% of pixels, then it is considered to be noise-dominated and hence unusable.
| Quadrant | # 1 sec bins | Bins with >0 counts | Bins with >2000 counts | High rate bins dominated by noise | Noise dominated (total time) | Noise dominated (detector-on time) | Marked lightcurve |
|---|---|---|---|---|---|---|---|
| A | 11478 | 11039 | 30 | 30 | 0.26% | 0.27% | 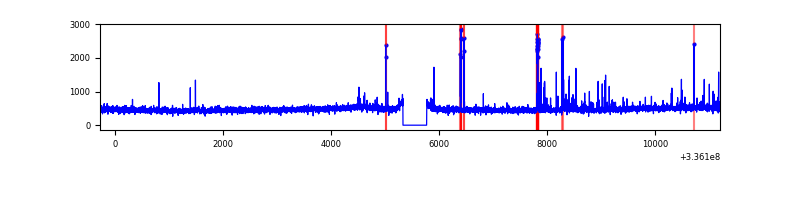 |
| B | 11478 | 11039 | 36 | 36 | 0.31% | 0.33% | 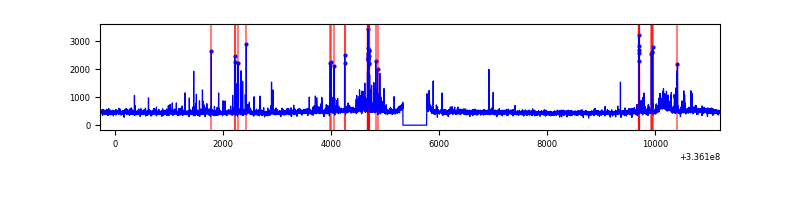 |
| C | 11479 | 11039 | 275 | 275 | 2.40% | 2.49% | 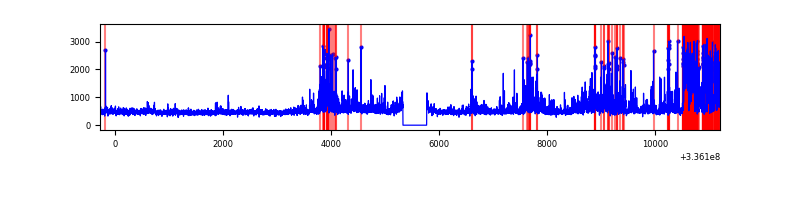 |
| D | 11479 | 11039 | 2217 | 2217 | 19.31% | 20.08% | 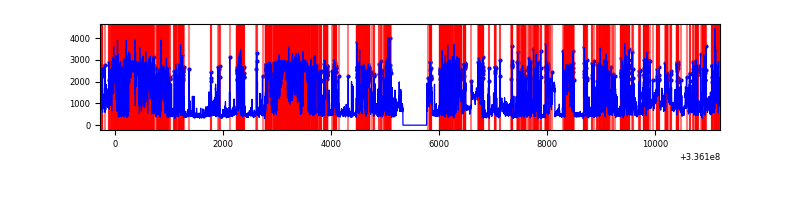 |
Top three noisy pixels from each quadrant. If the there are fewer than three noisy pixels in the level2.evt file, extra rows are filled as -1
| Pixel properties | Quadrant properties | ||||||
|---|---|---|---|---|---|---|---|
| Quadrant | DetID | PixID | Counts | Sigma | Mean | Median | Sigma |
| A | 0 | 13 | 216280 | 830.56 | 1296 | 1268 | 258.9 |
| A | 5 | 168 | 105616 | 403.08 | 1296 | 1268 | 258.9 |
| A | 13 | 254 | 18210 | 65.44 | 1296 | 1268 | 258.9 |
| B | 5 | 172 | 309989 | 1261.14 | 1287 | 1254 | 244.8 |
| B | 3 | 64 | 109589 | 442.53 | 1287 | 1254 | 244.8 |
| B | 0 | 229 | 40425 | 160.01 | 1287 | 1254 | 244.8 |
| C | 4 | 254 | 1243296 | 4316.84 | 1236 | 1243 | 287.7 |
| C | 3 | 233 | 637173 | 2210.22 | 1236 | 1243 | 287.7 |
| C | 14 | 238 | 196113 | 677.28 | 1236 | 1243 | 287.7 |
| D | 7 | 80 | 6683272 | 24940.2 | 1134 | 1106 | 267.9 |
| D | 1 | 52 | 1930590 | 7201.52 | 1134 | 1106 | 267.9 |
| D | 2 | 250 | 185700 | 688.97 | 1134 | 1106 | 267.9 |
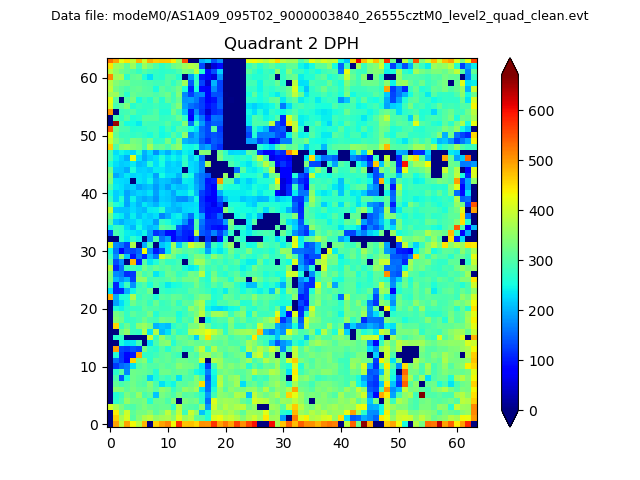
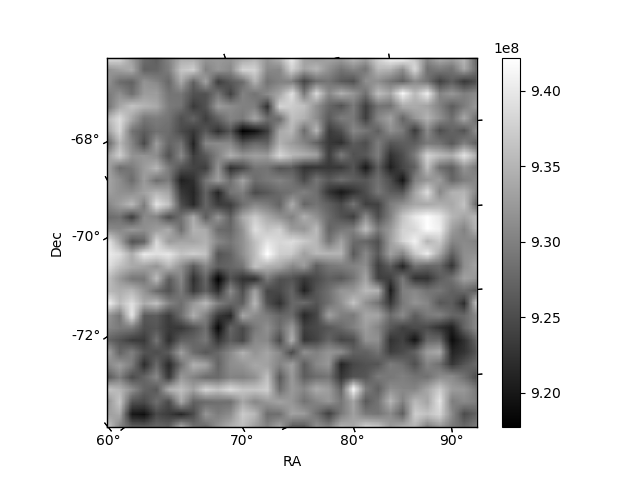
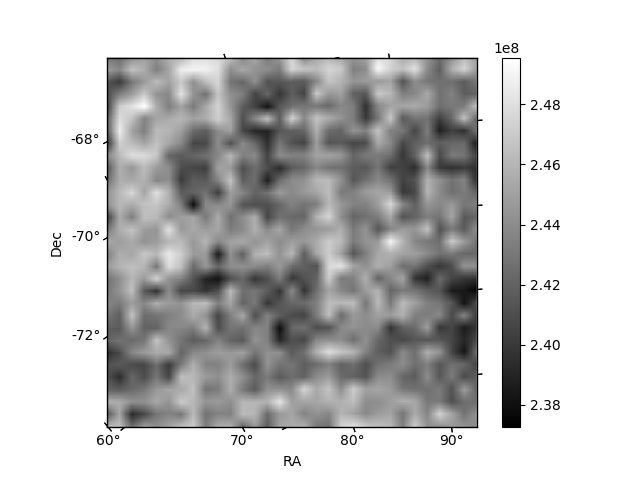
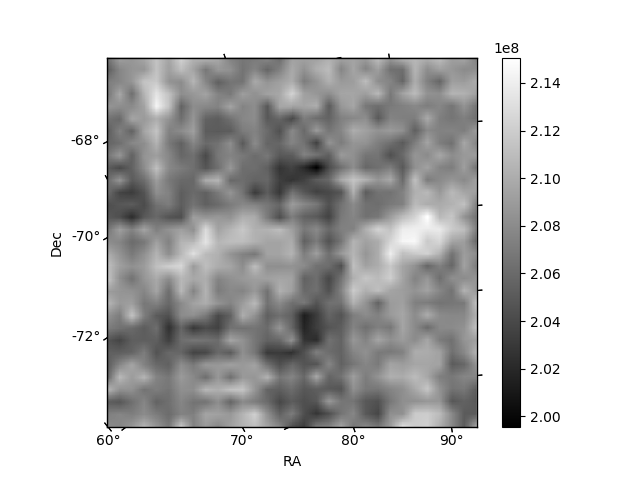
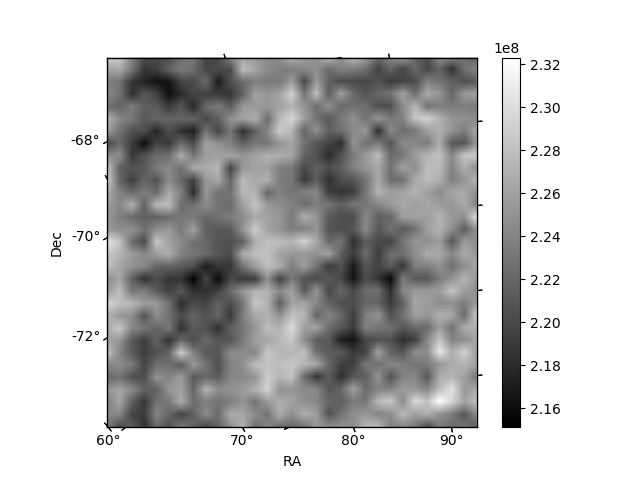
Histogram calculated using DETX and DETY for each event in the final _common_clean file
| Quadrant A | 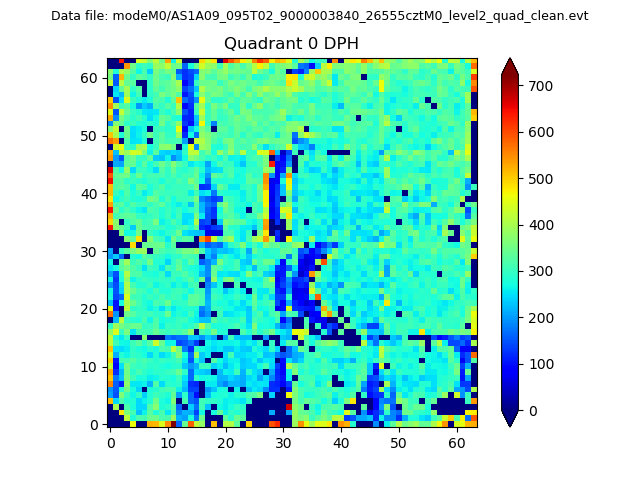 |
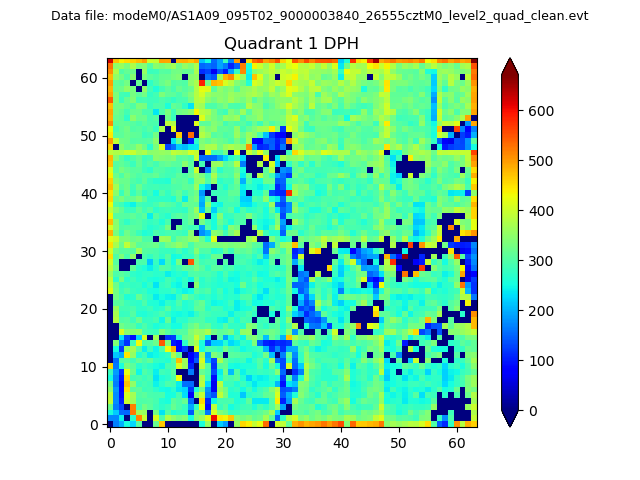 |
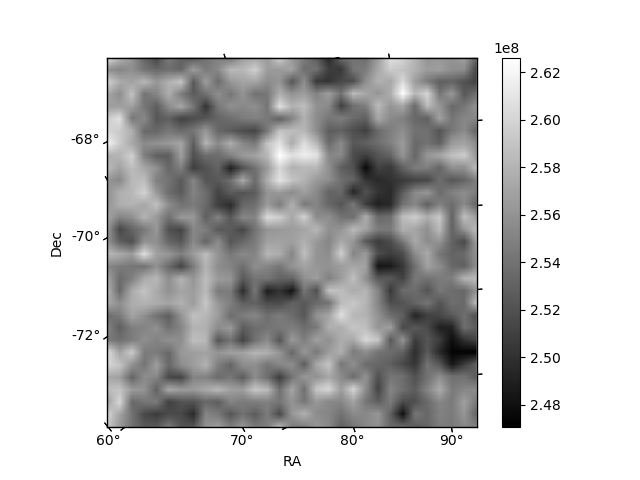
Quadrant B |
|---|---|---|---|
| Quadrant D | 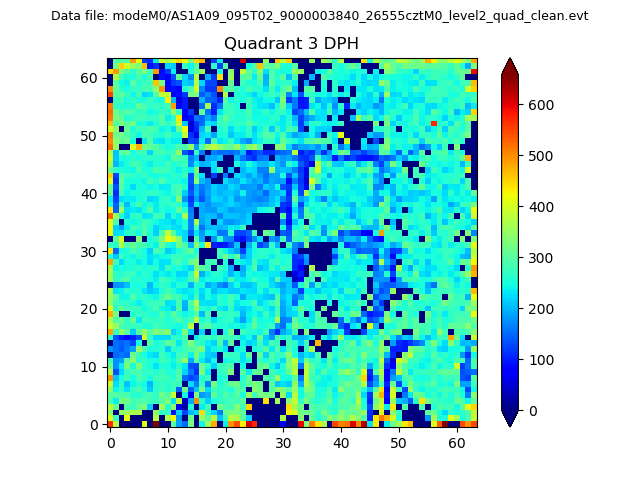 |
 |
Quadrant C |
| Plot type | Count rate plots | Images |
|---|---|---|
| Comparison with Poisson distribution Blue bars denote a histogram of data divided into 1 sec bins. Red curve is a Poisson curve with rate = median count rate of data. |
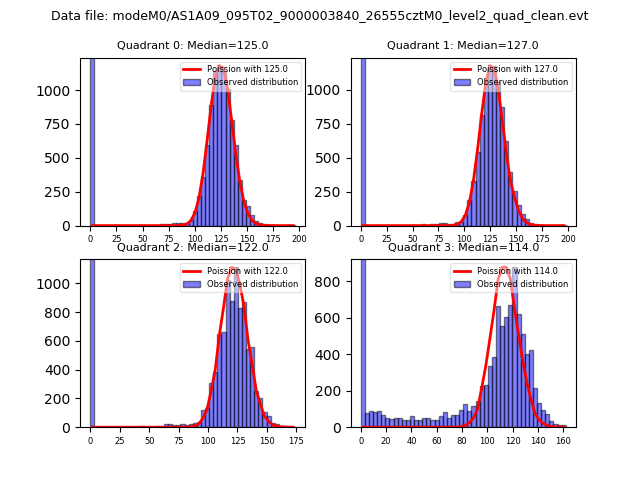 |
 |
| Quadrant-wise count rates Data is divided into 100 sec bins |
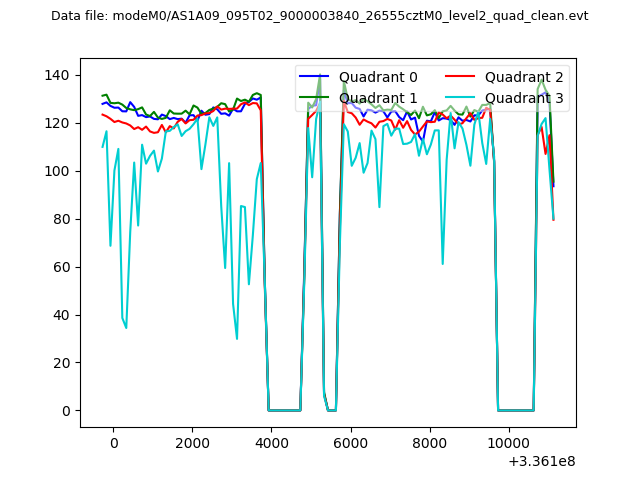 |
|
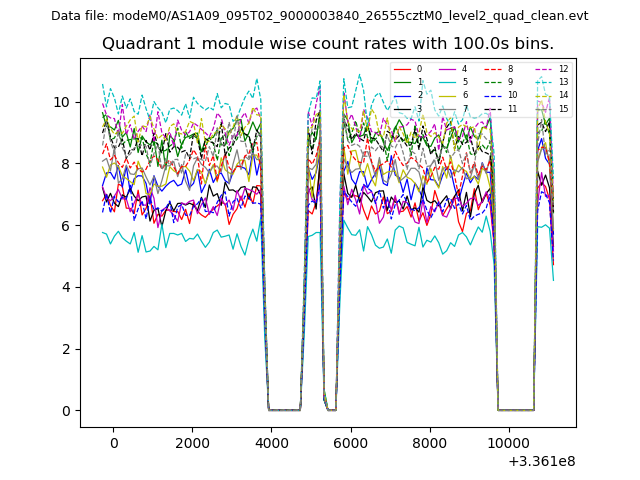
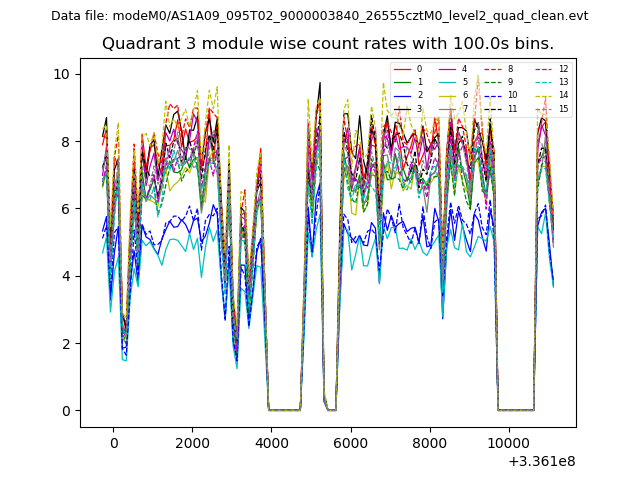
| Module-wise count rates for Quadrant A Data is divided into 100 sec bins |
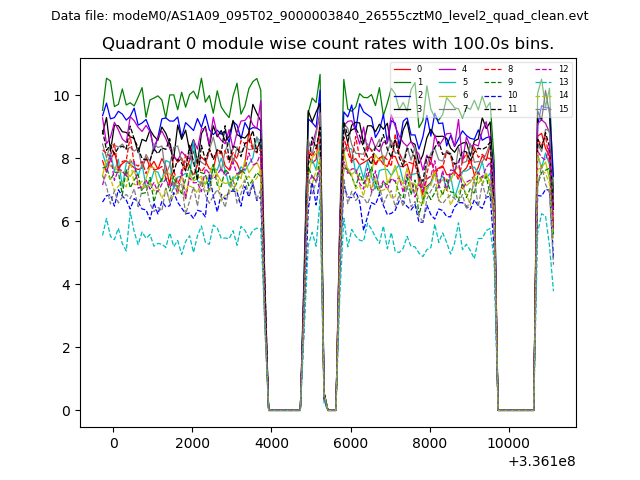 |
 |
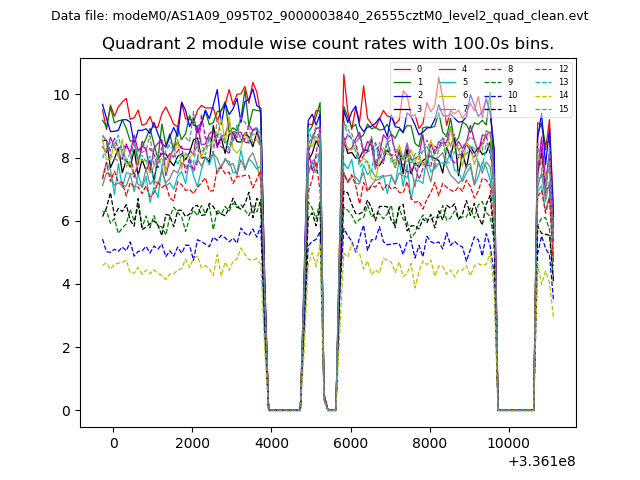
| Module-wise count rates for Quadrant B Data is divided into 100 sec bins |
 |
 |
| Module-wise count rates for Quadrant C Data is divided into 100 sec bins |
 |
 |
| Module-wise count rates for Quadrant D Data is divided into 100 sec bins |
 |
 |
| Parameter | Plot |
|---|---|
| CZT HV Monitor | 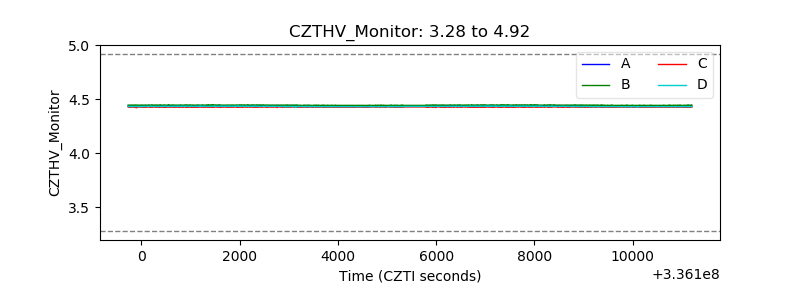 |
| D_VDD | 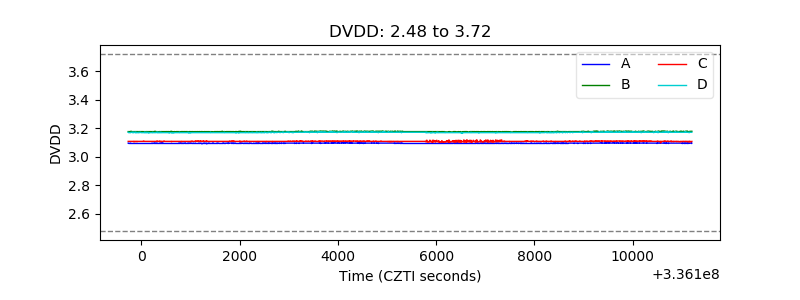 |
| Temperature 1 | 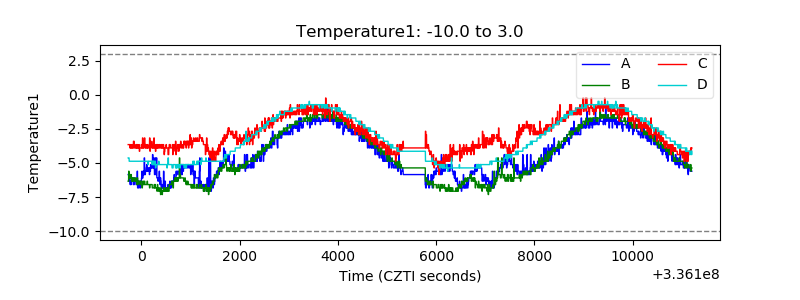 |
| Veto HV Monitor | 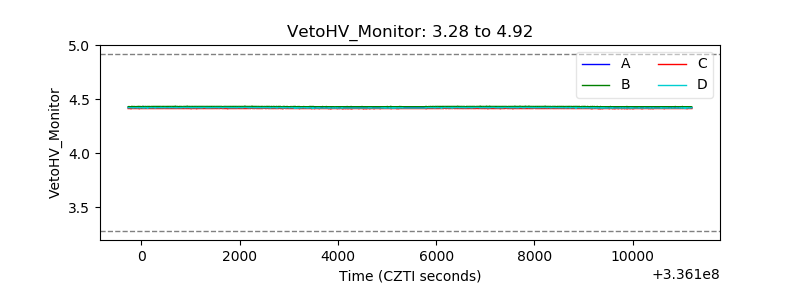 |
| Veto LLD | 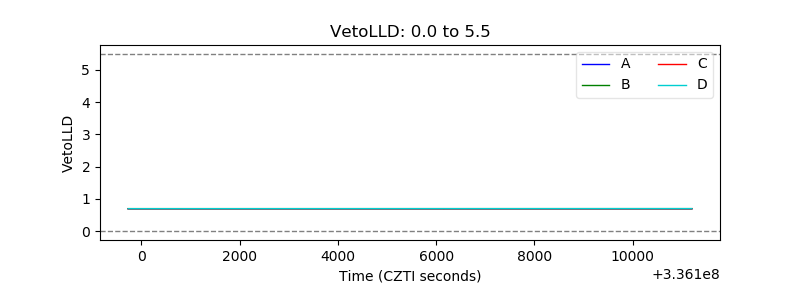 |
| Alpha Counter | 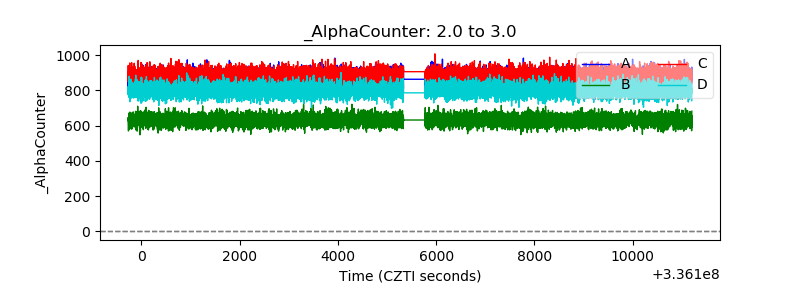 |
| _CPM_Rate | 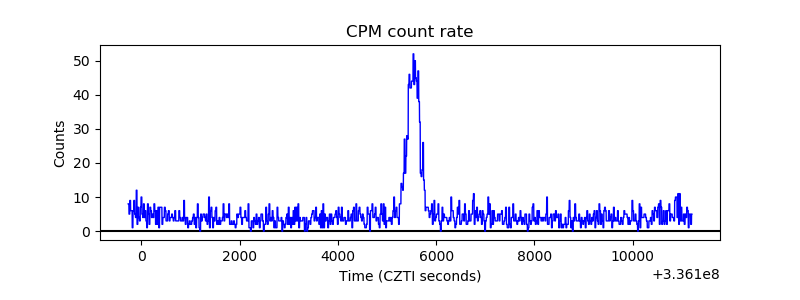 |
| CZT Counter | 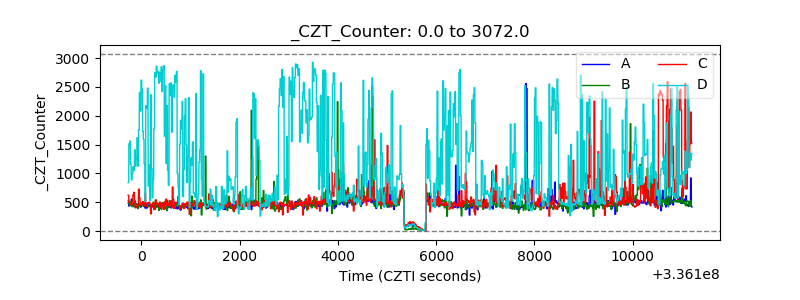 |
| +2.5 Volts monitor |  |
| +5 Volts monitor |  |
| _ROLL_ROT | 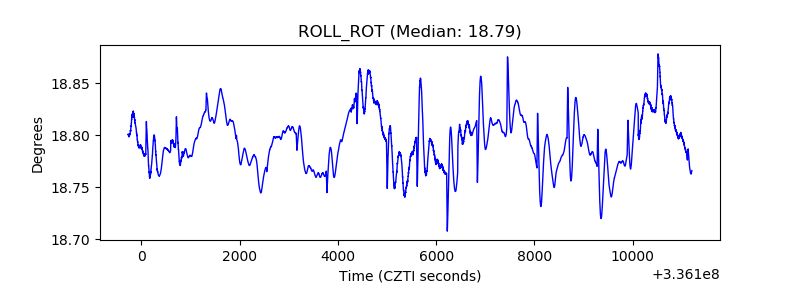 |
| _Roll_DEC | 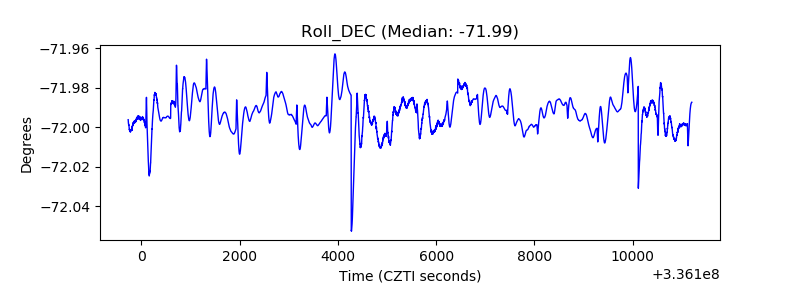 |
| _Roll_RA | 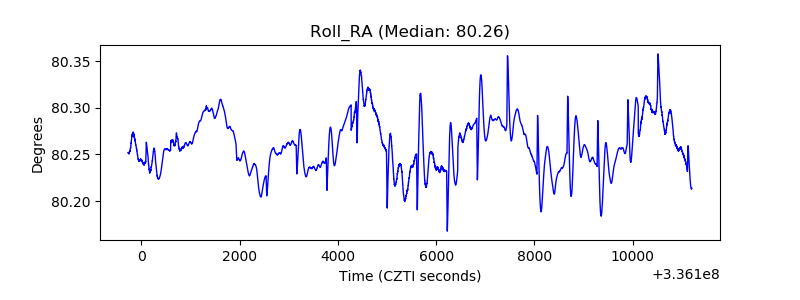 |
| Veto Counter |  |