| Param | Original file | Final file |
|---|---|---|
| Filename | modeM0/AS1A09_038T10_9000003844cztM0_level2.fits | modeM0/AS1A09_038T10_9000003844cztM0_level2_quad_clean.evt |
| Size (bytes) | 88,027,200 | 99,325,440 |
| Size | 83.9 MB | 94.7 MB |
| Events in quadrant A | 564,220 | 665,780 |
| Events in quadrant B | 529,338 | 646,956 |
| Events in quadrant C | 540,094 | 642,882 |
| Events in quadrant D | 362,688 | 383,908 |
| Mode SS | |||
|---|---|---|---|
| Quadrant | BADHDUFLAG | Total packets | Discarded packets |
| A | 0 | 196 | 0 |
| B | 0 | 196 | 0 |
| C | 0 | 196 | 0 |
| D | 0 | 196 | 0 |
| Mode M0 | |||
|---|---|---|---|
| Quadrant | BADHDUFLAG | Total packets | Discarded packets |
| A | 0 | 20093 | 0 |
| B | 0 | 22593 | 0 |
| C | 0 | 24022 | 0 |
| D | 0 | 50822 | 0 |
| Mode M9 | |||
|---|---|---|---|
| Quadrant | BADHDUFLAG | Total packets | Discarded packets |
| A | 0 | 6 | 0 |
| B | 0 | 6 | 0 |
| C | 0 | 6 | 0 |
| D | 0 | 6 | 0 |
| Quadrant | Total seconds | Saturated seconds | Saturation percentage |
|---|---|---|---|
| A | 9633 | 51 | 0.529430% |
| B | 9633 | 384 | 3.986297% |
| C | 9633 | 417 | 4.328870% |
| D | 9633 | 4007 | 41.596595% |
Noise dominated data is calculated using 1-second bins in cleaned event files. If a bin has >2000 counts, and if more than 50% of those come from <1% of pixels, then it is considered to be noise-dominated and hence unusable.
| Quadrant | # 1 sec bins | Bins with >0 counts | Bins with >2000 counts | High rate bins dominated by noise | Noise dominated (total time) | Noise dominated (detector-on time) | Marked lightcurve |
|---|---|---|---|---|---|---|---|
| A | 10268 | 9633 | 0 | 0 | 0.00% | 0.00% |  |
| B | 10268 | 9632 | 0 | 0 | 0.00% | 0.00% |  |
| C | 10268 | 9633 | 0 | 0 | 0.00% | 0.00% |  |
| D | 10268 | 9444 | 0 | 0 | 0.00% | 0.00% |  |
Top three noisy pixels from each quadrant. If the there are fewer than three noisy pixels in the level2.evt file, extra rows are filled as -1
| Pixel properties | Quadrant properties | ||||||
|---|---|---|---|---|---|---|---|
| Quadrant | DetID | PixID | Counts | Sigma | Mean | Median | Sigma |
| A | 0 | 29 | 478 | 8.92 | 147 | 138 | 38.1 |
| A | 7 | 110 | 428 | 7.61 | 147 | 138 | 38.1 |
| A | 9 | 19 | 426 | 7.55 | 147 | 138 | 38.1 |
| B | 2 | 9 | 398 | 8.77 | 140 | 134 | 30.1 |
| B | 5 | 255 | 374 | 7.97 | 140 | 134 | 30.1 |
| B | 12 | 226 | 340 | 6.84 | 140 | 134 | 30.1 |
| C | 1 | 80 | 426 | 7.69 | 142 | 134 | 38.0 |
| C | 1 | 81 | 417 | 7.46 | 142 | 134 | 38.0 |
| C | 12 | 241 | 401 | 7.03 | 142 | 134 | 38.0 |
| D | 4 | 246 | 282 | 6.52 | 103 | 94 | 28.9 |
| D | 1 | 3 | 269 | 6.06 | 103 | 94 | 28.9 |
| D | 3 | 14 | 267 | 6.0 | 103 | 94 | 28.9 |
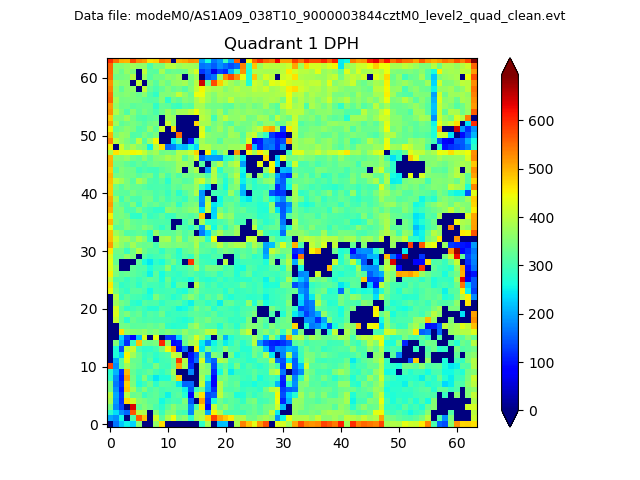
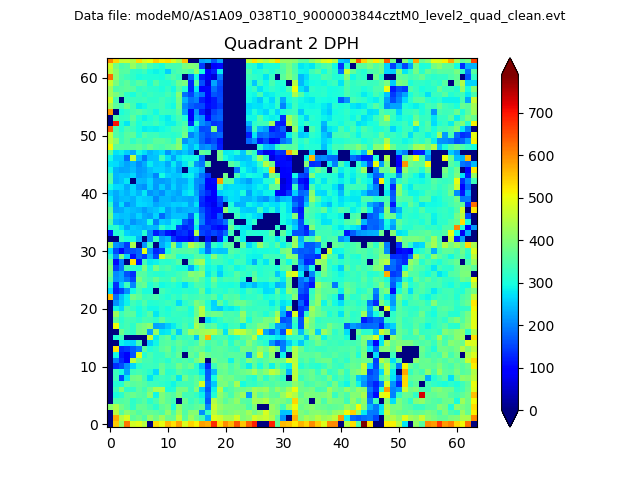
Histogram calculated using DETX and DETY for each event in the final _common_clean file
| Quadrant A |  |
 |
Quadrant B |
|---|---|---|---|
| Quadrant D | 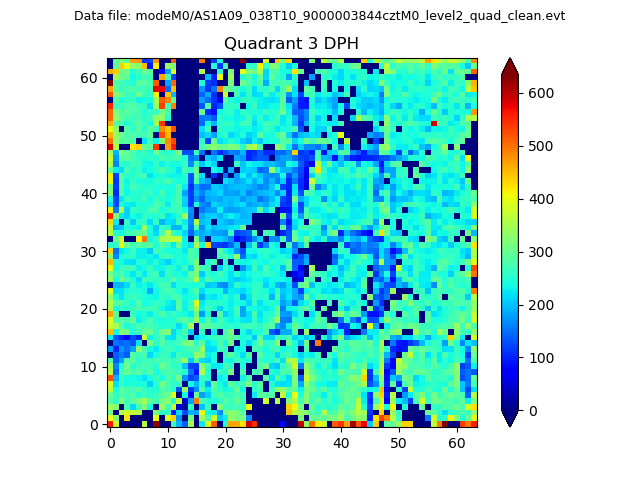 |
 |
Quadrant C |
| Plot type | Count rate plots | Images |
|---|---|---|
| Comparison with Poisson distribution Blue bars denote a histogram of data divided into 1 sec bins. Red curve is a Poisson curve with rate = median count rate of data. |
 |
 |
| Quadrant-wise count rates Data is divided into 100 sec bins |
 |
|
| Module-wise count rates for Quadrant A Data is divided into 100 sec bins |
 |
 |
| Module-wise count rates for Quadrant B Data is divided into 100 sec bins |
 |
 |
| Module-wise count rates for Quadrant C Data is divided into 100 sec bins |
 |
 |
| Module-wise count rates for Quadrant D Data is divided into 100 sec bins |
 |
 |
| Parameter | Plot |
|---|---|
| CZT HV Monitor |  |
| D_VDD | 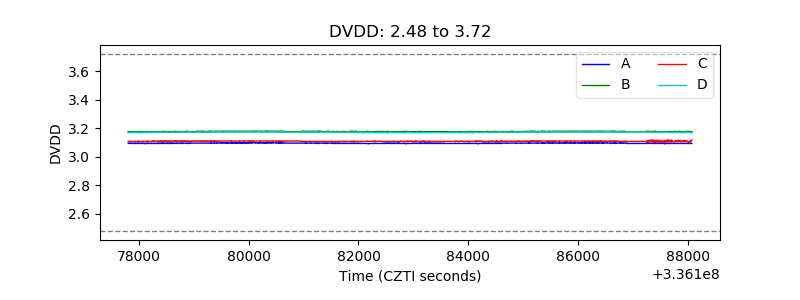 |
| Temperature 1 |  |
| Veto HV Monitor |  |
| Veto LLD |  |
| Alpha Counter |  |
| _CPM_Rate |  |
| CZT Counter |  |
| +2.5 Volts monitor |  |
| +5 Volts monitor |  |
| _ROLL_ROT |  |
| _Roll_DEC |  |
| _Roll_RA |  |
| Veto Counter |  |