| Param | Original file | Final file |
|---|---|---|
| Filename | modeM0/AS1A09_038T10_9000003844_26567cztM0_level2.evt | modeM0/AS1A09_038T10_9000003844_26567cztM0_level2_quad_clean.evt |
| Size (bytes) | 766,797,120 | 131,319,360 |
| Size | 731.3 MB | 125.2 MB |
| Events in quadrant A | 3,569,851 | 931,230 |
| Events in quadrant B | 4,223,240 | 930,158 |
| Events in quadrant C | 3,951,845 | 912,541 |
| Events in quadrant D | 10,985,754 | 695,829 |
| Mode M0 | |||
|---|---|---|---|
| Quadrant | BADHDUFLAG | Total packets | Discarded packets |
| A | 0 | 15216 | 0 |
| B | 0 | 17328 | 0 |
| C | 0 | 16339 | 0 |
| D | 0 | 37740 | 0 |
| Mode M9 | |||
|---|---|---|---|
| Quadrant | BADHDUFLAG | Total packets | Discarded packets |
| A | 0 | 6 | 0 |
| B | 0 | 6 | 0 |
| C | 0 | 6 | 0 |
| D | 0 | 6 | 0 |
| Quadrant | Total seconds | Saturated seconds | Saturation percentage |
|---|---|---|---|
| A | 7265 | 47 | 0.646937% |
| B | 7266 | 344 | 4.734379% |
| C | 7266 | 219 | 3.014038% |
| D | 7266 | 2854 | 39.278833% |
Noise dominated data is calculated using 1-second bins in cleaned event files. If a bin has >2000 counts, and if more than 50% of those come from <1% of pixels, then it is considered to be noise-dominated and hence unusable.
| Quadrant | # 1 sec bins | Bins with >0 counts | Bins with >2000 counts | High rate bins dominated by noise | Noise dominated (total time) | Noise dominated (detector-on time) | Marked lightcurve |
|---|---|---|---|---|---|---|---|
| A | 7900 | 7267 | 2 | 2 | 0.03% | 0.03% | 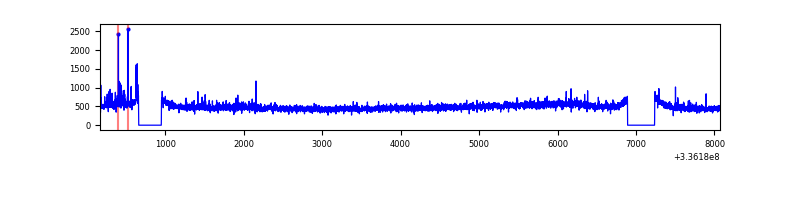 |
| B | 7901 | 7268 | 210 | 210 | 2.66% | 2.89% | 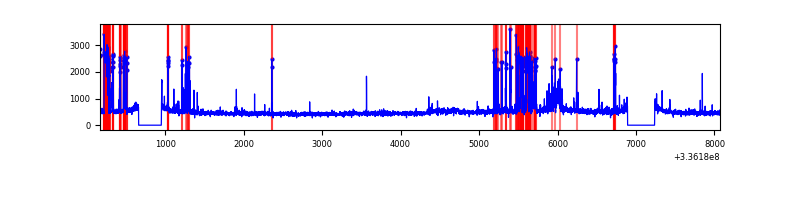 |
| C | 7901 | 7268 | 53 | 53 | 0.67% | 0.73% | 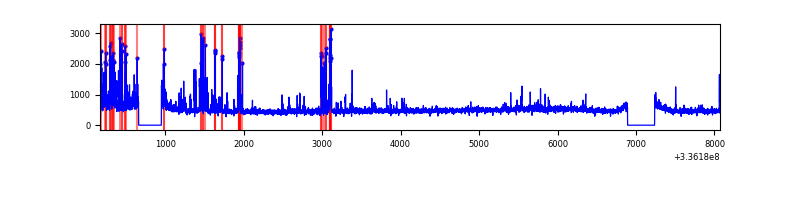 |
| D | 7901 | 7266 | 2355 | 2355 | 29.81% | 32.41% | 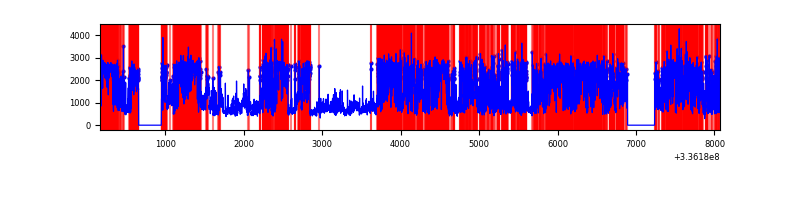 |
Top three noisy pixels from each quadrant. If the there are fewer than three noisy pixels in the level2.evt file, extra rows are filled as -1
| Pixel properties | Quadrant properties | ||||||
|---|---|---|---|---|---|---|---|
| Quadrant | DetID | PixID | Counts | Sigma | Mean | Median | Sigma |
| A | 0 | 13 | 108928 | 622.89 | 867 | 848 | 173.5 |
| A | 6 | 16 | 62704 | 356.49 | 867 | 848 | 173.5 |
| A | 5 | 168 | 50915 | 288.55 | 867 | 848 | 173.5 |
| B | 5 | 172 | 676596 | 4213.51 | 853 | 831 | 160.4 |
| B | 0 | 189 | 123433 | 764.44 | 853 | 831 | 160.4 |
| B | 3 | 112 | 40608 | 248.01 | 853 | 831 | 160.4 |
| C | 4 | 254 | 411034 | 2098.72 | 833 | 838 | 195.4 |
| C | 14 | 238 | 134036 | 681.49 | 833 | 838 | 195.4 |
| C | 3 | 233 | 132521 | 673.74 | 833 | 838 | 195.4 |
| D | 7 | 80 | 5863452 | 35319.42 | 682 | 661 | 166.0 |
| D | 1 | 52 | 2047326 | 12329.8 | 682 | 661 | 166.0 |
| D | 2 | 250 | 310552 | 1866.89 | 682 | 661 | 166.0 |
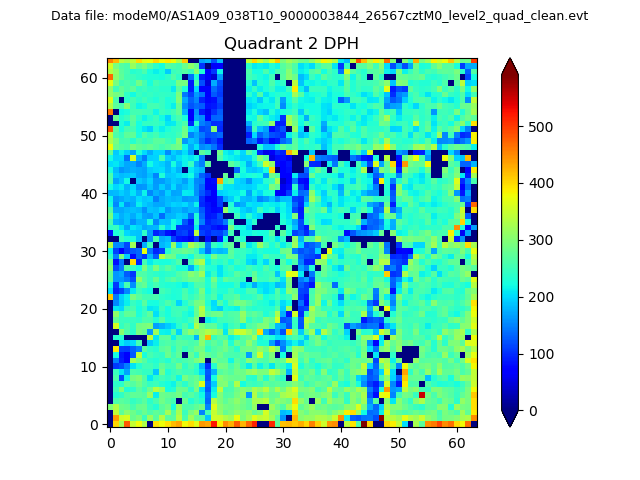
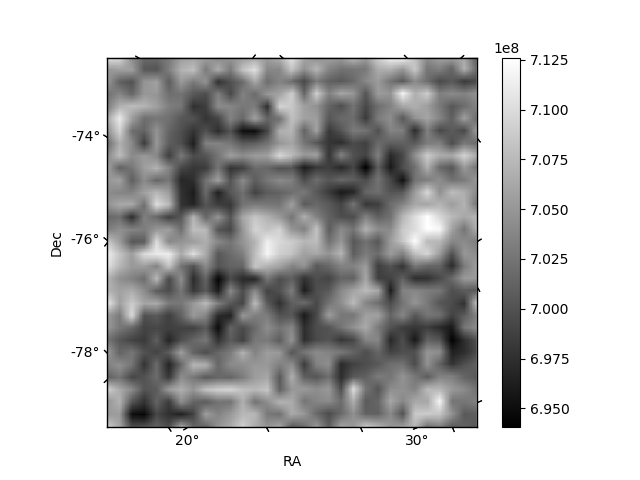
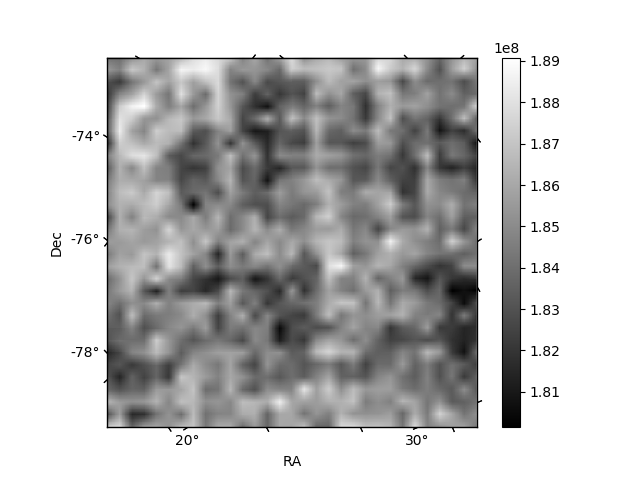
Histogram calculated using DETX and DETY for each event in the final _common_clean file
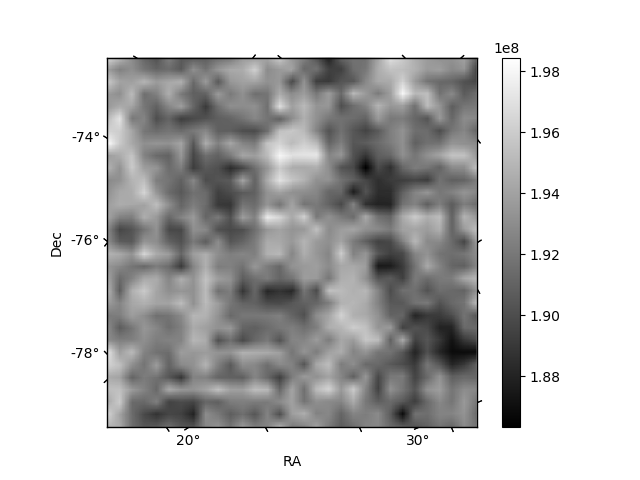
| Quadrant A | 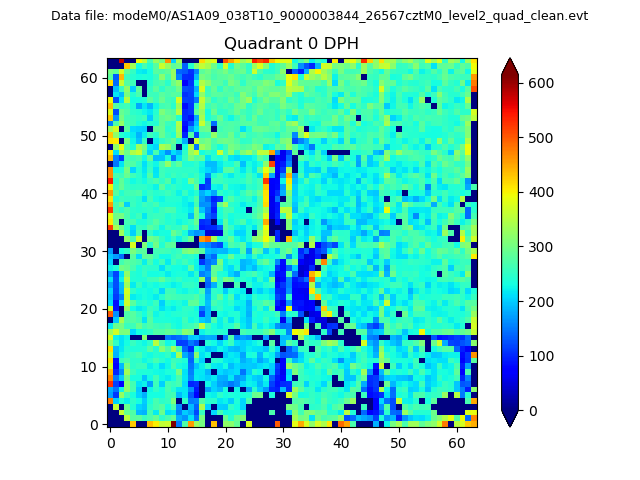 |
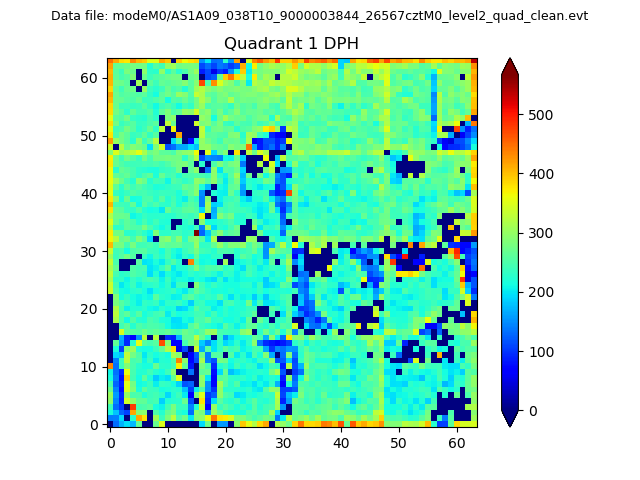 |
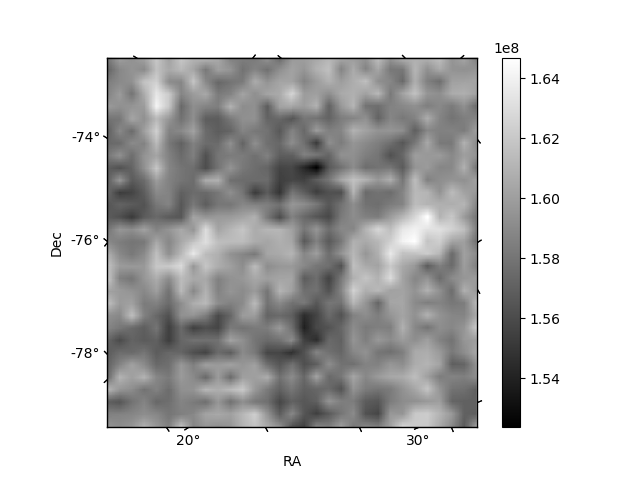
Quadrant B |
|---|---|---|---|
| Quadrant D | 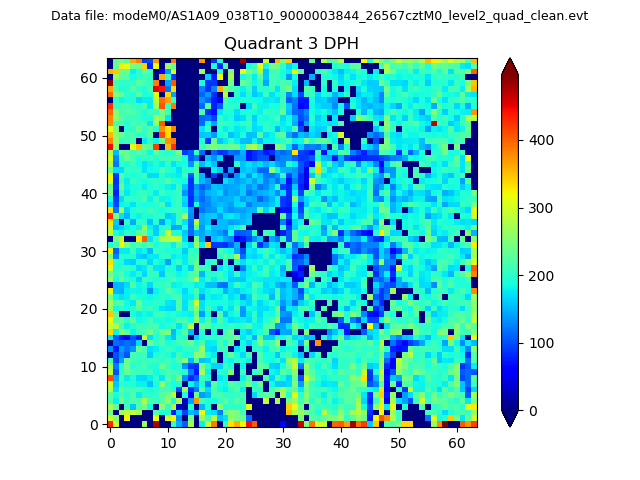 |
 |
Quadrant C |
| Plot type | Count rate plots | Images |
|---|---|---|
| Comparison with Poisson distribution Blue bars denote a histogram of data divided into 1 sec bins. Red curve is a Poisson curve with rate = median count rate of data. |
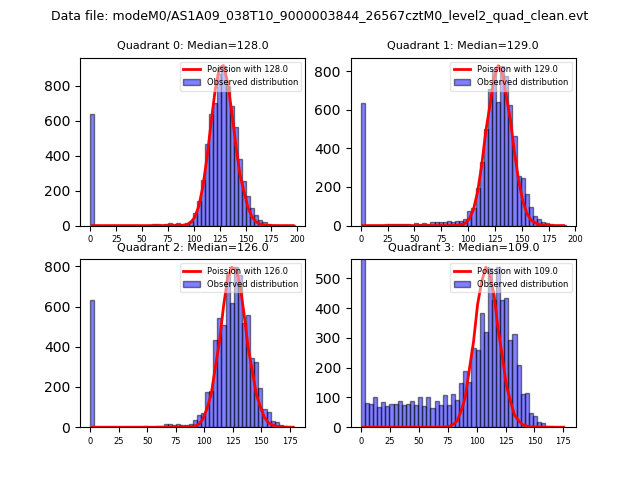 |
 |
| Quadrant-wise count rates Data is divided into 100 sec bins |
 |
|
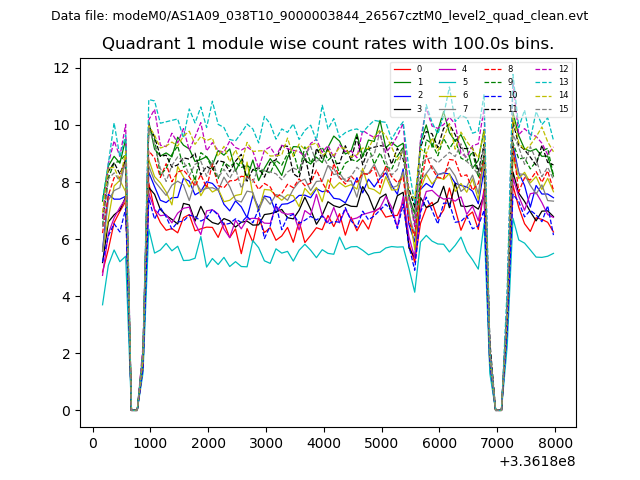
| Module-wise count rates for Quadrant A Data is divided into 100 sec bins |
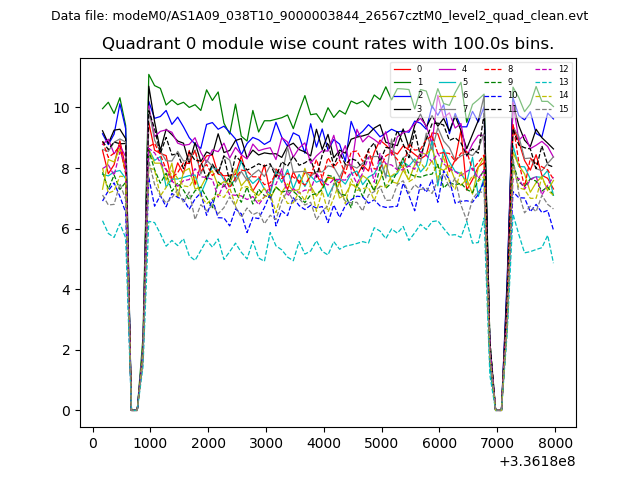 |
 |
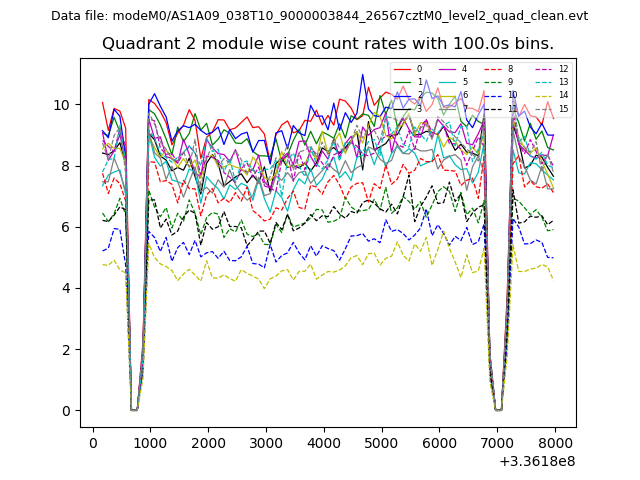
| Module-wise count rates for Quadrant B Data is divided into 100 sec bins |
 |
 |
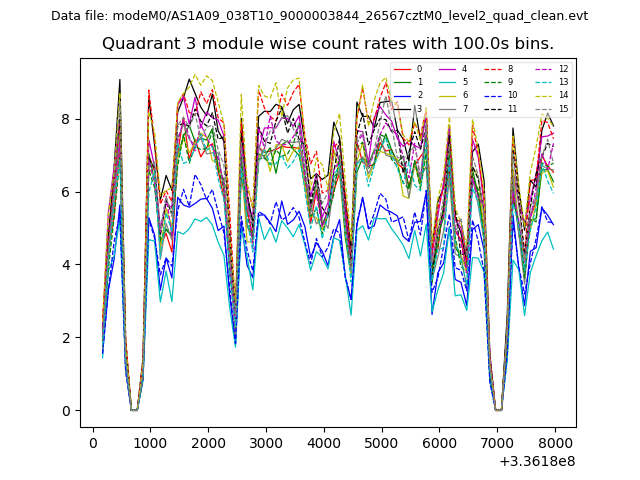
| Module-wise count rates for Quadrant C Data is divided into 100 sec bins |
 |
 |
| Module-wise count rates for Quadrant D Data is divided into 100 sec bins |
 |
 |
| Parameter | Plot |
|---|---|
| CZT HV Monitor | 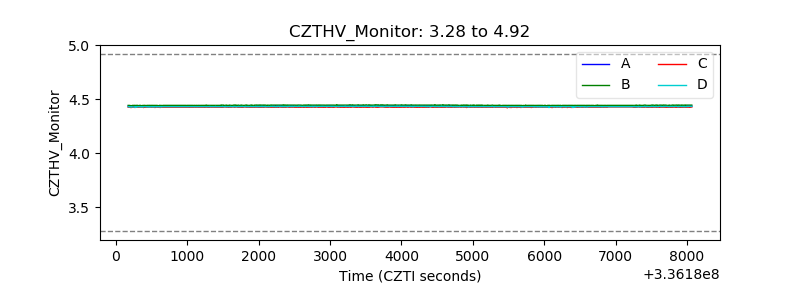 |
| D_VDD | 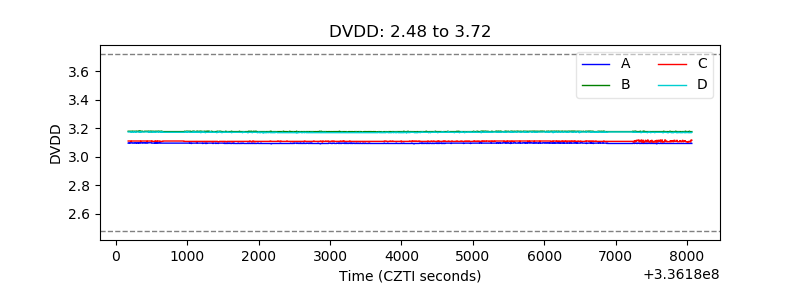 |
| Temperature 1 | 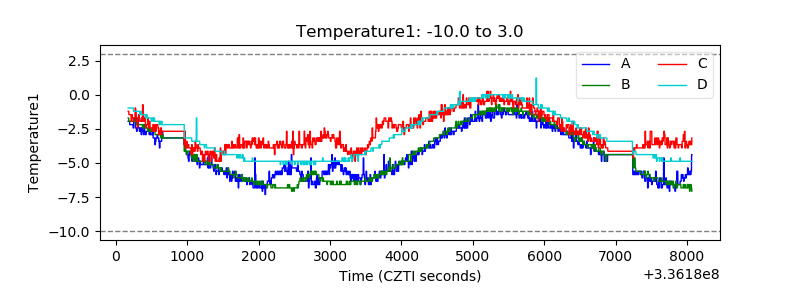 |
| Veto HV Monitor | 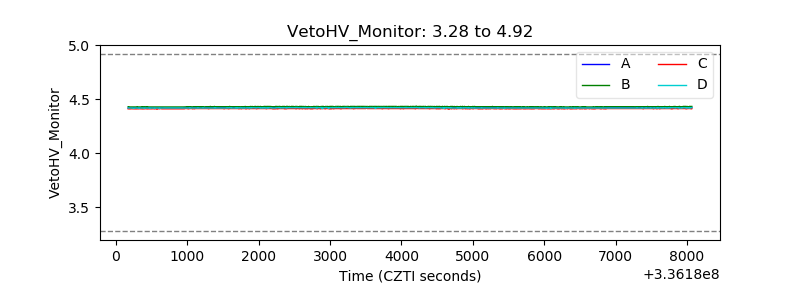 |
| Veto LLD | 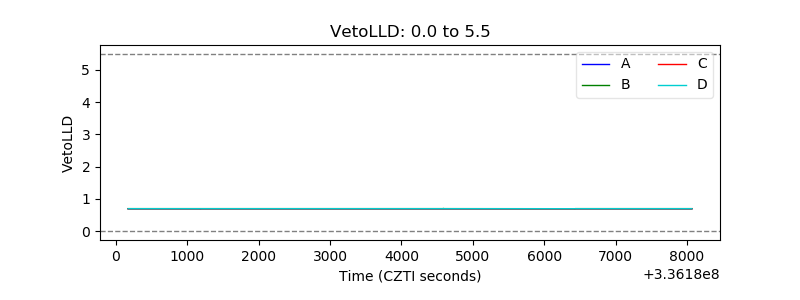 |
| Alpha Counter | 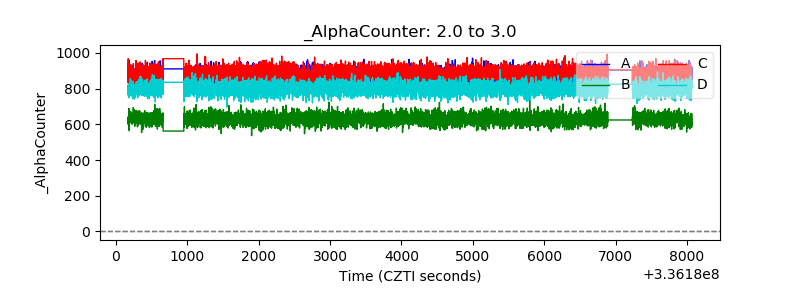 |
| _CPM_Rate | 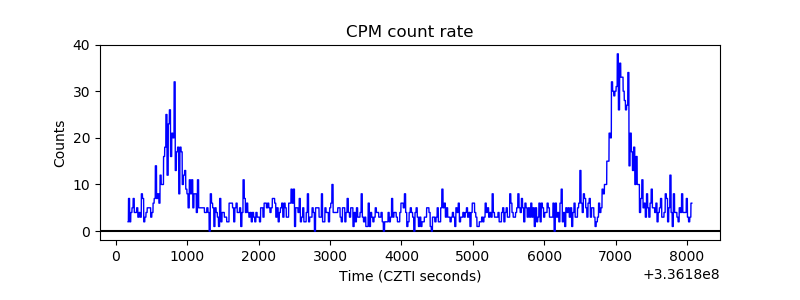 |
| CZT Counter | 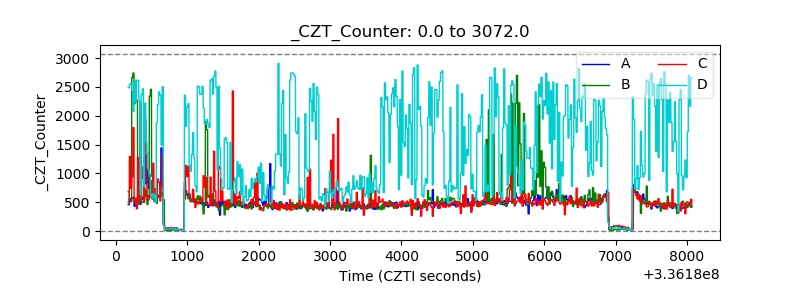 |
| +2.5 Volts monitor | 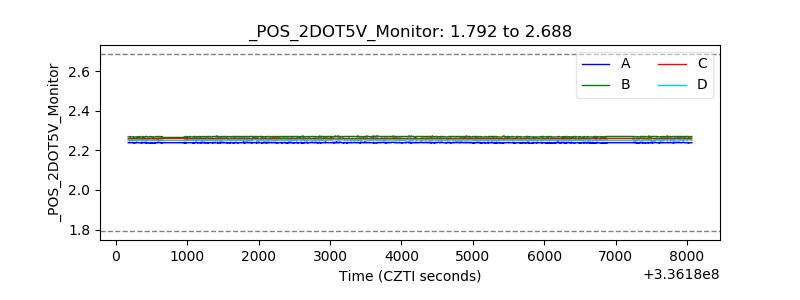 |
| +5 Volts monitor |  |
| _ROLL_ROT | 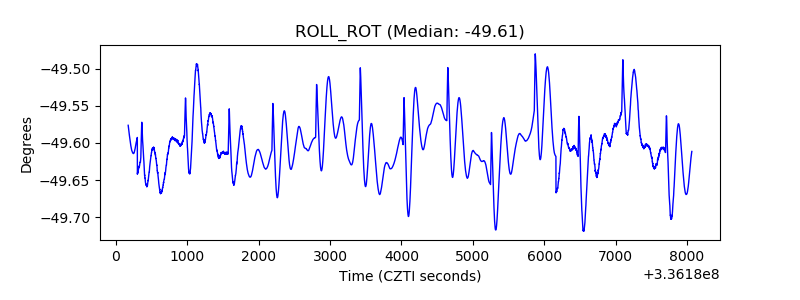 |
| _Roll_DEC | 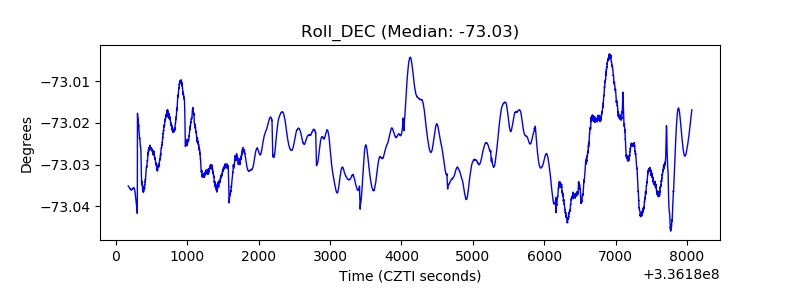 |
| _Roll_RA | 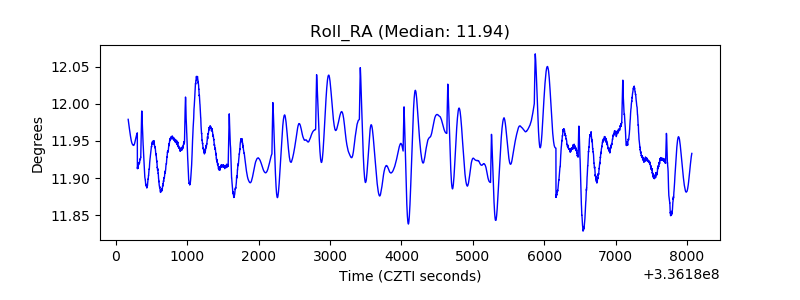 |
| Veto Counter | 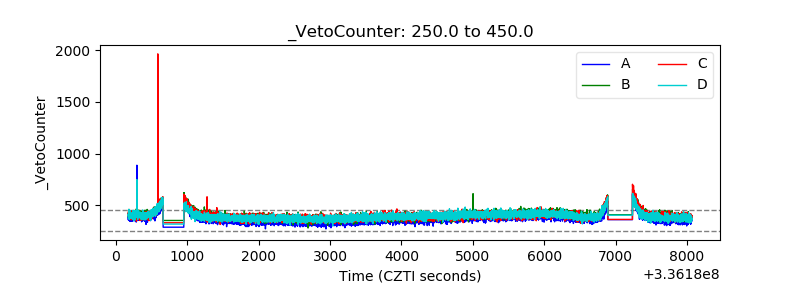 |