| Param | Original file | Final file |
|---|---|---|
| Filename | modeM0/AS1A09_038T10_9000003844_26571cztM0_level2.evt | modeM0/AS1A09_038T10_9000003844_26571cztM0_level2_quad_clean.evt |
| Size (bytes) | 133,234,560 | 22,472,640 |
| Size | 127.1 MB | 21.4 MB |
| Events in quadrant A | 608,124 | 158,857 |
| Events in quadrant B | 648,226 | 161,269 |
| Events in quadrant C | 608,999 | 155,106 |
| Events in quadrant D | 2,083,649 | 112,264 |
| Mode M0 | |||
|---|---|---|---|
| Quadrant | BADHDUFLAG | Total packets | Discarded packets |
| A | 0 | 2614 | 0 |
| B | 0 | 2719 | 0 |
| C | 0 | 2599 | 0 |
| D | 0 | 7046 | 0 |
| Mode M9 | |||
|---|---|---|---|
| Quadrant | BADHDUFLAG | Total packets | Discarded packets |
| A | 0 | 3 | 0 |
| B | 0 | 3 | 0 |
| C | 0 | 3 | 0 |
| D | 0 | 3 | 0 |
| Quadrant | Total seconds | Saturated seconds | Saturation percentage |
|---|---|---|---|
| A | 1224 | 20 | 1.633987% |
| B | 1225 | 53 | 4.326531% |
| C | 1225 | 55 | 4.489796% |
| D | 1225 | 626 | 51.102041% |
Noise dominated data is calculated using 1-second bins in cleaned event files. If a bin has >2000 counts, and if more than 50% of those come from <1% of pixels, then it is considered to be noise-dominated and hence unusable.
| Quadrant | # 1 sec bins | Bins with >0 counts | Bins with >2000 counts | High rate bins dominated by noise | Noise dominated (total time) | Noise dominated (detector-on time) | Marked lightcurve |
|---|---|---|---|---|---|---|---|
| A | 1569 | 1225 | 0 | 0 | 0.00% | 0.00% | 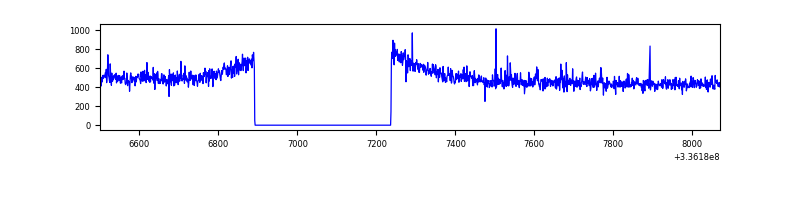 |
| B | 1570 | 1226 | 7 | 7 | 0.45% | 0.57% | 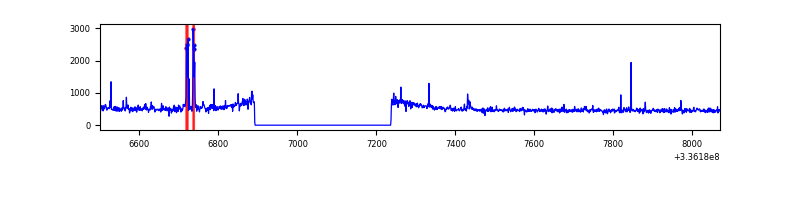 |
| C | 1570 | 1226 | 0 | 0 | 0.00% | 0.00% | 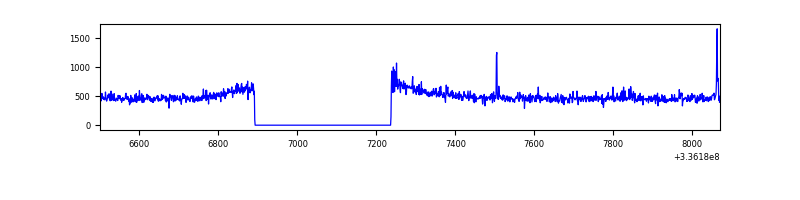 |
| D | 1570 | 1225 | 459 | 459 | 29.24% | 37.47% | 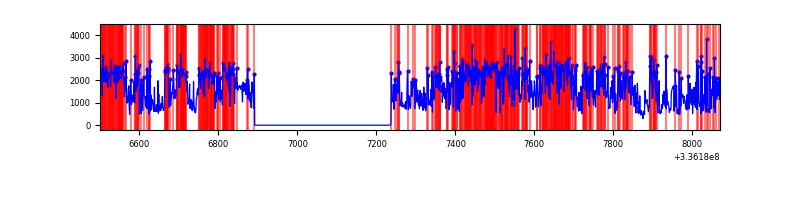 |
Top three noisy pixels from each quadrant. If the there are fewer than three noisy pixels in the level2.evt file, extra rows are filled as -1
| Pixel properties | Quadrant properties | ||||||
|---|---|---|---|---|---|---|---|
| Quadrant | DetID | PixID | Counts | Sigma | Mean | Median | Sigma |
| A | 5 | 168 | 11134 | 340.03 | 150 | 147 | 32.3 |
| A | 0 | 13 | 9597 | 292.46 | 150 | 147 | 32.3 |
| A | 6 | 16 | 7823 | 237.56 | 150 | 147 | 32.3 |
| B | 5 | 172 | 30810 | 1012.71 | 152 | 148 | 30.3 |
| B | 3 | 112 | 9080 | 295.01 | 152 | 148 | 30.3 |
| B | 0 | 245 | 4714 | 150.81 | 152 | 148 | 30.3 |
| C | 14 | 238 | 23269 | 639.71 | 145 | 145 | 36.1 |
| C | 3 | 233 | 9148 | 249.06 | 145 | 145 | 36.1 |
| C | 4 | 254 | 6462 | 174.76 | 145 | 145 | 36.1 |
| D | 7 | 80 | 1072480 | 36911.58 | 111 | 107 | 29.1 |
| D | 1 | 52 | 550110 | 18931.36 | 111 | 107 | 29.1 |
| D | 2 | 250 | 21698 | 743.17 | 111 | 107 | 29.1 |
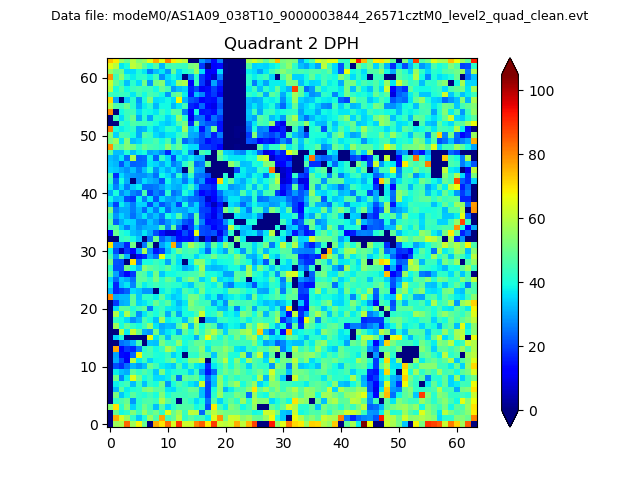
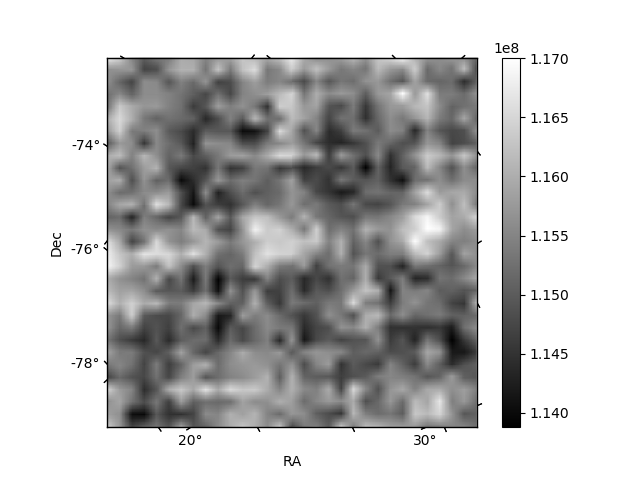
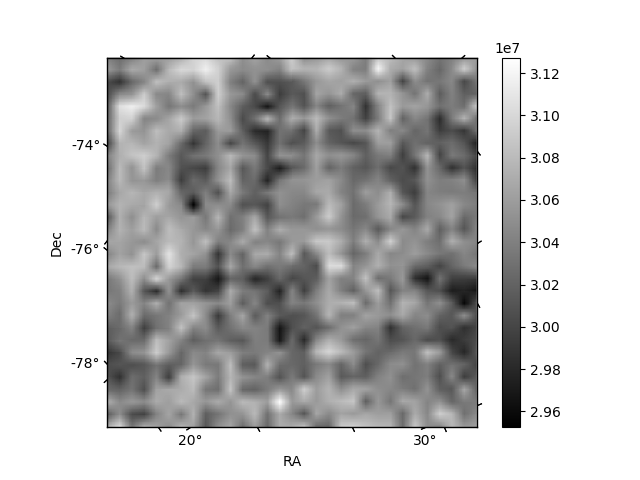
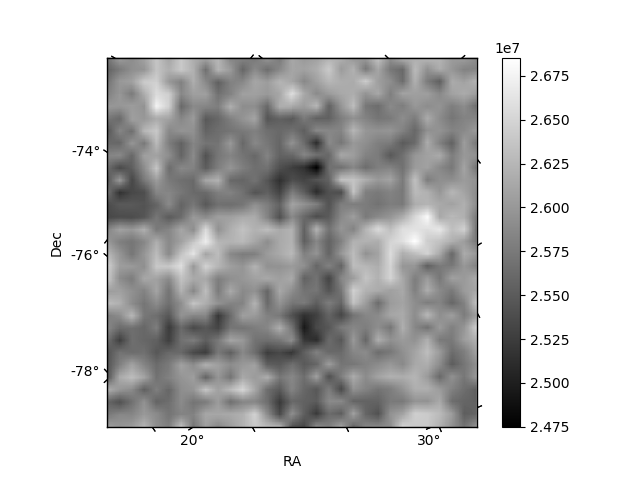
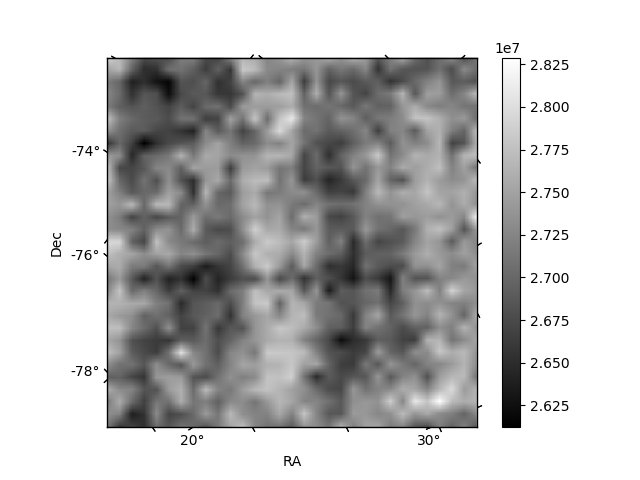
Histogram calculated using DETX and DETY for each event in the final _common_clean file
| Quadrant A | 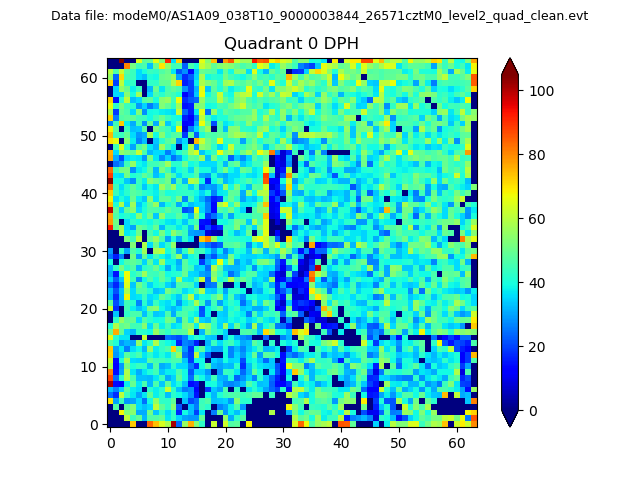 |
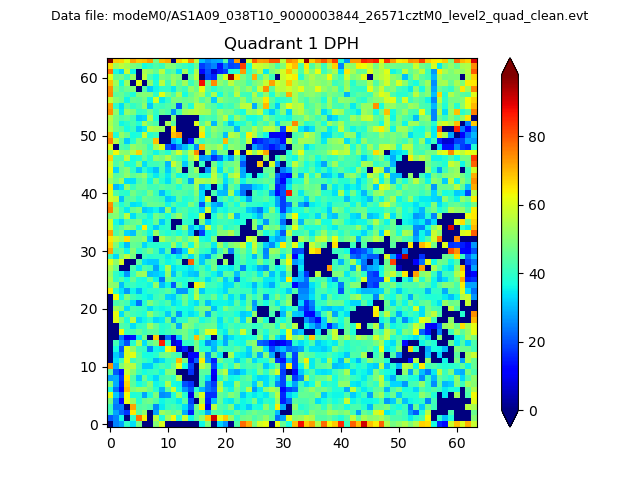 |
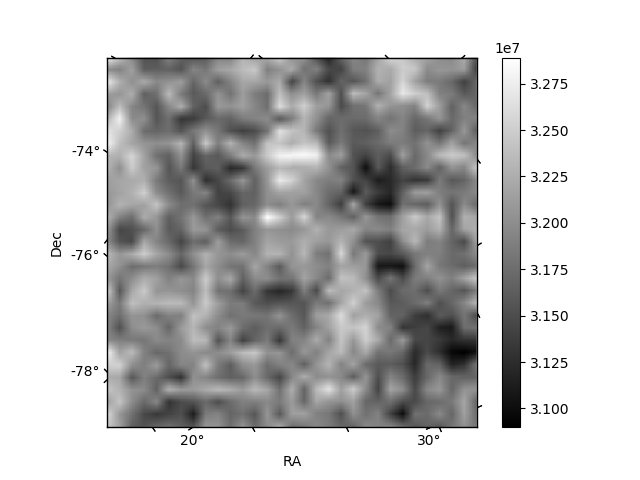
Quadrant B |
|---|---|---|---|
| Quadrant D | 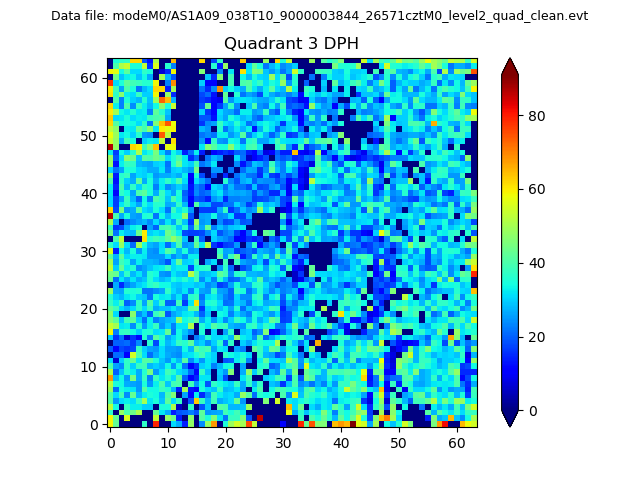 |
 |
Quadrant C |
| Plot type | Count rate plots | Images |
|---|---|---|
| Comparison with Poisson distribution Blue bars denote a histogram of data divided into 1 sec bins. Red curve is a Poisson curve with rate = median count rate of data. |
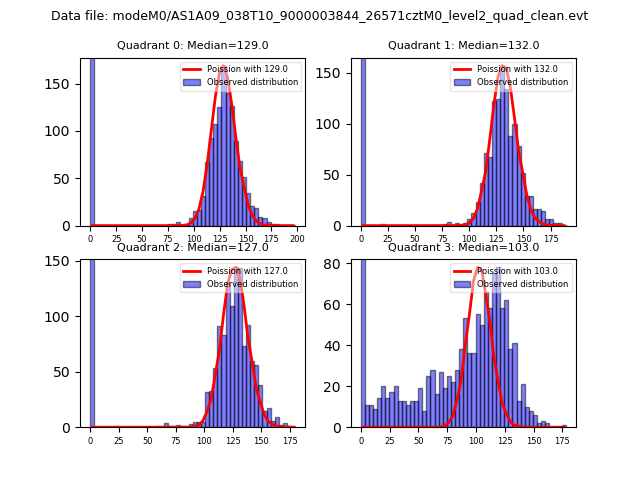 |
 |
| Quadrant-wise count rates Data is divided into 100 sec bins |
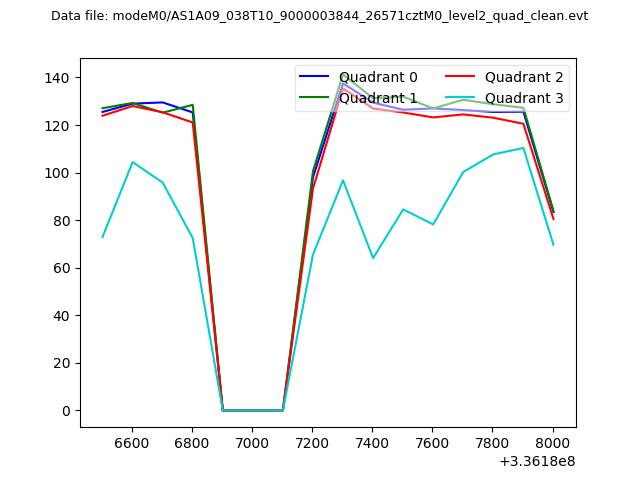 |
|
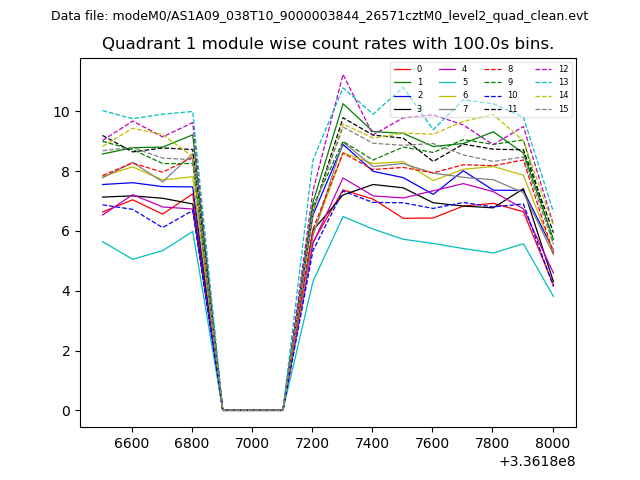
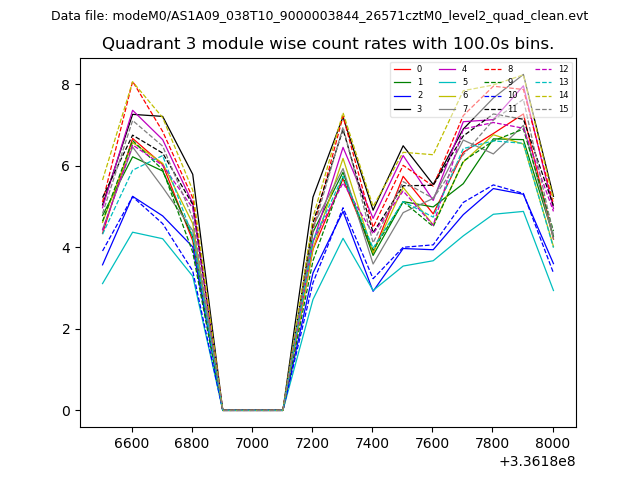
| Module-wise count rates for Quadrant A Data is divided into 100 sec bins |
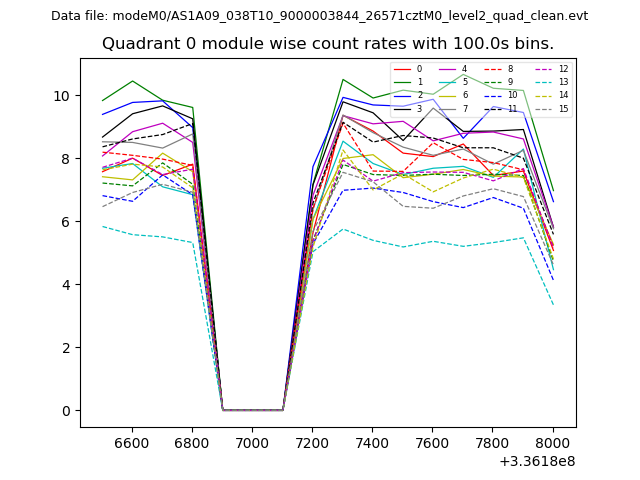 |
 |
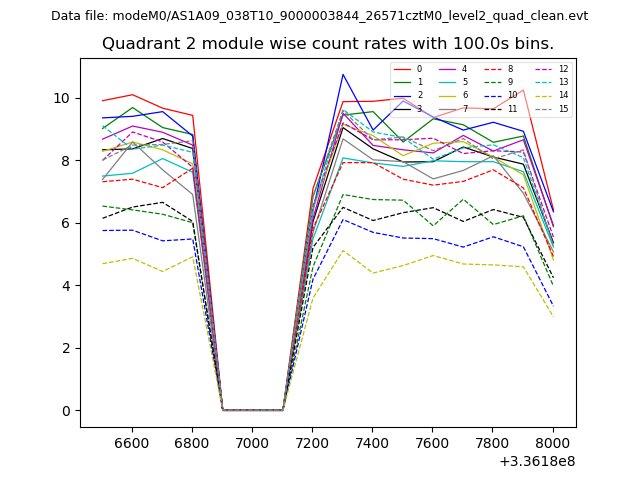
| Module-wise count rates for Quadrant B Data is divided into 100 sec bins |
 |
 |
| Module-wise count rates for Quadrant C Data is divided into 100 sec bins |
 |
 |
| Module-wise count rates for Quadrant D Data is divided into 100 sec bins |
 |
 |
| Parameter | Plot |
|---|---|
| CZT HV Monitor | 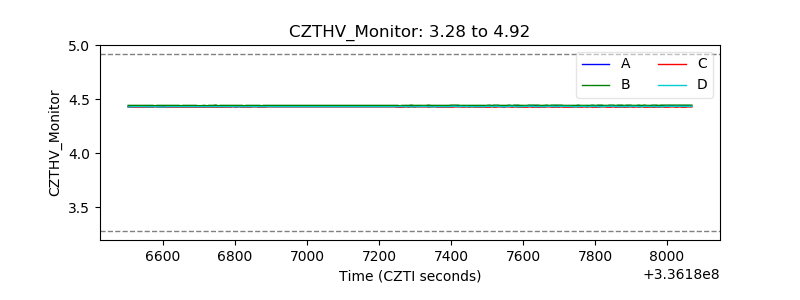 |
| D_VDD | 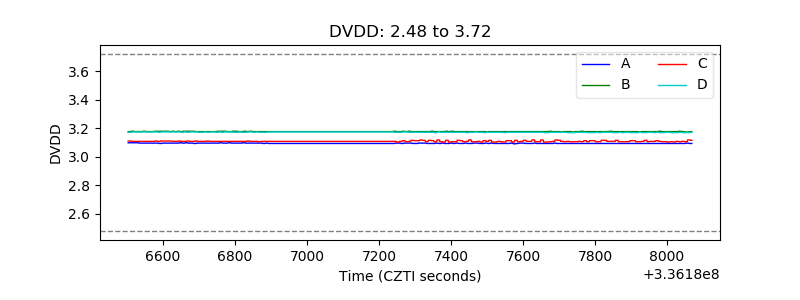 |
| Temperature 1 | 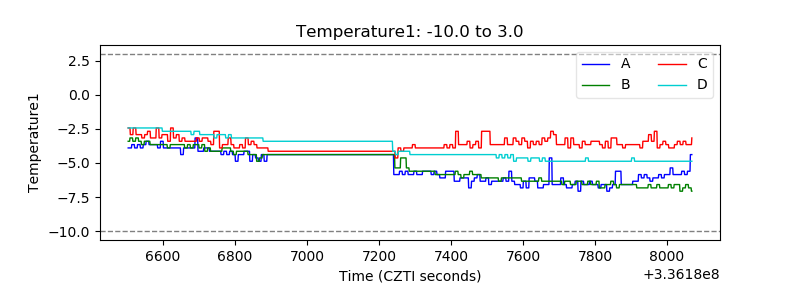 |
| Veto HV Monitor | 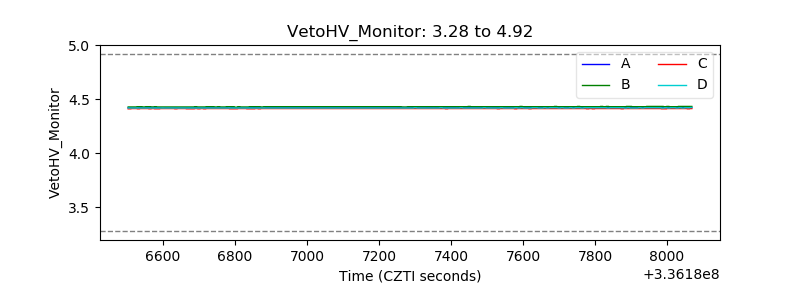 |
| Veto LLD | 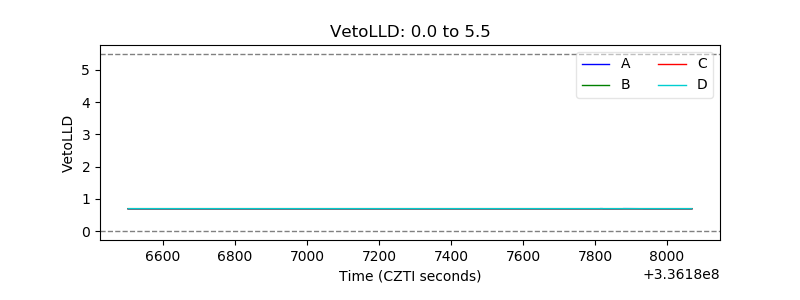 |
| Alpha Counter | 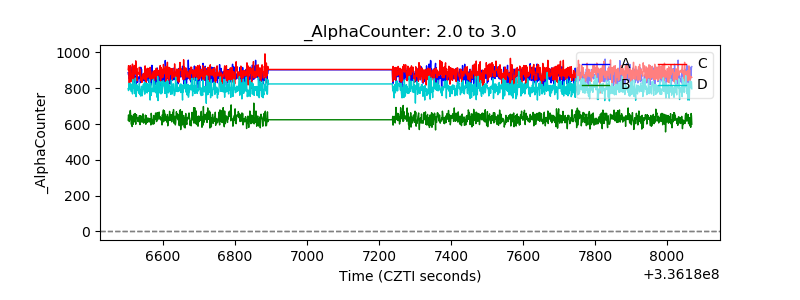 |
| _CPM_Rate | 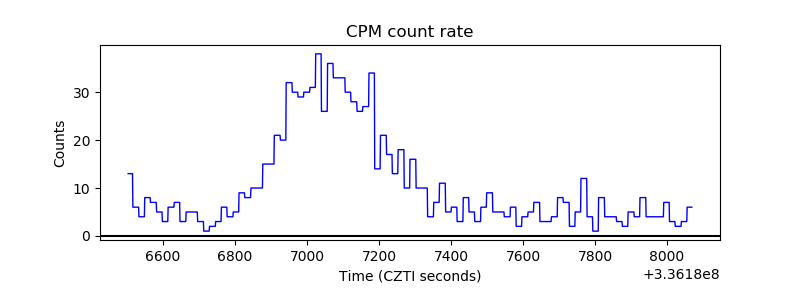 |
| CZT Counter | 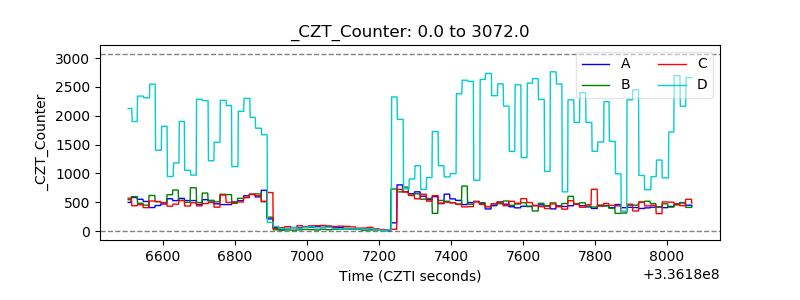 |
| +2.5 Volts monitor |  |
| +5 Volts monitor |  |
| _ROLL_ROT | 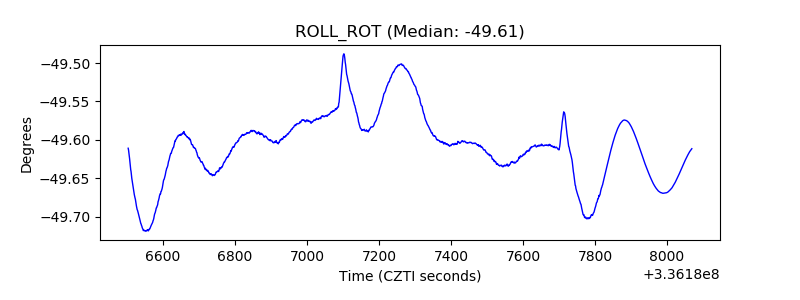 |
| _Roll_DEC | 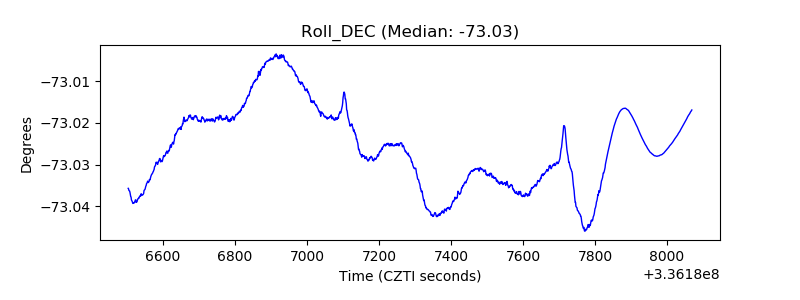 |
| _Roll_RA | 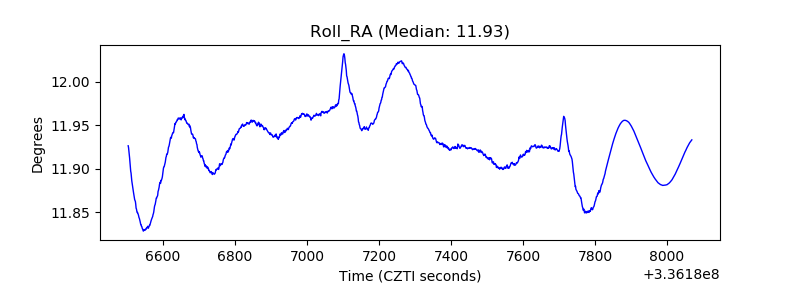 |
| Veto Counter | 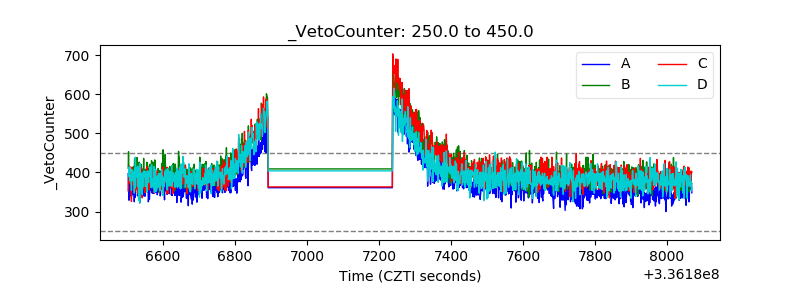 |