| Param | Original file | Final file |
|---|---|---|
| Filename | modeM0/AS1T03_220T01_9000003842cztM0_level2.fits | modeM0/AS1T03_220T01_9000003842cztM0_level2_quad_clean.evt |
| Size (bytes) | 540,961,920 | 443,669,760 |
| Size | 515.9 MB | 423.1 MB |
| Events in quadrant A | 3,498,998 | 2,673,666 |
| Events in quadrant B | 3,275,410 | 2,658,791 |
| Events in quadrant C | 3,264,890 | 2,529,166 |
| Events in quadrant D | 2,666,330 | 1,901,747 |
| Mode SS | |||
|---|---|---|---|
| Quadrant | BADHDUFLAG | Total packets | Discarded packets |
| A | 0 | 1092 | 0 |
| B | 0 | 1092 | 0 |
| C | 0 | 1092 | 0 |
| D | 0 | 1092 | 0 |
| Mode M0 | |||
|---|---|---|---|
| Quadrant | BADHDUFLAG | Total packets | Discarded packets |
| A | 0 | 114284 | 0 |
| B | 0 | 126611 | 0 |
| C | 0 | 145766 | 0 |
| D | 0 | 217298 | 0 |
| Mode M9 | |||
|---|---|---|---|
| Quadrant | BADHDUFLAG | Total packets | Discarded packets |
| A | 0 | 105 | 0 |
| B | 0 | 105 | 0 |
| C | 0 | 105 | 0 |
| D | 0 | 105 | 0 |
| Quadrant | Total seconds | Saturated seconds | Saturation percentage |
|---|---|---|---|
| A | 53496 | 635 | 1.187005% |
| B | 53496 | 1531 | 2.861896% |
| C | 53496 | 4528 | 8.464184% |
| D | 53496 | 11241 | 21.012786% |
Noise dominated data is calculated using 1-second bins in cleaned event files. If a bin has >2000 counts, and if more than 50% of those come from <1% of pixels, then it is considered to be noise-dominated and hence unusable.
| Quadrant | # 1 sec bins | Bins with >0 counts | Bins with >2000 counts | High rate bins dominated by noise | Noise dominated (total time) | Noise dominated (detector-on time) | Marked lightcurve |
|---|---|---|---|---|---|---|---|
| A | 64056 | 53485 | 0 | 0 | 0.00% | 0.00% |  |
| B | 64056 | 53481 | 0 | 0 | 0.00% | 0.00% |  |
| C | 64056 | 53380 | 0 | 0 | 0.00% | 0.00% | 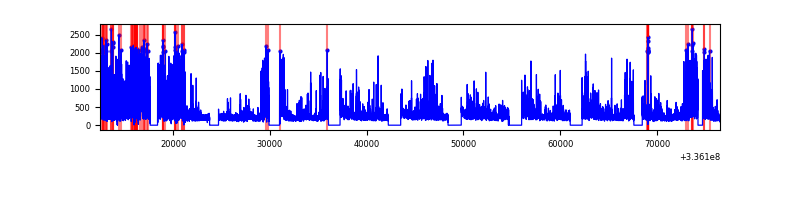 |
| D | 64056 | 53129 | 0 | 0 | 0.00% | 0.00% | 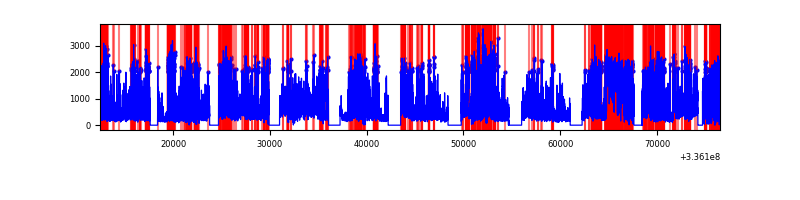 |
Top three noisy pixels from each quadrant. If the there are fewer than three noisy pixels in the level2.evt file, extra rows are filled as -1
| Pixel properties | Quadrant properties | ||||||
|---|---|---|---|---|---|---|---|
| Quadrant | DetID | PixID | Counts | Sigma | Mean | Median | Sigma |
| A | 0 | 29 | 2945 | 9.43 | 911 | 863 | 220.9 |
| A | 7 | 110 | 2842 | 8.96 | 911 | 863 | 220.9 |
| A | 9 | 19 | 2675 | 8.2 | 911 | 863 | 220.9 |
| B | 2 | 9 | 2677 | 10.91 | 869 | 835 | 168.9 |
| B | 2 | 8 | 2220 | 8.2 | 869 | 835 | 168.9 |
| B | 5 | 128 | 2168 | 7.89 | 869 | 835 | 168.9 |
| C | 1 | 81 | 2628 | 8.31 | 862 | 813 | 218.4 |
| C | 1 | 80 | 2537 | 7.89 | 862 | 813 | 218.4 |
| C | 12 | 241 | 2303 | 6.82 | 862 | 813 | 218.4 |
| D | 10 | 189 | 1963 | 6.39 | 760 | 700 | 197.5 |
| D | 6 | 231 | 1935 | 6.25 | 760 | 700 | 197.5 |
| D | 3 | 14 | 1833 | 5.74 | 760 | 700 | 197.5 |
Histogram calculated using DETX and DETY for each event in the final _common_clean file
| Quadrant A |  |
 |
Quadrant B |
|---|---|---|---|
| Quadrant D | 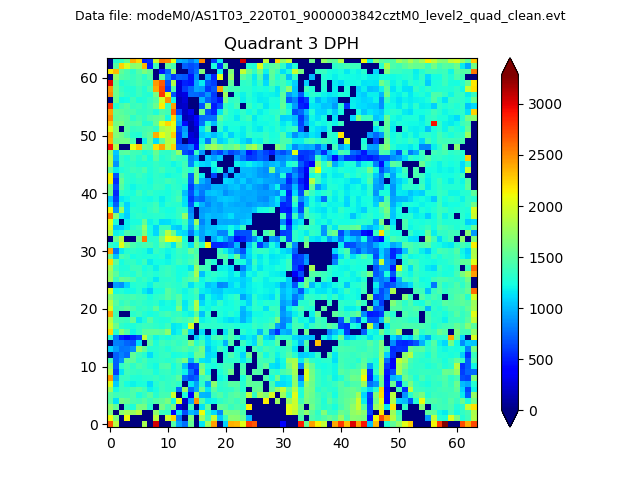 |
 |
Quadrant C |
| Plot type | Count rate plots | Images |
|---|---|---|
| Comparison with Poisson distribution Blue bars denote a histogram of data divided into 1 sec bins. Red curve is a Poisson curve with rate = median count rate of data. |
 |
 |
| Quadrant-wise count rates Data is divided into 100 sec bins |
 |
|
| Module-wise count rates for Quadrant A Data is divided into 100 sec bins |
 |
 |
| Module-wise count rates for Quadrant B Data is divided into 100 sec bins |
 |
 |
| Module-wise count rates for Quadrant C Data is divided into 100 sec bins |
 |
 |
| Module-wise count rates for Quadrant D Data is divided into 100 sec bins |
 |
 |
| Parameter | Plot |
|---|---|
| CZT HV Monitor |  |
| D_VDD |  |
| Temperature 1 |  |
| Veto HV Monitor |  |
| Veto LLD | 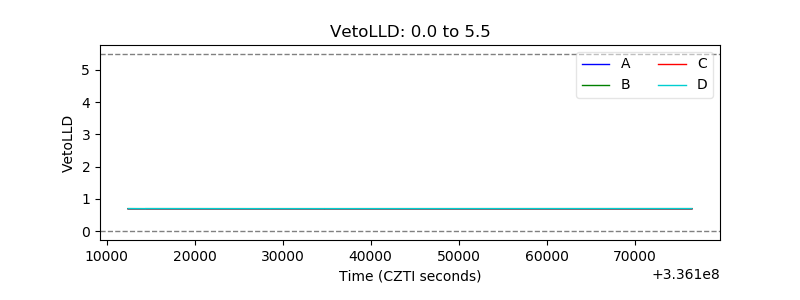 |
| Alpha Counter |  |
| _CPM_Rate |  |
| CZT Counter |  |
| +2.5 Volts monitor |  |
| +5 Volts monitor |  |
| _ROLL_ROT |  |
| _Roll_DEC |  |
| _Roll_RA |  |
| Veto Counter |  |