| Param | Original file | Final file |
|---|---|---|
| Filename | modeM0/AS1T03_220T01_9000003842_26555cztM0_level2.evt | modeM0/AS1T03_220T01_9000003842_26555cztM0_level2_quad_clean.evt |
| Size (bytes) | 686,885,760 | 96,632,640 |
| Size | 655.1 MB | 92.2 MB |
| Events in quadrant A | 3,267,988 | 642,809 |
| Events in quadrant B | 3,160,095 | 661,518 |
| Events in quadrant C | 7,777,420 | 553,434 |
| Events in quadrant D | 6,143,951 | 601,342 |
| Mode M0 | |||
|---|---|---|---|
| Quadrant | BADHDUFLAG | Total packets | Discarded packets |
| A | 0 | 14128 | 0 |
| B | 0 | 13718 | 0 |
| C | 0 | 27698 | 0 |
| D | 0 | 22928 | 0 |
| Mode M9 | |||
|---|---|---|---|
| Quadrant | BADHDUFLAG | Total packets | Discarded packets |
| A | 0 | 8 | 0 |
| B | 0 | 8 | 0 |
| C | 0 | 8 | 0 |
| D | 0 | 8 | 0 |
| Quadrant | Total seconds | Saturated seconds | Saturation percentage |
|---|---|---|---|
| A | 6692 | 38 | 0.567842% |
| B | 6692 | 55 | 0.821877% |
| C | 6692 | 1877 | 28.048416% |
| D | 6692 | 800 | 11.954573% |
Noise dominated data is calculated using 1-second bins in cleaned event files. If a bin has >2000 counts, and if more than 50% of those come from <1% of pixels, then it is considered to be noise-dominated and hence unusable.
| Quadrant | # 1 sec bins | Bins with >0 counts | Bins with >2000 counts | High rate bins dominated by noise | Noise dominated (total time) | Noise dominated (detector-on time) | Marked lightcurve |
|---|---|---|---|---|---|---|---|
| A | 7452 | 6692 | 4 | 4 | 0.05% | 0.06% | 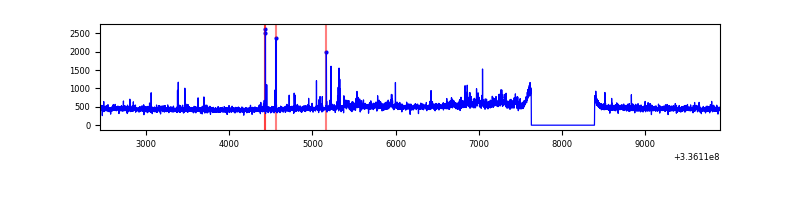 |
| B | 7452 | 6692 | 2 | 2 | 0.03% | 0.03% | 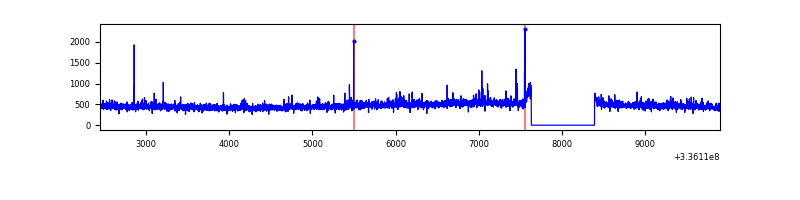 |
| C | 7452 | 6692 | 1493 | 1493 | 20.03% | 22.31% | 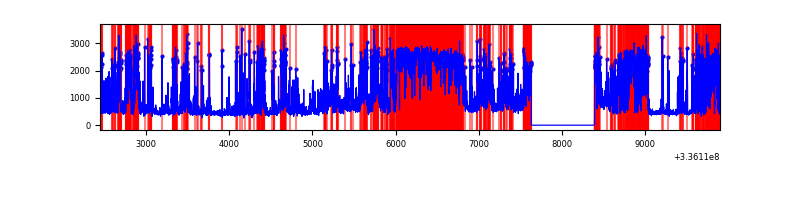 |
| D | 7451 | 6691 | 707 | 707 | 9.49% | 10.57% | 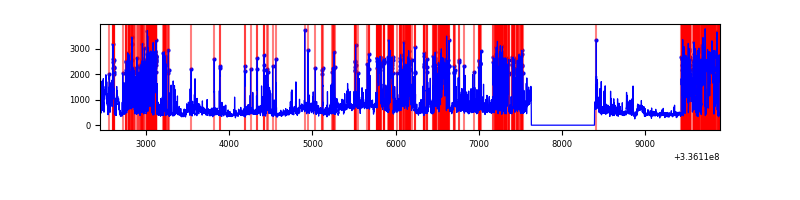 |
Top three noisy pixels from each quadrant. If the there are fewer than three noisy pixels in the level2.evt file, extra rows are filled as -1
| Pixel properties | Quadrant properties | ||||||
|---|---|---|---|---|---|---|---|
| Quadrant | DetID | PixID | Counts | Sigma | Mean | Median | Sigma |
| A | 0 | 13 | 149568 | 937.55 | 787 | 773 | 158.7 |
| A | 5 | 168 | 77608 | 484.13 | 787 | 773 | 158.7 |
| A | 13 | 254 | 11029 | 64.62 | 787 | 773 | 158.7 |
| B | 0 | 229 | 28096 | 181.45 | 786 | 765 | 150.6 |
| B | 3 | 112 | 22292 | 142.92 | 786 | 765 | 150.6 |
| B | 12 | 111 | 18153 | 115.44 | 786 | 765 | 150.6 |
| C | 4 | 254 | 4665027 | 31324.29 | 640 | 645 | 148.9 |
| C | 3 | 233 | 500710 | 3358.25 | 640 | 645 | 148.9 |
| C | 14 | 238 | 101523 | 677.46 | 640 | 645 | 148.9 |
| D | 7 | 80 | 2121924 | 12186.44 | 728 | 710 | 174.1 |
| D | 1 | 52 | 1049637 | 6026.12 | 728 | 710 | 174.1 |
| D | 2 | 250 | 84649 | 482.23 | 728 | 710 | 174.1 |
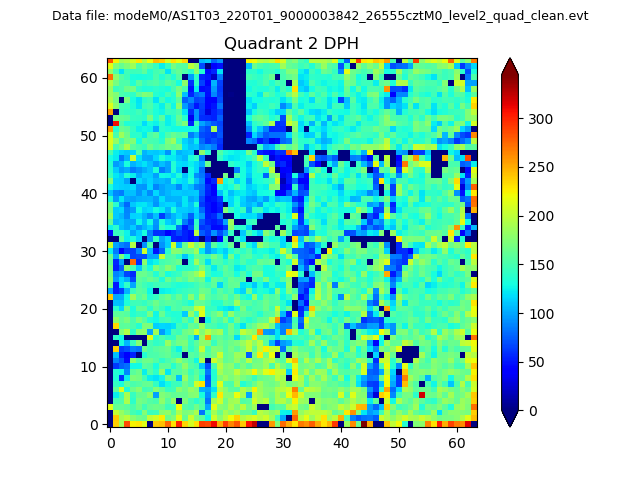
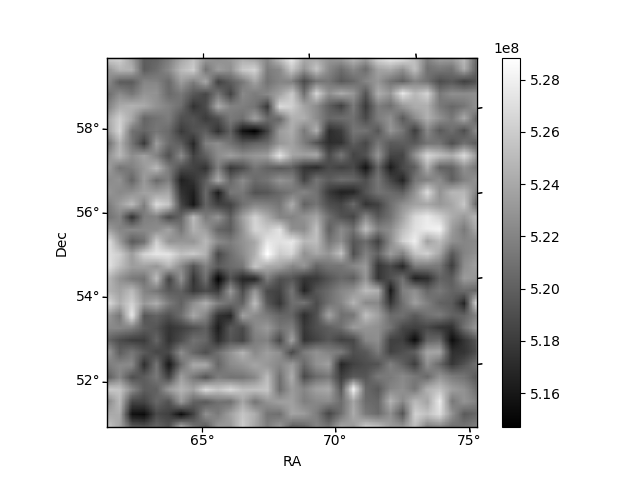
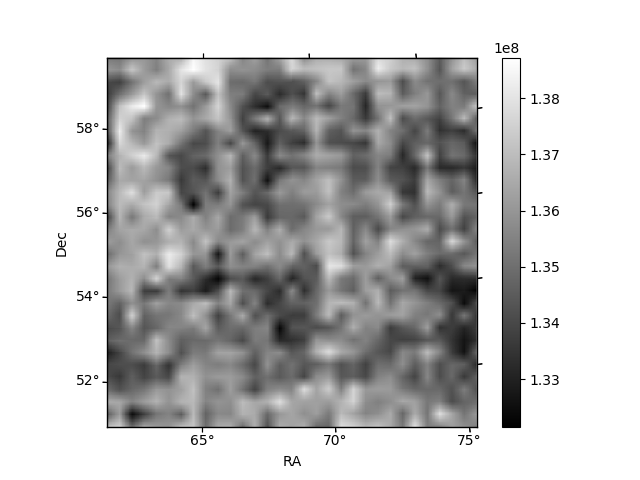
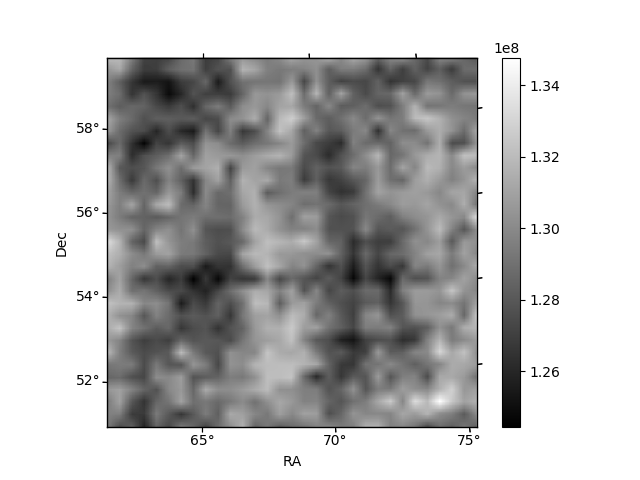
Histogram calculated using DETX and DETY for each event in the final _common_clean file
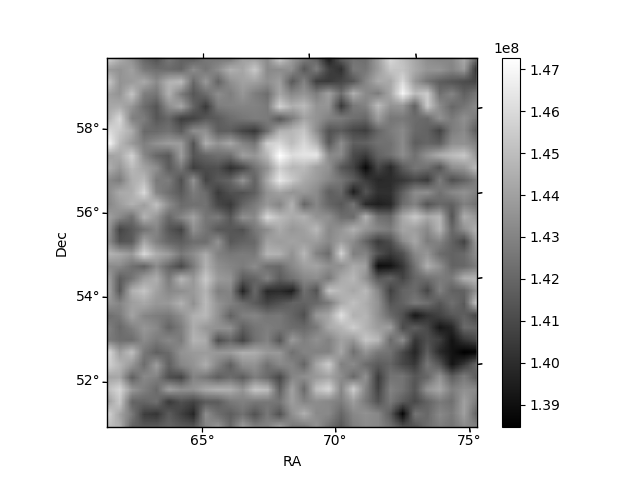
| Quadrant A | 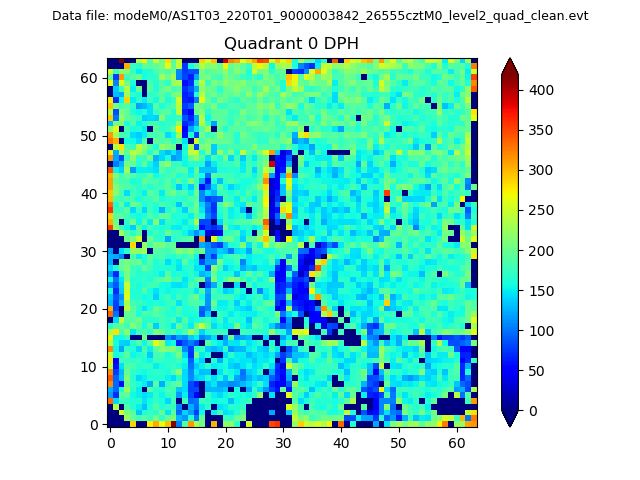 |
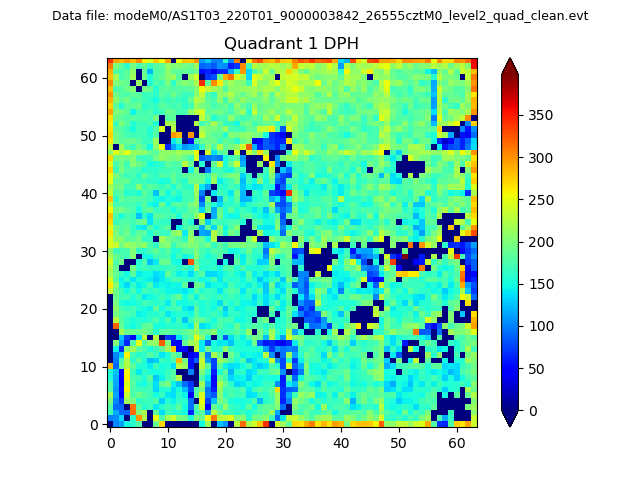 |
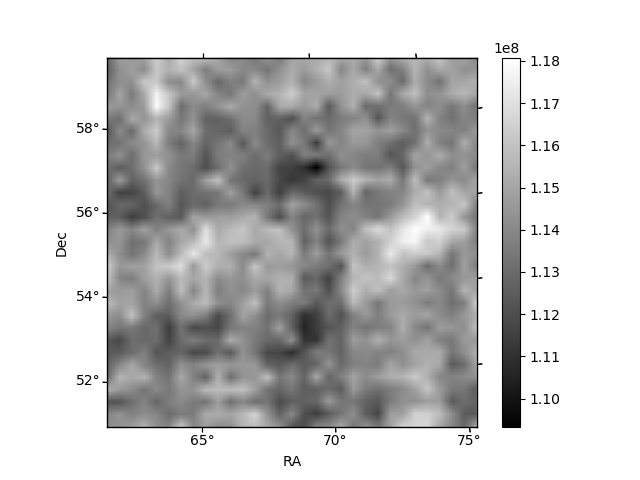
Quadrant B |
|---|---|---|---|
| Quadrant D | 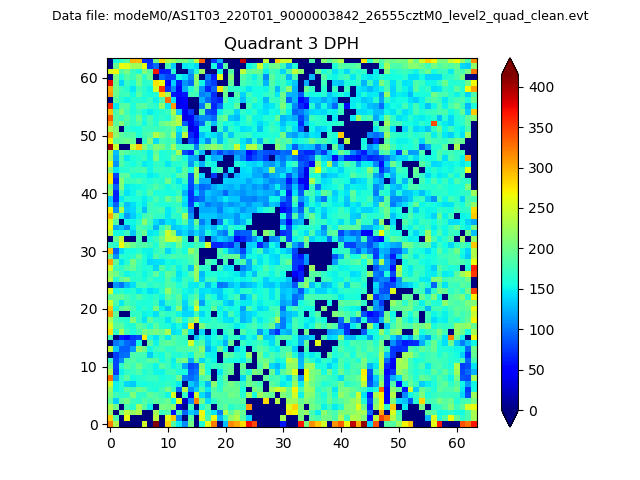 |
 |
Quadrant C |
| Plot type | Count rate plots | Images |
|---|---|---|
| Comparison with Poisson distribution Blue bars denote a histogram of data divided into 1 sec bins. Red curve is a Poisson curve with rate = median count rate of data. |
 |
 |
| Quadrant-wise count rates Data is divided into 100 sec bins |
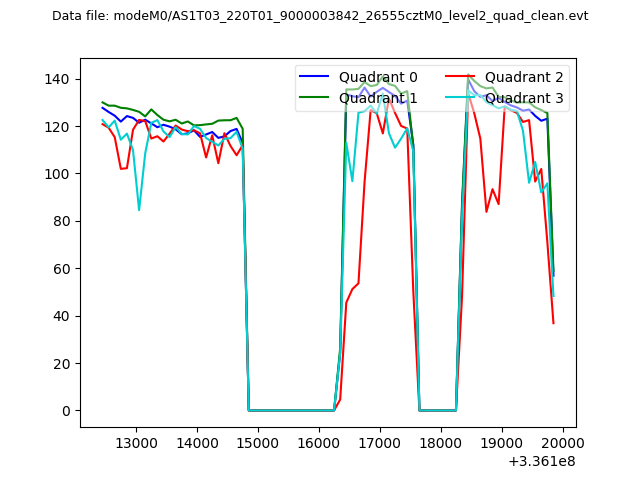 |
|
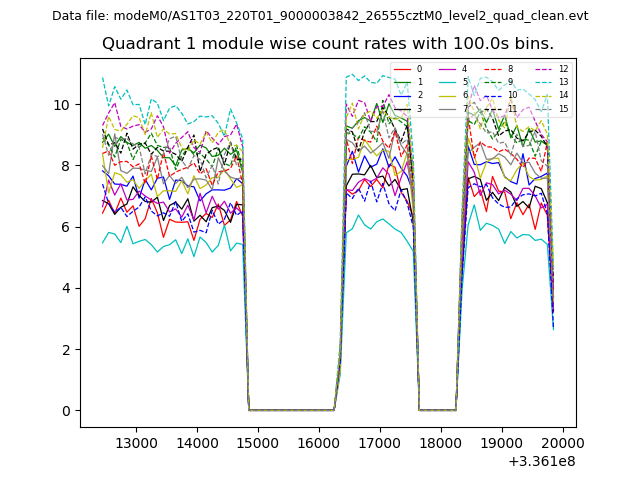
| Module-wise count rates for Quadrant A Data is divided into 100 sec bins |
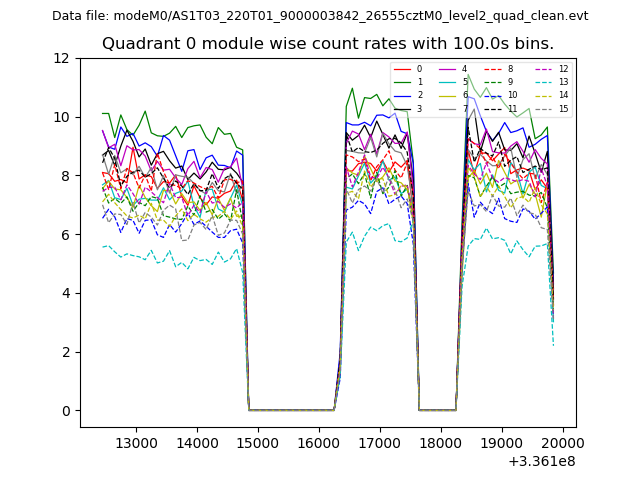 |
 |
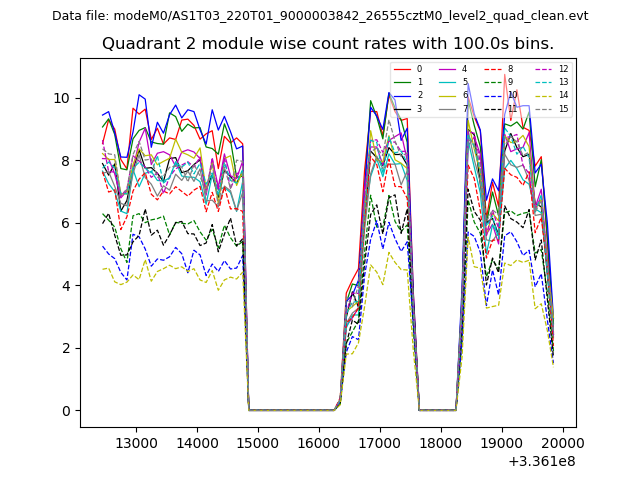
| Module-wise count rates for Quadrant B Data is divided into 100 sec bins |
 |
 |
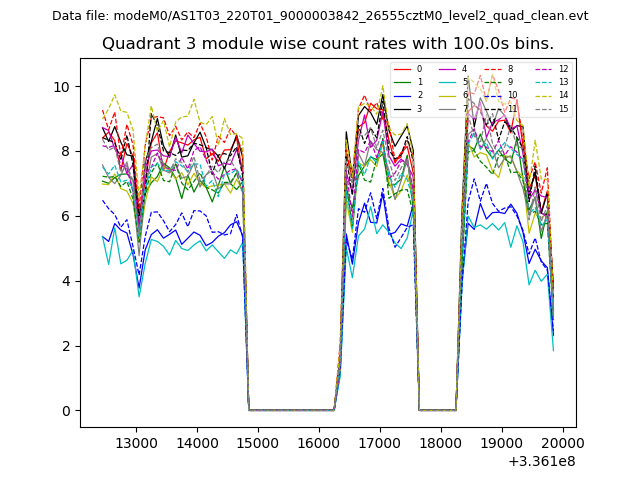
| Module-wise count rates for Quadrant C Data is divided into 100 sec bins |
 |
 |
| Module-wise count rates for Quadrant D Data is divided into 100 sec bins |
 |
 |
| Parameter | Plot |
|---|---|
| CZT HV Monitor | 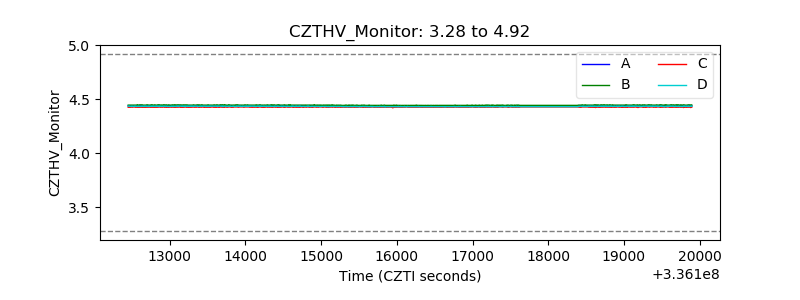 |
| D_VDD | 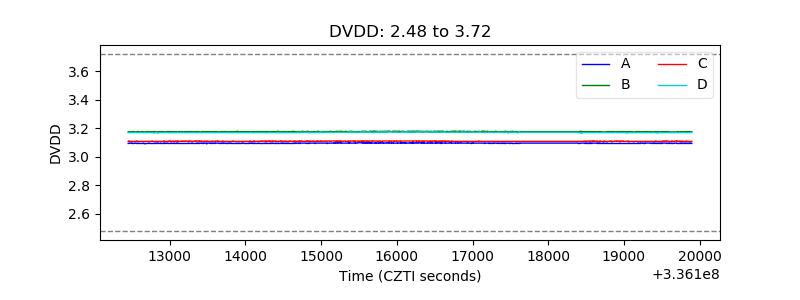 |
| Temperature 1 | 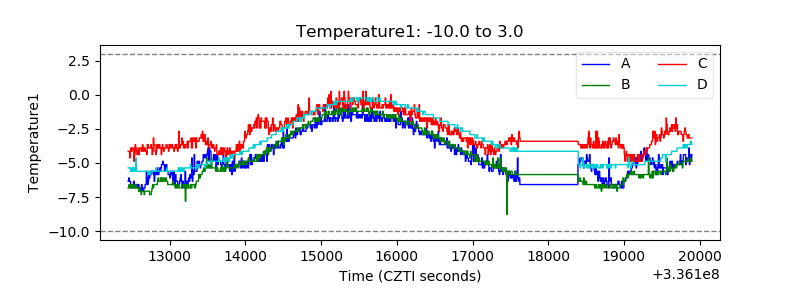 |
| Veto HV Monitor | 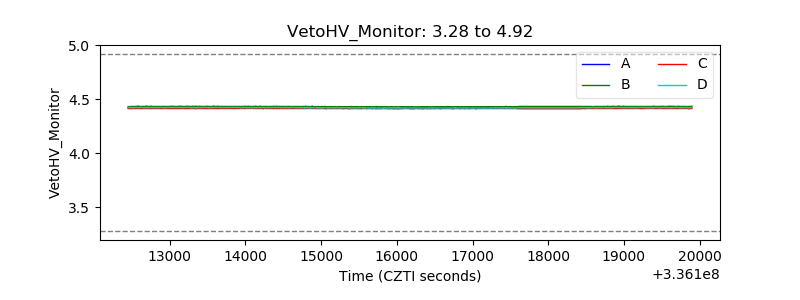 |
| Veto LLD | 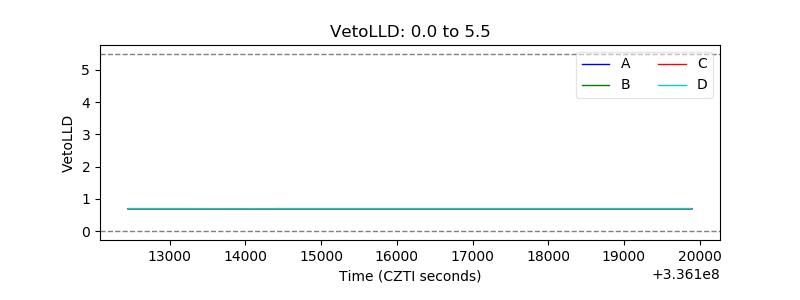 |
| Alpha Counter | 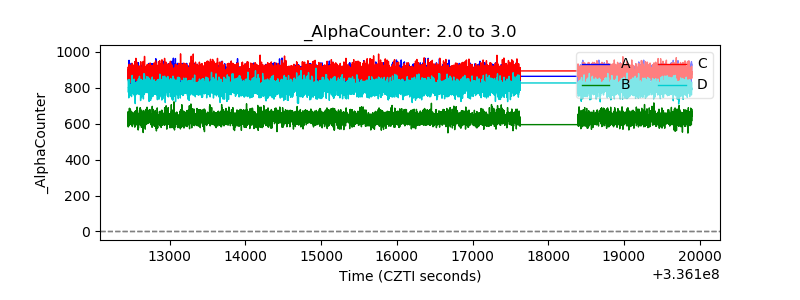 |
| _CPM_Rate | 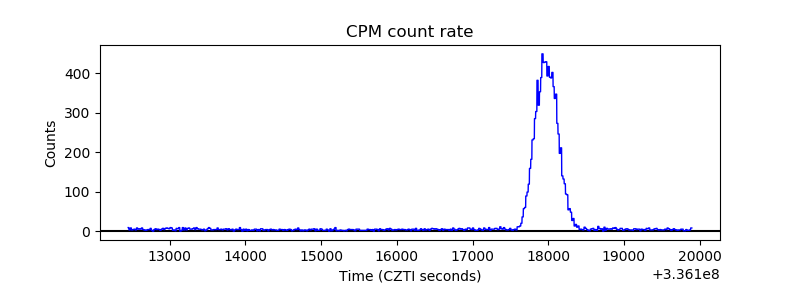 |
| CZT Counter | 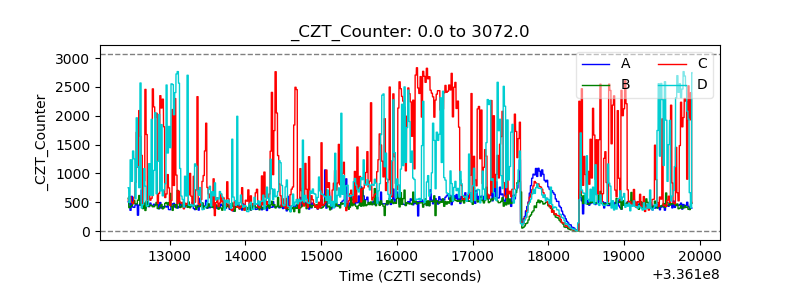 |
| +2.5 Volts monitor |  |
| +5 Volts monitor | 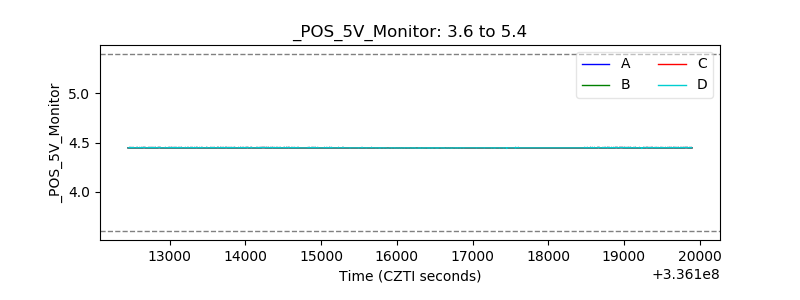 |
| _ROLL_ROT | 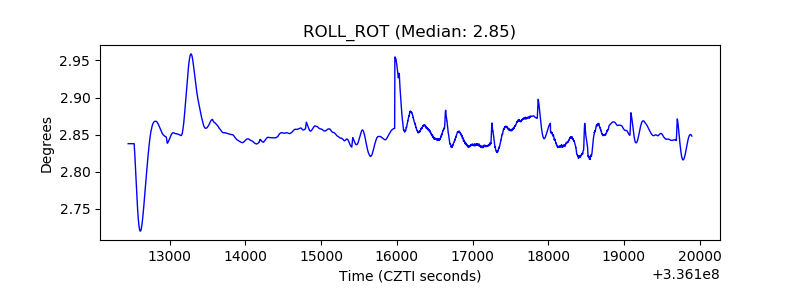 |
| _Roll_DEC | 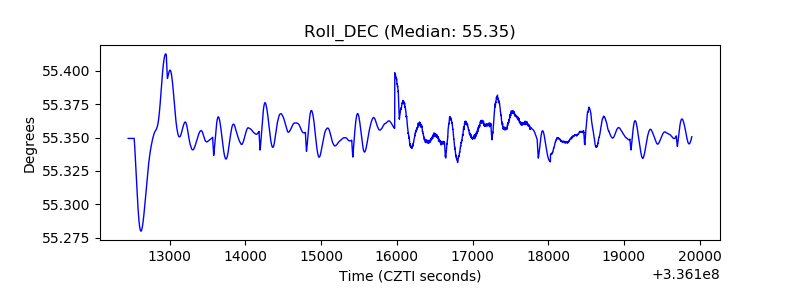 |
| _Roll_RA | 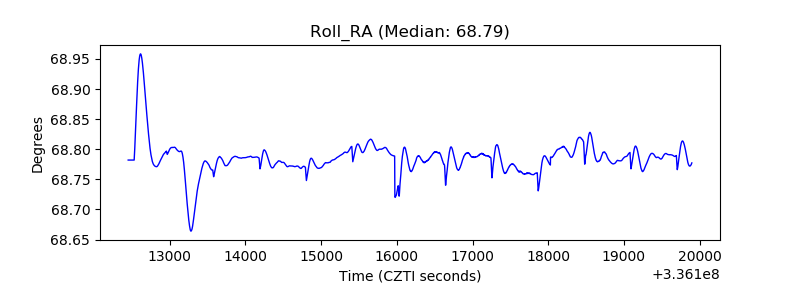 |
| Veto Counter | 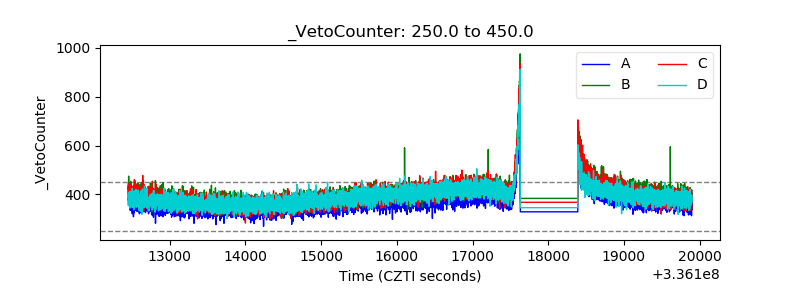 |