| Param | Original file | Final file |
|---|---|---|
| Filename | modeM0/AS1T03_220T01_9000003842_26556cztM0_level2.evt | modeM0/AS1T03_220T01_9000003842_26556cztM0_level2_quad_clean.evt |
| Size (bytes) | 562,651,200 | 85,962,240 |
| Size | 536.6 MB | 82.0 MB |
| Events in quadrant A | 2,791,043 | 569,962 |
| Events in quadrant B | 2,859,173 | 581,853 |
| Events in quadrant C | 4,388,230 | 534,978 |
| Events in quadrant D | 6,601,560 | 503,719 |
| Mode M0 | |||
|---|---|---|---|
| Quadrant | BADHDUFLAG | Total packets | Discarded packets |
| A | 0 | 11975 | 0 |
| B | 0 | 12161 | 0 |
| C | 0 | 16588 | 0 |
| D | 0 | 23796 | 0 |
| Mode M9 | |||
|---|---|---|---|
| Quadrant | BADHDUFLAG | Total packets | Discarded packets |
| A | 0 | 10 | 0 |
| B | 0 | 10 | 0 |
| C | 0 | 10 | 0 |
| D | 0 | 10 | 0 |
| Quadrant | Total seconds | Saturated seconds | Saturation percentage |
|---|---|---|---|
| A | 5906 | 49 | 0.829665% |
| B | 5907 | 51 | 0.863382% |
| C | 5907 | 643 | 10.885390% |
| D | 5907 | 1134 | 19.197562% |
Noise dominated data is calculated using 1-second bins in cleaned event files. If a bin has >2000 counts, and if more than 50% of those come from <1% of pixels, then it is considered to be noise-dominated and hence unusable.
| Quadrant | # 1 sec bins | Bins with >0 counts | Bins with >2000 counts | High rate bins dominated by noise | Noise dominated (total time) | Noise dominated (detector-on time) | Marked lightcurve |
|---|---|---|---|---|---|---|---|
| A | 6826 | 5906 | 0 | 0 | 0.00% | 0.00% | 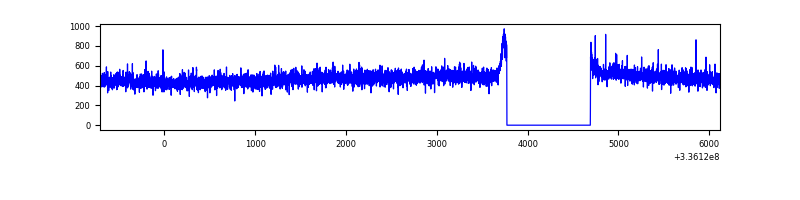 |
| B | 6827 | 5907 | 1 | 1 | 0.01% | 0.02% | 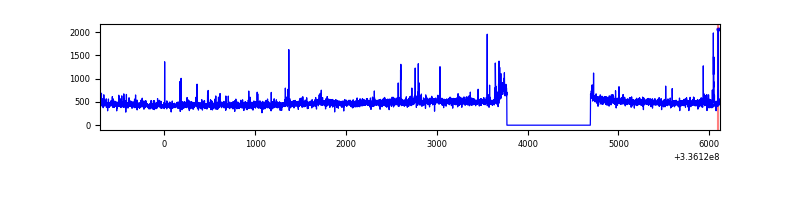 |
| C | 6827 | 5907 | 442 | 442 | 6.47% | 7.48% | 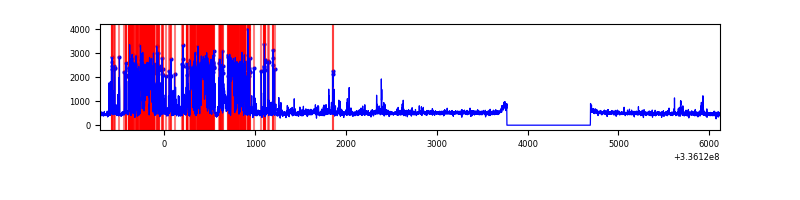 |
| D | 6827 | 5907 | 971 | 971 | 14.22% | 16.44% | 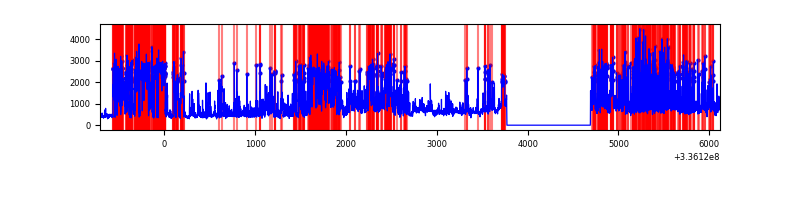 |
Top three noisy pixels from each quadrant. If the there are fewer than three noisy pixels in the level2.evt file, extra rows are filled as -1
| Pixel properties | Quadrant properties | ||||||
|---|---|---|---|---|---|---|---|
| Quadrant | DetID | PixID | Counts | Sigma | Mean | Median | Sigma |
| A | 0 | 13 | 19262 | 129.11 | 713 | 699 | 143.8 |
| A | 5 | 168 | 19122 | 128.14 | 713 | 699 | 143.8 |
| A | 13 | 254 | 9894 | 63.95 | 713 | 699 | 143.8 |
| B | 14 | 207 | 20121 | 144.67 | 705 | 686 | 134.3 |
| B | 3 | 64 | 17470 | 124.94 | 705 | 686 | 134.3 |
| B | 12 | 111 | 16361 | 116.68 | 705 | 686 | 134.3 |
| C | 4 | 254 | 1518774 | 10049.1 | 649 | 653 | 151.1 |
| C | 3 | 233 | 220334 | 1454.16 | 649 | 653 | 151.1 |
| C | 14 | 238 | 103605 | 681.48 | 649 | 653 | 151.1 |
| D | 7 | 80 | 3184770 | 21144.48 | 633 | 617 | 150.6 |
| D | 1 | 52 | 767065 | 5089.62 | 633 | 617 | 150.6 |
| D | 2 | 250 | 134423 | 888.54 | 633 | 617 | 150.6 |
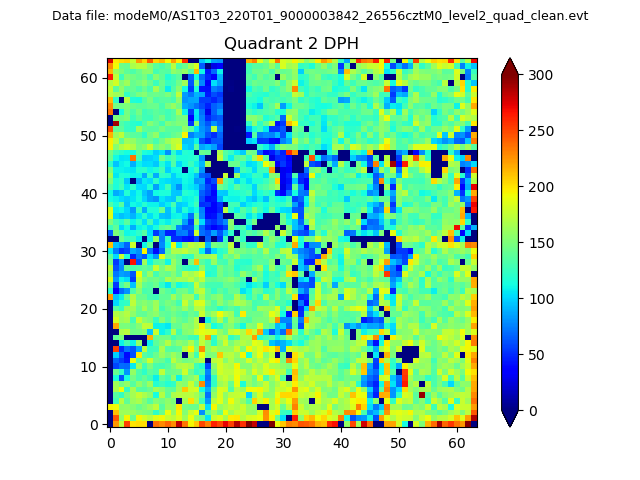
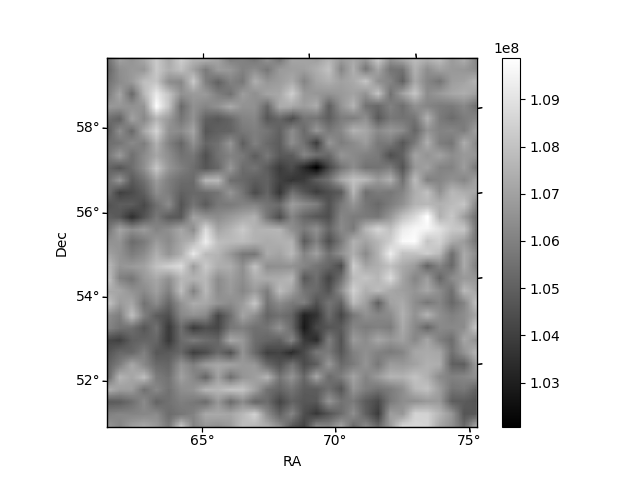
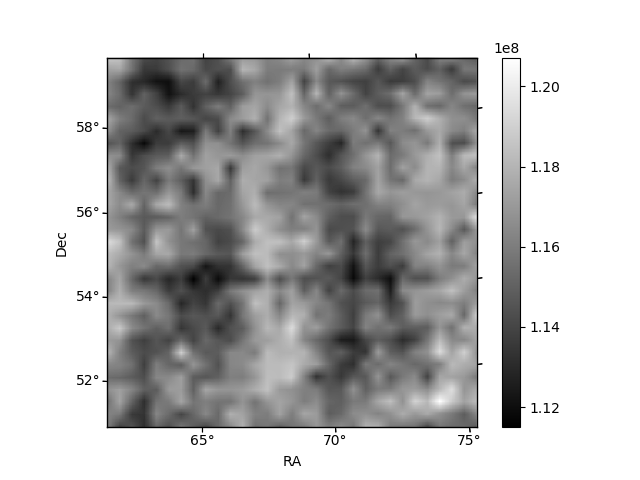
Histogram calculated using DETX and DETY for each event in the final _common_clean file
| Quadrant A | 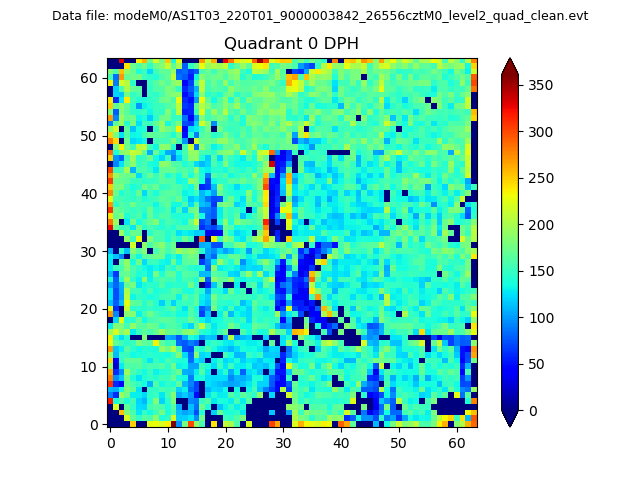 |
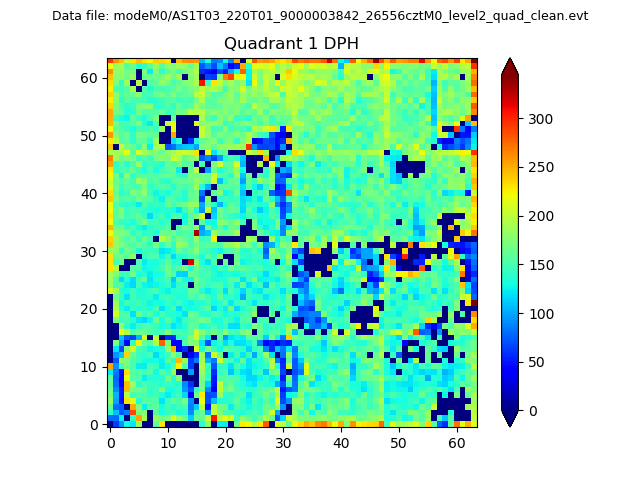 |
Quadrant B |
|---|---|---|---|
| Quadrant D | 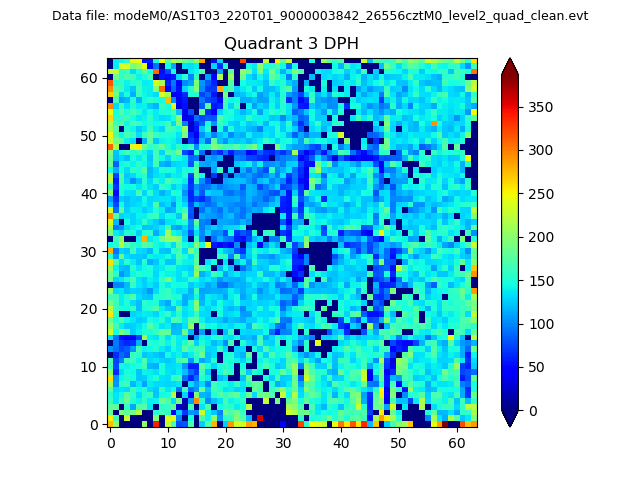 |
 |
Quadrant C |
| Plot type | Count rate plots | Images |
|---|---|---|
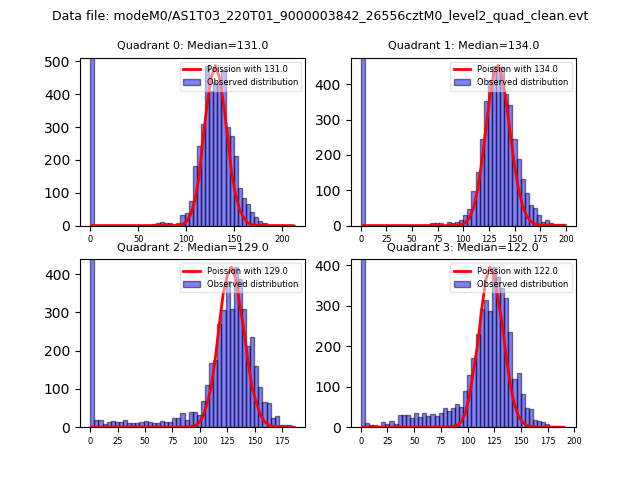
| Comparison with Poisson distribution Blue bars denote a histogram of data divided into 1 sec bins. Red curve is a Poisson curve with rate = median count rate of data. |
 |
 |
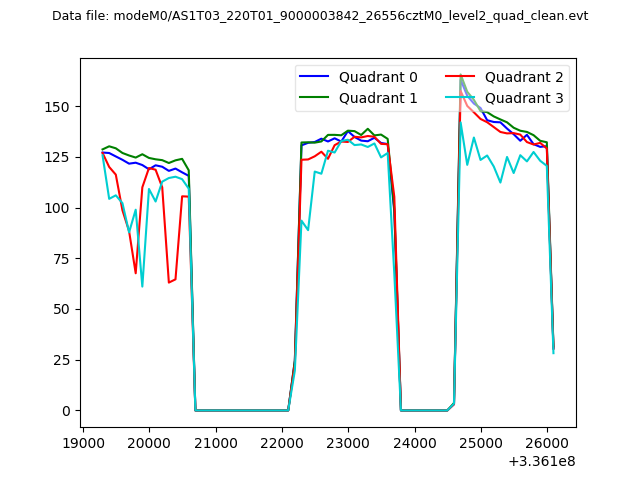
| Quadrant-wise count rates Data is divided into 100 sec bins |
 |
|
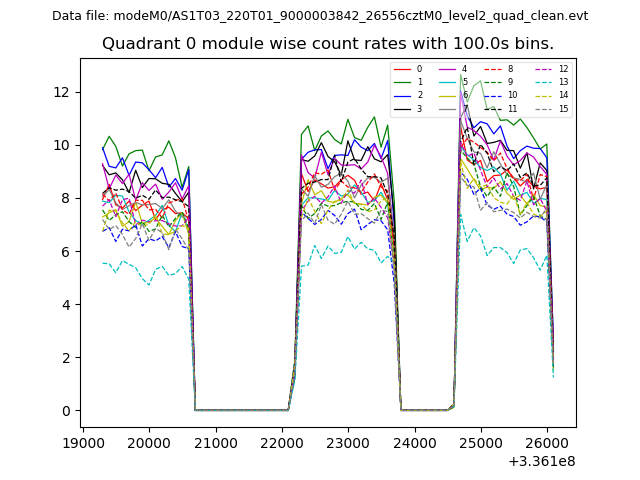
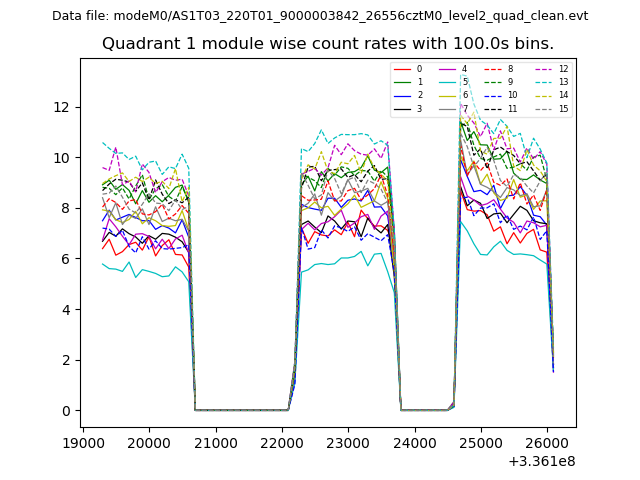
| Module-wise count rates for Quadrant A Data is divided into 100 sec bins |
 |
 |
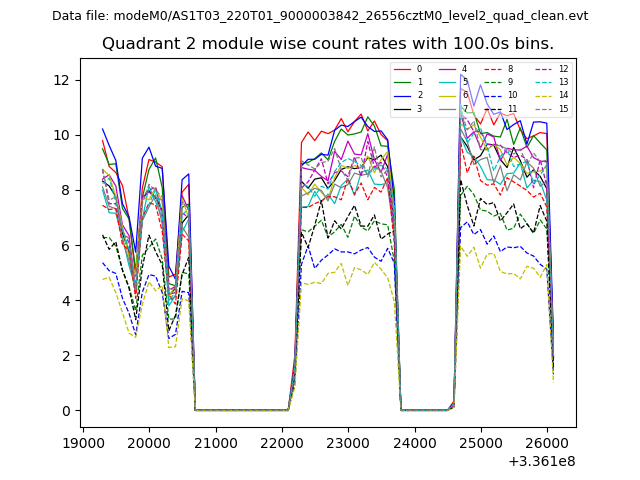
| Module-wise count rates for Quadrant B Data is divided into 100 sec bins |
 |
 |
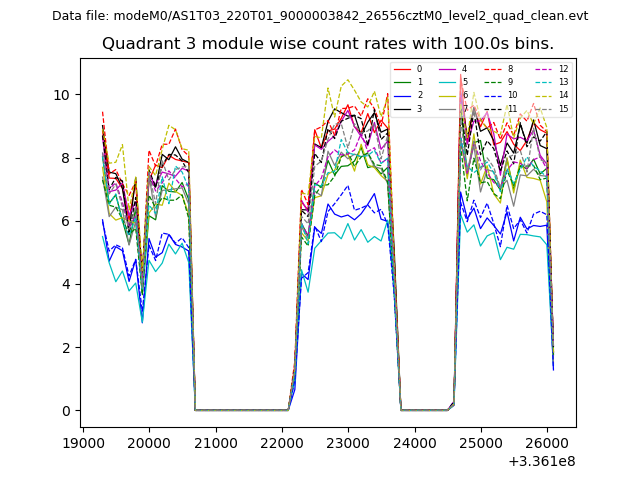
| Module-wise count rates for Quadrant C Data is divided into 100 sec bins |
 |
 |
| Module-wise count rates for Quadrant D Data is divided into 100 sec bins |
 |
 |
| Parameter | Plot |
|---|---|
| CZT HV Monitor | 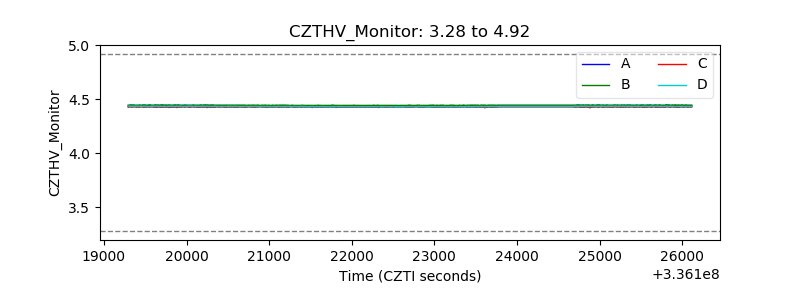 |
| D_VDD | 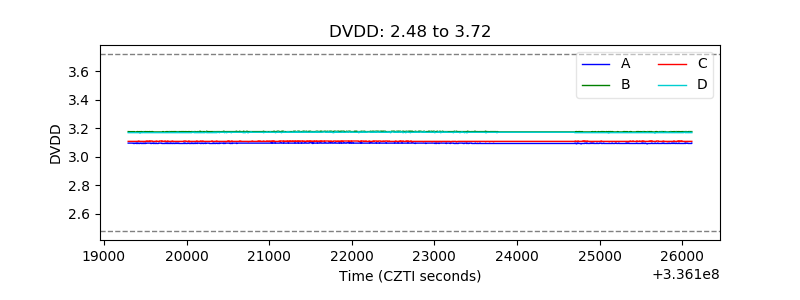 |
| Temperature 1 | 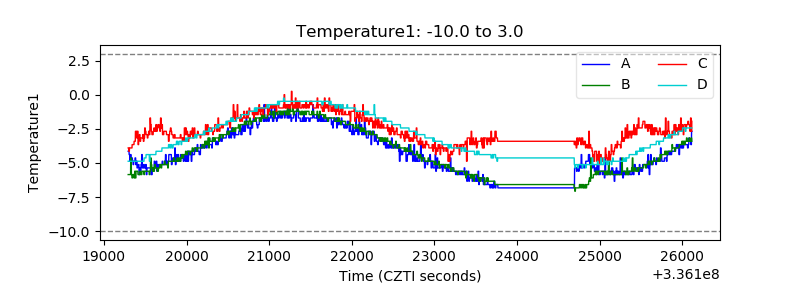 |
| Veto HV Monitor | 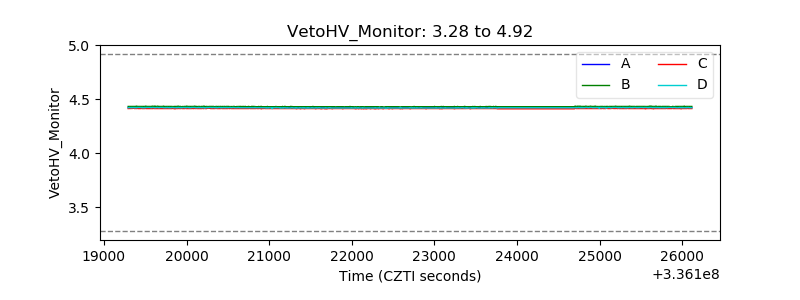 |
| Veto LLD | 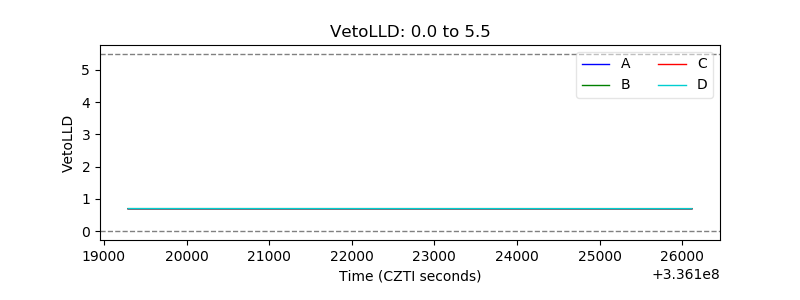 |
| Alpha Counter | 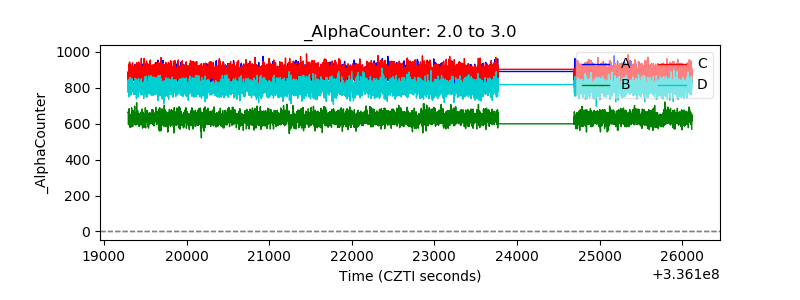 |
| _CPM_Rate | 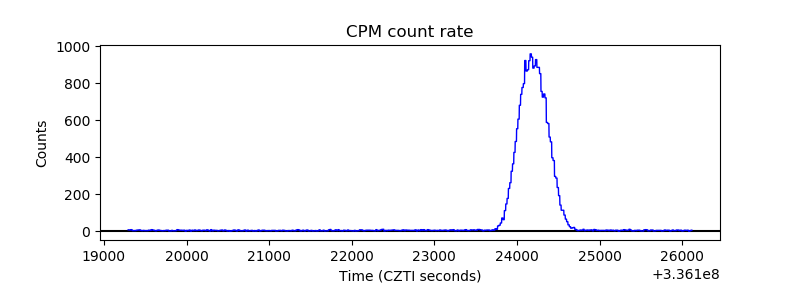 |
| CZT Counter |  |
| +2.5 Volts monitor |  |
| +5 Volts monitor |  |
| _ROLL_ROT |  |
| _Roll_DEC | 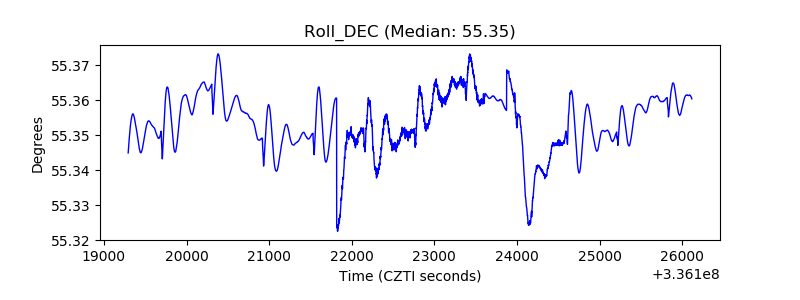 |
| _Roll_RA | 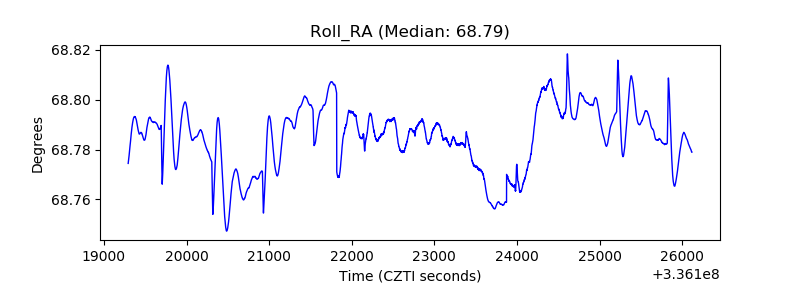 |
| Veto Counter | 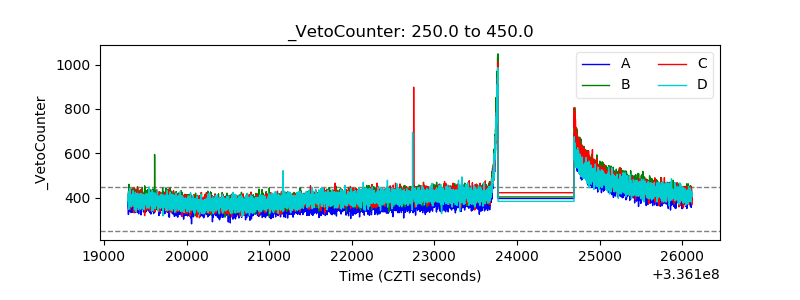 |