| Param | Original file | Final file |
|---|---|---|
| Filename | modeM0/AS1T03_220T01_9000003842_26558cztM0_level2.evt | modeM0/AS1T03_220T01_9000003842_26558cztM0_level2_quad_clean.evt |
| Size (bytes) | 606,242,880 | 95,558,400 |
| Size | 578.2 MB | 91.1 MB |
| Events in quadrant A | 3,022,525 | 646,565 |
| Events in quadrant B | 3,651,134 | 649,736 |
| Events in quadrant C | 4,464,654 | 584,401 |
| Events in quadrant D | 6,804,525 | 582,294 |
| Mode M0 | |||
|---|---|---|---|
| Quadrant | BADHDUFLAG | Total packets | Discarded packets |
| A | 0 | 12687 | 0 |
| B | 0 | 14584 | 0 |
| C | 0 | 17054 | 0 |
| D | 0 | 24655 | 0 |
| Mode M9 | |||
|---|---|---|---|
| Quadrant | BADHDUFLAG | Total packets | Discarded packets |
| A | 0 | 11 | 0 |
| B | 0 | 11 | 0 |
| C | 0 | 11 | 0 |
| D | 0 | 11 | 0 |
| Quadrant | Total seconds | Saturated seconds | Saturation percentage |
|---|---|---|---|
| A | 6162 | 41 | 0.665368% |
| B | 6163 | 141 | 2.287847% |
| C | 6163 | 730 | 11.844881% |
| D | 6163 | 767 | 12.445238% |
Noise dominated data is calculated using 1-second bins in cleaned event files. If a bin has >2000 counts, and if more than 50% of those come from <1% of pixels, then it is considered to be noise-dominated and hence unusable.
| Quadrant | # 1 sec bins | Bins with >0 counts | Bins with >2000 counts | High rate bins dominated by noise | Noise dominated (total time) | Noise dominated (detector-on time) | Marked lightcurve |
|---|---|---|---|---|---|---|---|
| A | 7257 | 6162 | 0 | 0 | 0.00% | 0.00% | 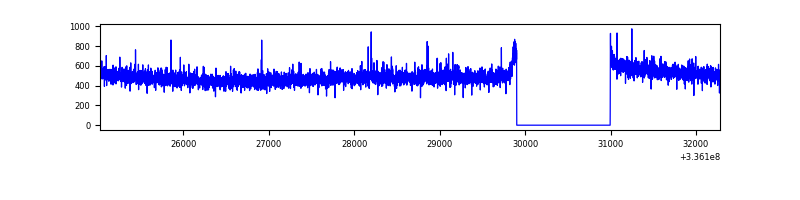 |
| B | 7258 | 6163 | 82 | 82 | 1.13% | 1.33% | 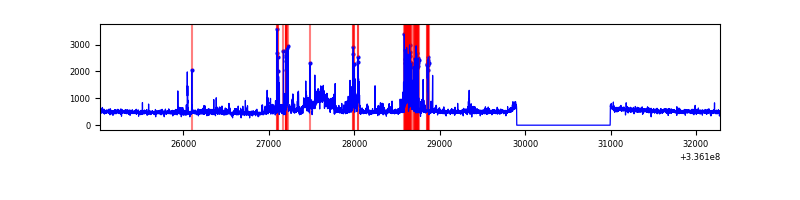 |
| C | 7258 | 6163 | 481 | 481 | 6.63% | 7.80% | 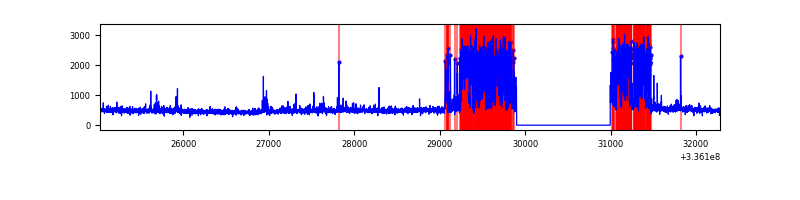 |
| D | 7258 | 6163 | 635 | 635 | 8.75% | 10.30% | 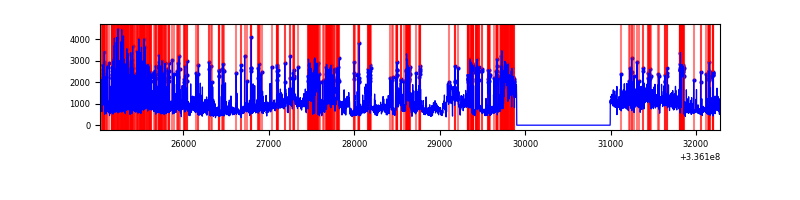 |
Top three noisy pixels from each quadrant. If the there are fewer than three noisy pixels in the level2.evt file, extra rows are filled as -1
| Pixel properties | Quadrant properties | ||||||
|---|---|---|---|---|---|---|---|
| Quadrant | DetID | PixID | Counts | Sigma | Mean | Median | Sigma |
| A | 0 | 13 | 36055 | 230.57 | 767 | 751 | 153.1 |
| A | 5 | 168 | 29696 | 189.04 | 767 | 751 | 153.1 |
| A | 13 | 254 | 10256 | 62.08 | 767 | 751 | 153.1 |
| B | 3 | 64 | 534041 | 3762.42 | 751 | 733 | 141.7 |
| B | 5 | 172 | 138069 | 968.89 | 751 | 733 | 141.7 |
| B | 12 | 111 | 16880 | 113.92 | 751 | 733 | 141.7 |
| C | 4 | 254 | 1510195 | 9463.79 | 689 | 694 | 159.5 |
| C | 3 | 233 | 140974 | 879.48 | 689 | 694 | 159.5 |
| C | 14 | 238 | 111256 | 693.17 | 689 | 694 | 159.5 |
| D | 7 | 80 | 2669742 | 15935.75 | 704 | 689 | 167.5 |
| D | 1 | 52 | 1218636 | 7271.83 | 704 | 689 | 167.5 |
| D | 2 | 250 | 130711 | 776.3 | 704 | 689 | 167.5 |
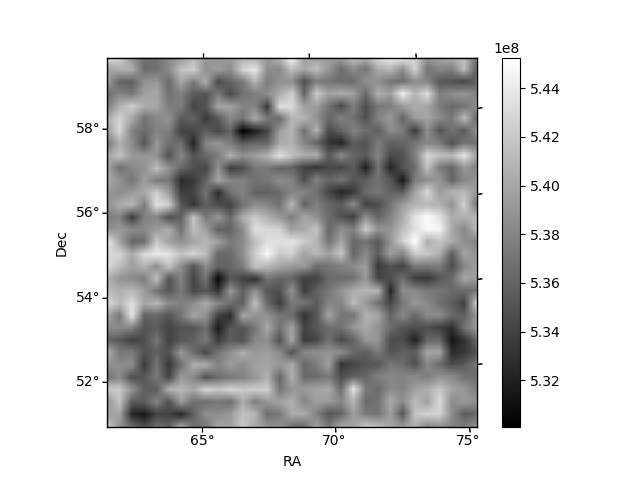
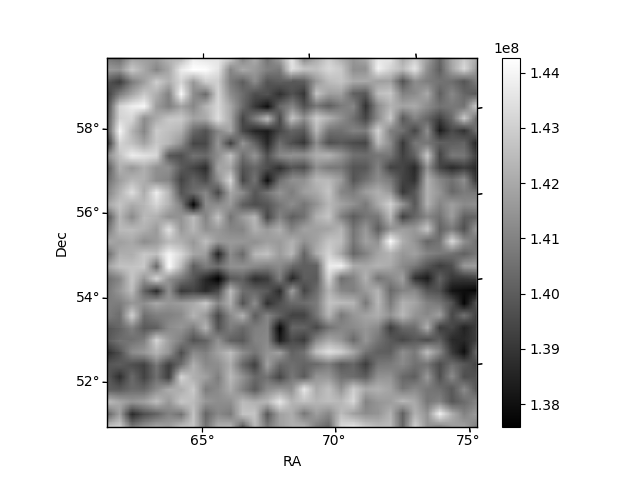
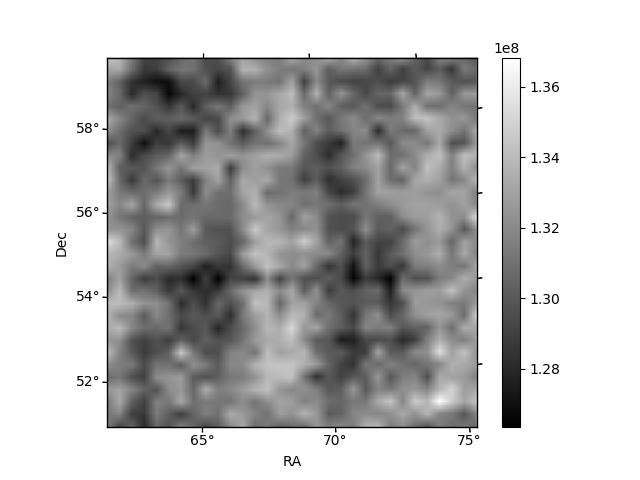
Histogram calculated using DETX and DETY for each event in the final _common_clean file
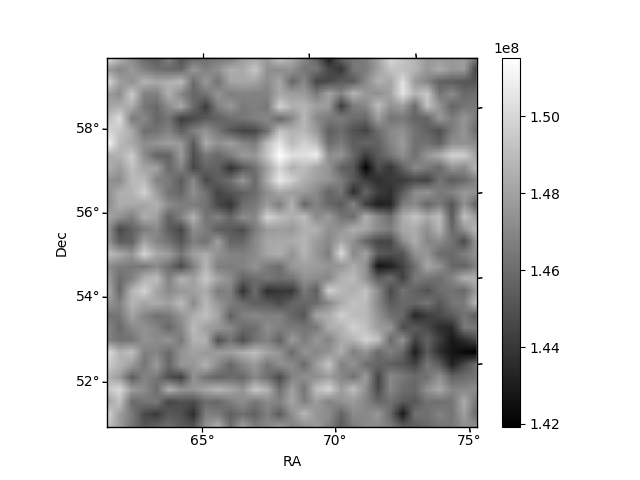
| Quadrant A | 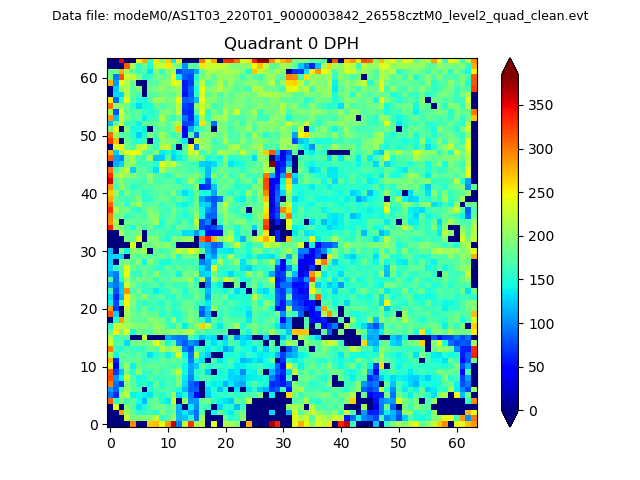 |
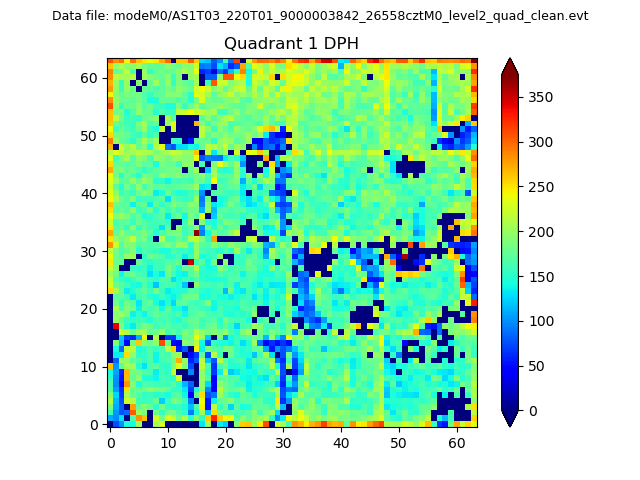 |
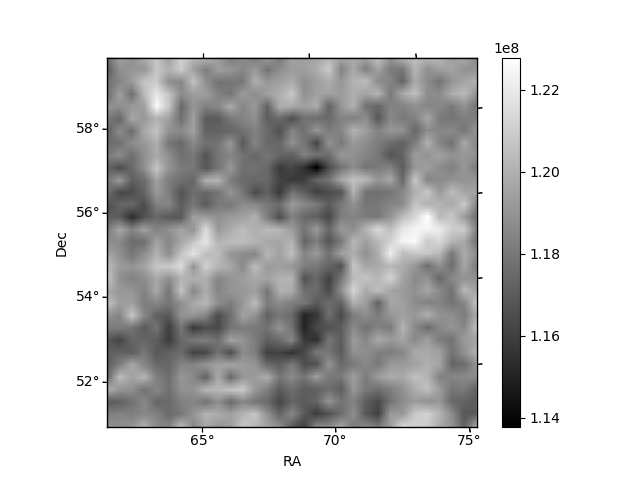
Quadrant B |
|---|---|---|---|
| Quadrant D |  |
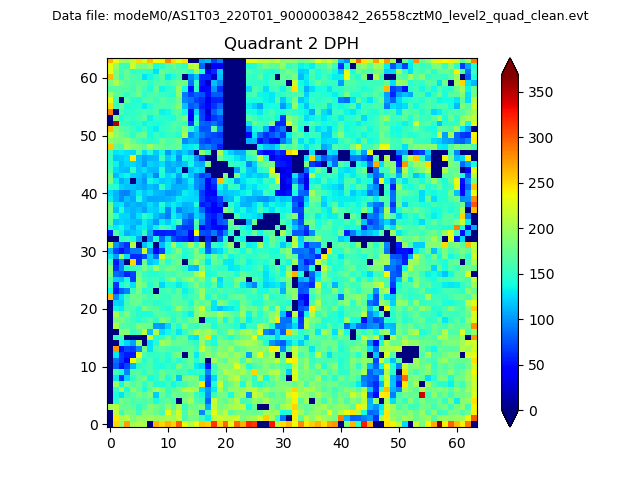 |
Quadrant C |
| Plot type | Count rate plots | Images |
|---|---|---|
| Comparison with Poisson distribution Blue bars denote a histogram of data divided into 1 sec bins. Red curve is a Poisson curve with rate = median count rate of data. |
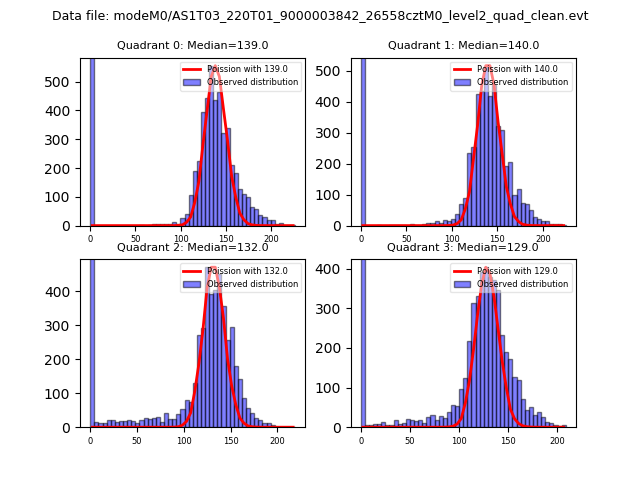 |
 |
| Quadrant-wise count rates Data is divided into 100 sec bins |
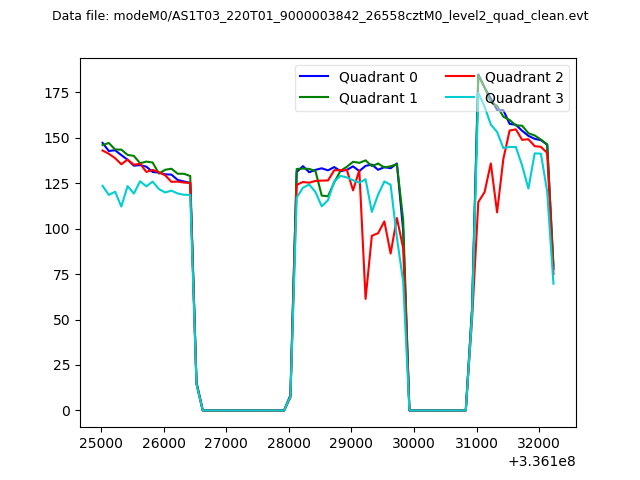 |
|
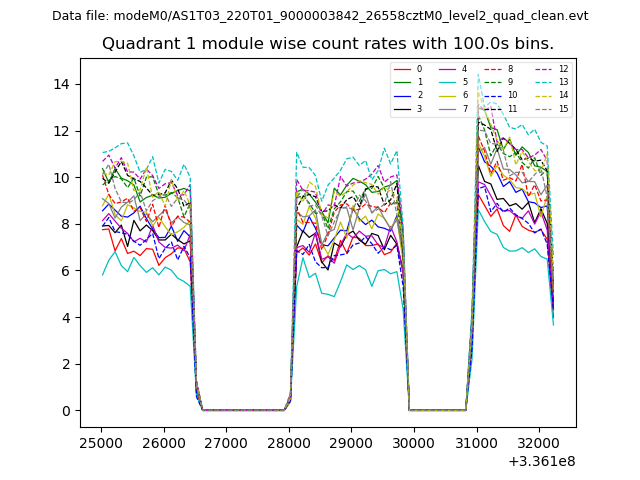
| Module-wise count rates for Quadrant A Data is divided into 100 sec bins |
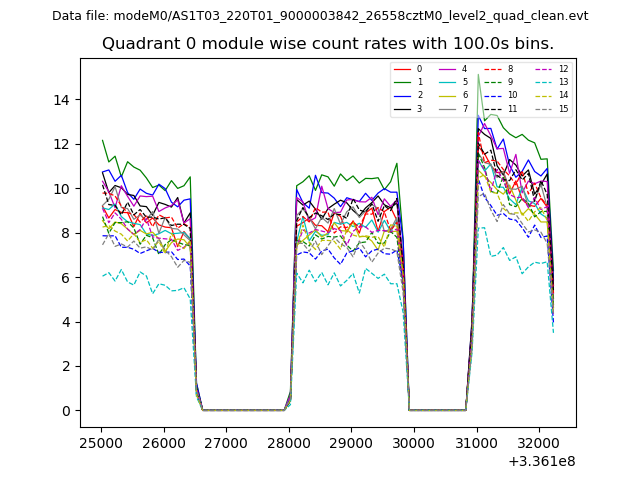 |
 |
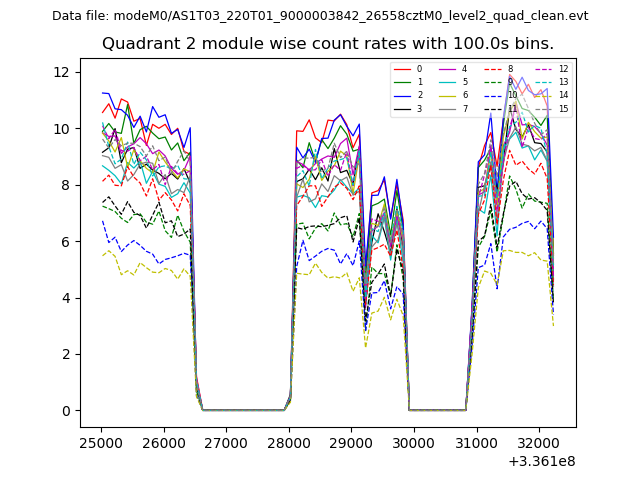
| Module-wise count rates for Quadrant B Data is divided into 100 sec bins |
 |
 |
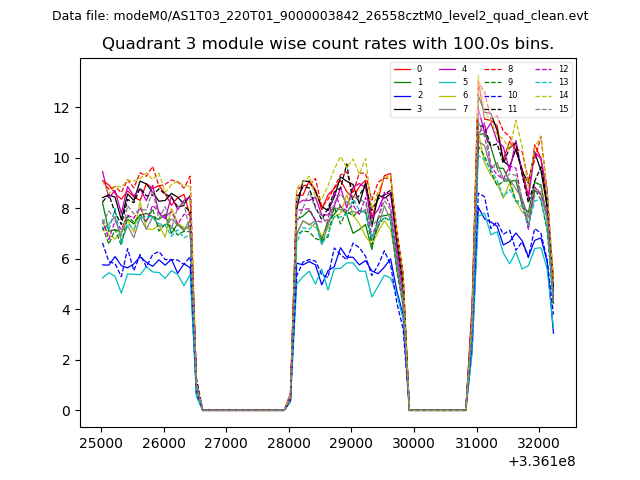
| Module-wise count rates for Quadrant C Data is divided into 100 sec bins |
 |
 |
| Module-wise count rates for Quadrant D Data is divided into 100 sec bins |
 |
 |
| Parameter | Plot |
|---|---|
| CZT HV Monitor | 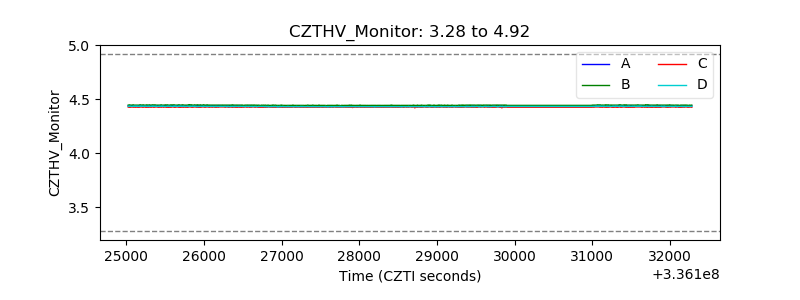 |
| D_VDD | 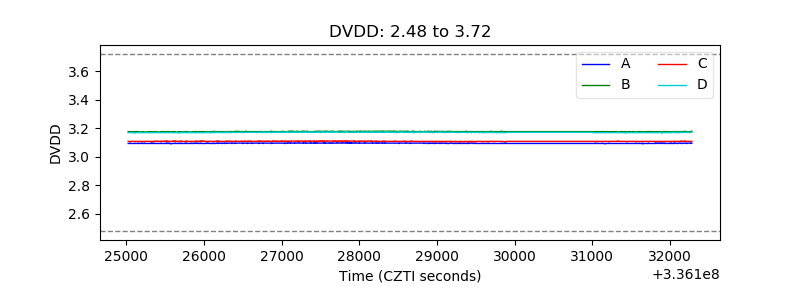 |
| Temperature 1 | 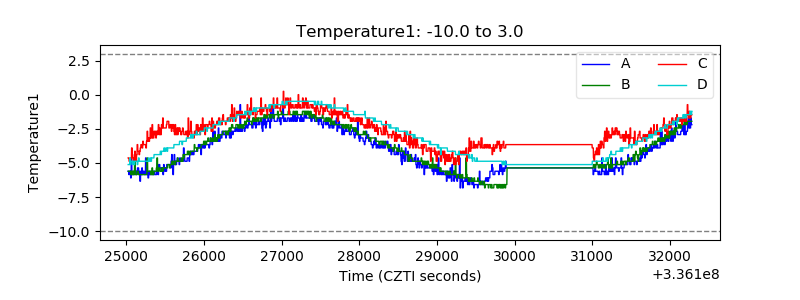 |
| Veto HV Monitor |  |
| Veto LLD | 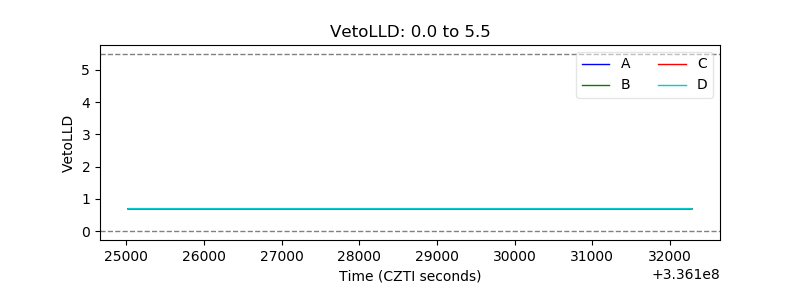 |
| Alpha Counter | 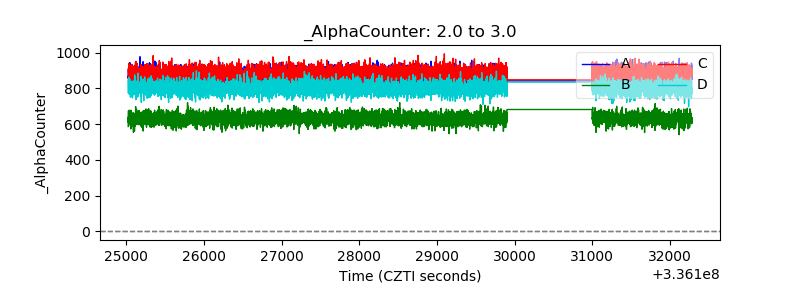 |
| _CPM_Rate | 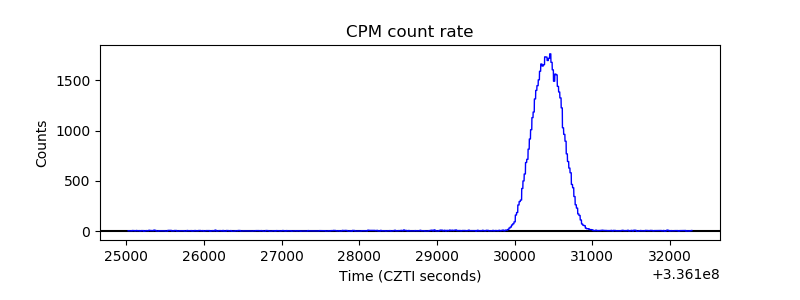 |
| CZT Counter |  |
| +2.5 Volts monitor |  |
| +5 Volts monitor |  |
| _ROLL_ROT | 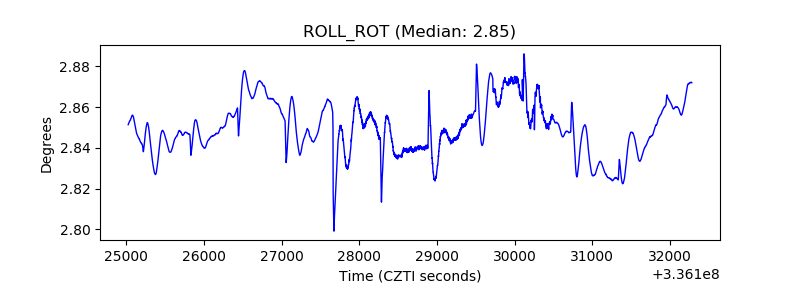 |
| _Roll_DEC | 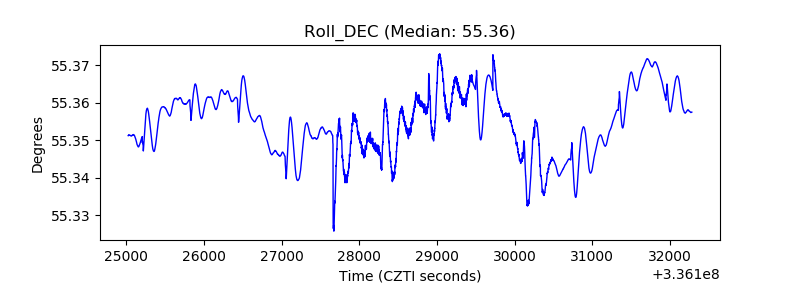 |
| _Roll_RA | 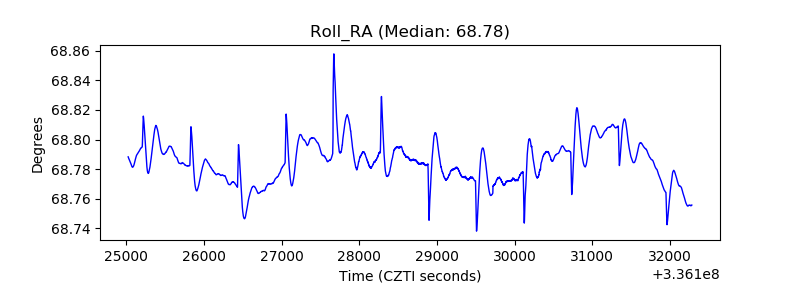 |
| Veto Counter | 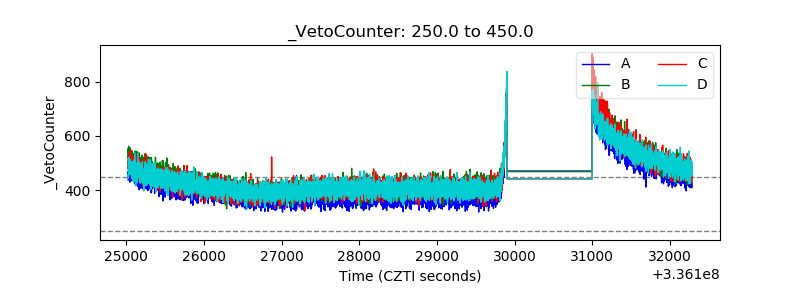 |