| Param | Original file | Final file |
|---|---|---|
| Filename | modeM0/AS1T03_220T01_9000003842_26559cztM0_level2.evt | modeM0/AS1T03_220T01_9000003842_26559cztM0_level2_quad_clean.evt |
| Size (bytes) | 497,937,600 | 89,156,160 |
| Size | 474.9 MB | 85.0 MB |
| Events in quadrant A | 2,906,348 | 595,256 |
| Events in quadrant B | 2,945,763 | 597,758 |
| Events in quadrant C | 3,230,843 | 568,346 |
| Events in quadrant D | 5,613,241 | 542,546 |
| Mode M0 | |||
|---|---|---|---|
| Quadrant | BADHDUFLAG | Total packets | Discarded packets |
| A | 0 | 12078 | 0 |
| B | 0 | 12185 | 0 |
| C | 0 | 13082 | 0 |
| D | 0 | 20681 | 0 |
| Mode M9 | |||
|---|---|---|---|
| Quadrant | BADHDUFLAG | Total packets | Discarded packets |
| A | 0 | 12 | 0 |
| B | 0 | 12 | 0 |
| C | 0 | 12 | 0 |
| D | 0 | 12 | 0 |
| Quadrant | Total seconds | Saturated seconds | Saturation percentage |
|---|---|---|---|
| A | 5657 | 46 | 0.813152% |
| B | 5658 | 54 | 0.954401% |
| C | 5658 | 166 | 2.933899% |
| D | 5657 | 642 | 11.348771% |
Noise dominated data is calculated using 1-second bins in cleaned event files. If a bin has >2000 counts, and if more than 50% of those come from <1% of pixels, then it is considered to be noise-dominated and hence unusable.
| Quadrant | # 1 sec bins | Bins with >0 counts | Bins with >2000 counts | High rate bins dominated by noise | Noise dominated (total time) | Noise dominated (detector-on time) | Marked lightcurve |
|---|---|---|---|---|---|---|---|
| A | 6857 | 5657 | 0 | 0 | 0.00% | 0.00% | 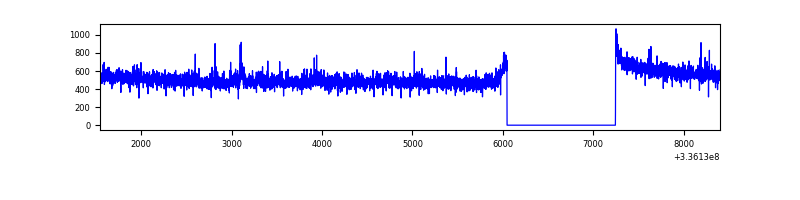 |
| B | 6858 | 5658 | 7 | 7 | 0.10% | 0.12% | 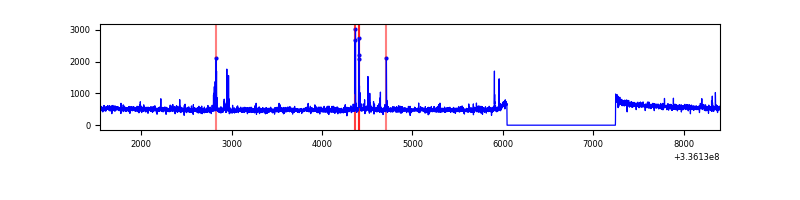 |
| C | 6858 | 5658 | 66 | 66 | 0.96% | 1.17% | 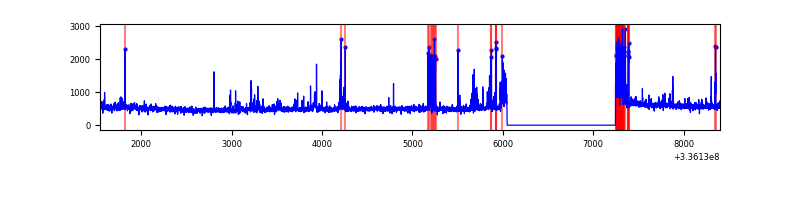 |
| D | 6857 | 5657 | 449 | 449 | 6.55% | 7.94% | 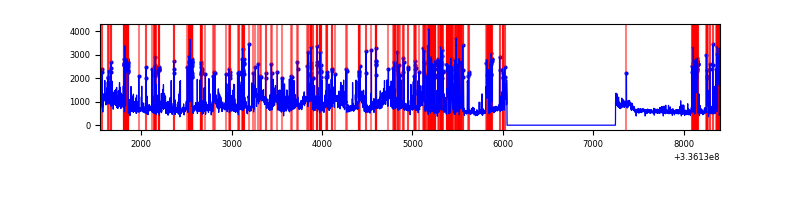 |
Top three noisy pixels from each quadrant. If the there are fewer than three noisy pixels in the level2.evt file, extra rows are filled as -1
| Pixel properties | Quadrant properties | ||||||
|---|---|---|---|---|---|---|---|
| Quadrant | DetID | PixID | Counts | Sigma | Mean | Median | Sigma |
| A | 0 | 13 | 31319 | 209.21 | 738 | 725 | 146.2 |
| A | 5 | 168 | 25615 | 170.2 | 738 | 725 | 146.2 |
| A | 13 | 254 | 9497 | 59.99 | 738 | 725 | 146.2 |
| B | 5 | 172 | 46306 | 340.57 | 724 | 708 | 133.9 |
| B | 3 | 64 | 19781 | 142.45 | 724 | 708 | 133.9 |
| B | 12 | 111 | 15707 | 112.03 | 724 | 708 | 133.9 |
| C | 4 | 254 | 336897 | 2112.93 | 690 | 695 | 159.1 |
| C | 14 | 238 | 111246 | 694.78 | 690 | 695 | 159.1 |
| C | 3 | 233 | 87668 | 546.6 | 690 | 695 | 159.1 |
| D | 7 | 80 | 1901665 | 11757.18 | 677 | 663 | 161.7 |
| D | 1 | 52 | 943703 | 5832.45 | 677 | 663 | 161.7 |
| D | 2 | 250 | 100905 | 619.97 | 677 | 663 | 161.7 |
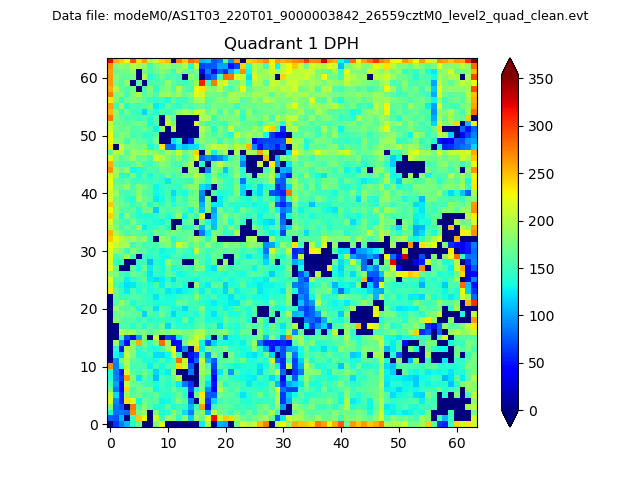
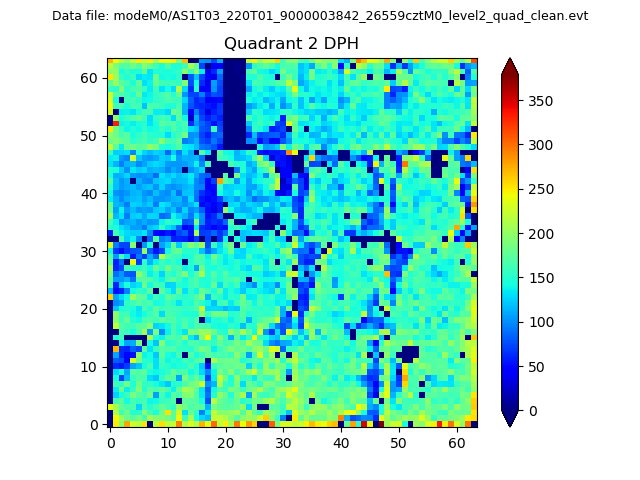
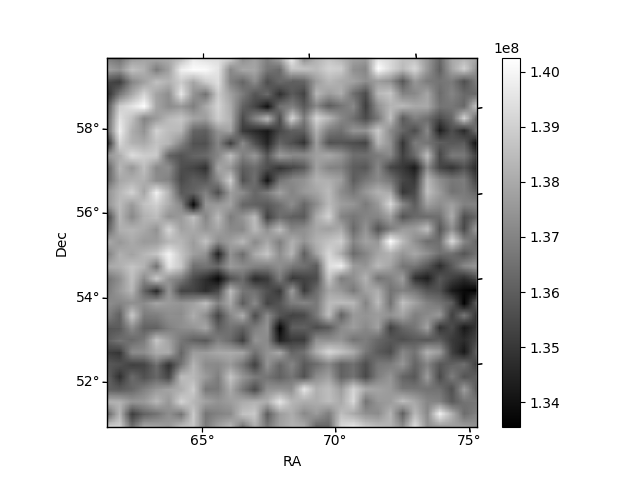
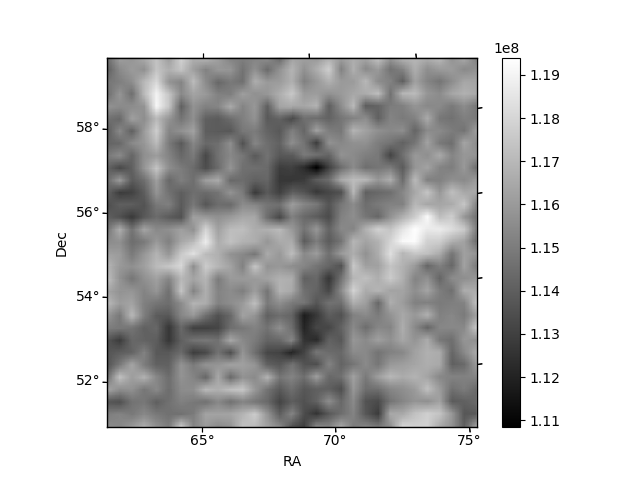
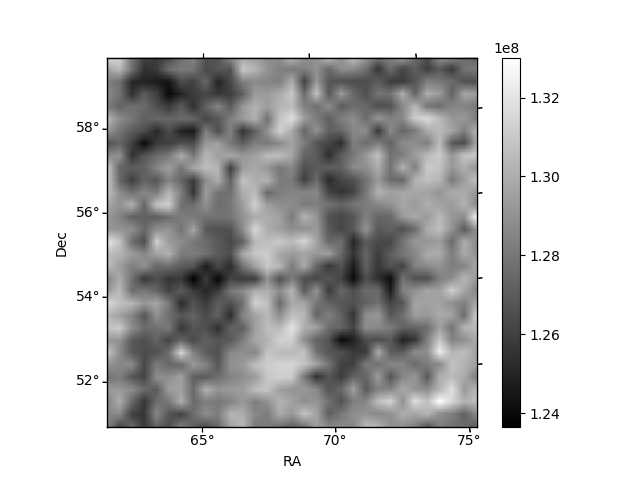
Histogram calculated using DETX and DETY for each event in the final _common_clean file
| Quadrant A |  |
 |
Quadrant B |
|---|---|---|---|
| Quadrant D |  |
 |
Quadrant C |
| Plot type | Count rate plots | Images |
|---|---|---|
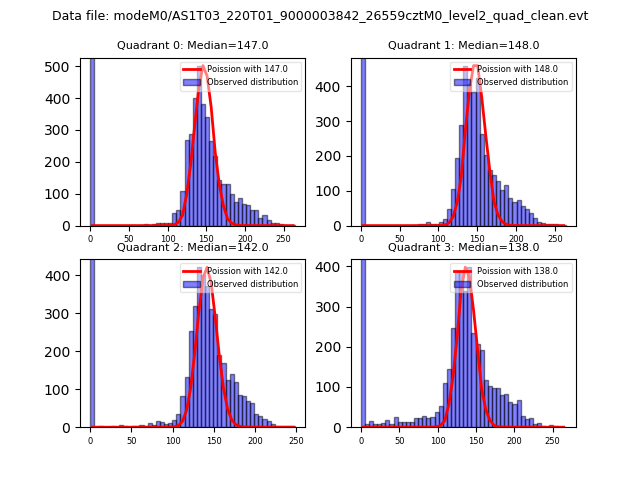
| Comparison with Poisson distribution Blue bars denote a histogram of data divided into 1 sec bins. Red curve is a Poisson curve with rate = median count rate of data. |
 |
 |
| Quadrant-wise count rates Data is divided into 100 sec bins |
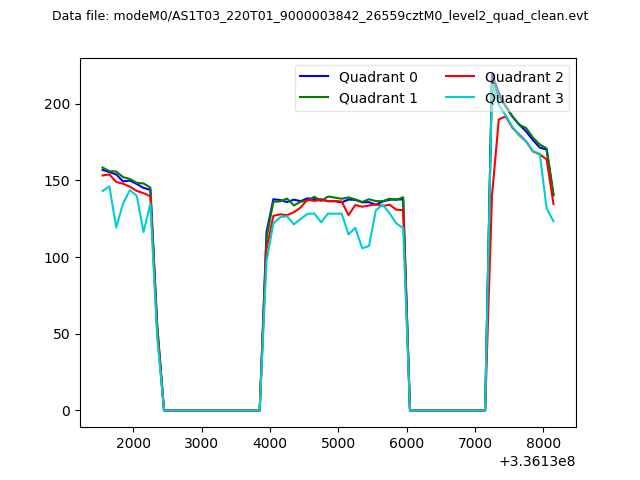 |
|
| Module-wise count rates for Quadrant A Data is divided into 100 sec bins |
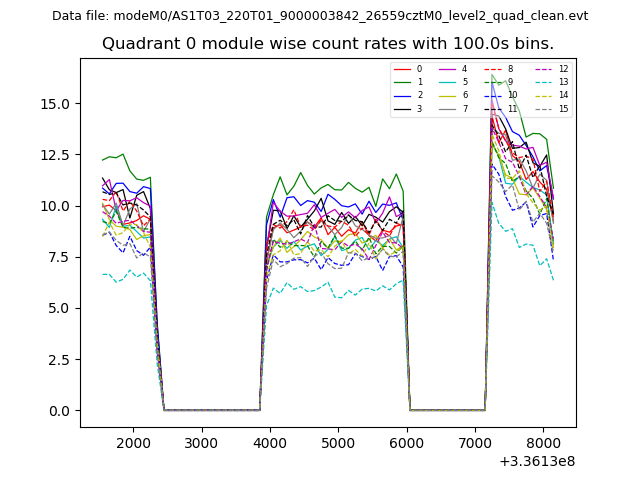 |
 |
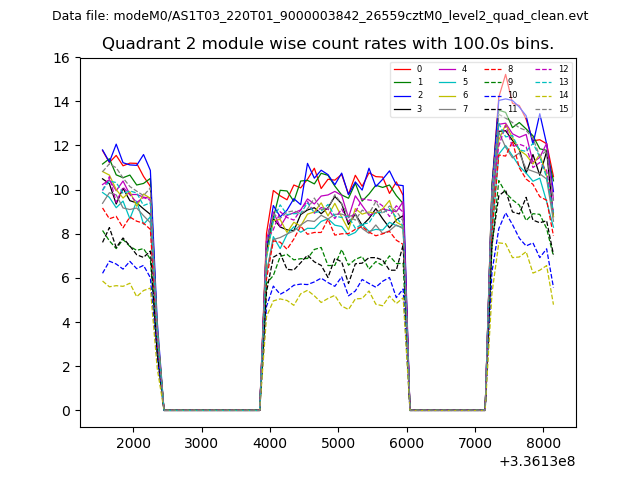
| Module-wise count rates for Quadrant B Data is divided into 100 sec bins |
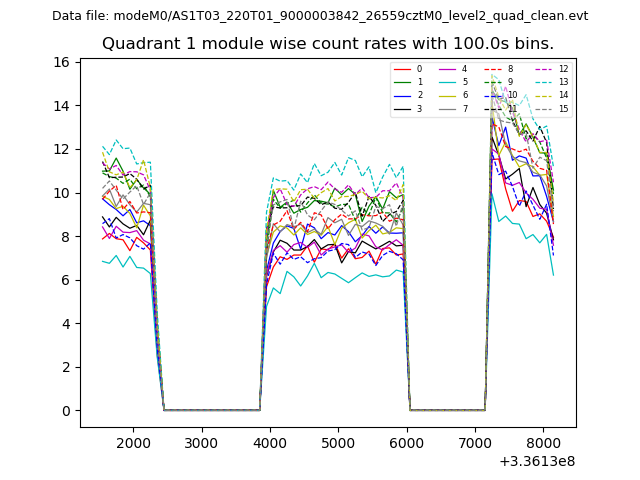 |
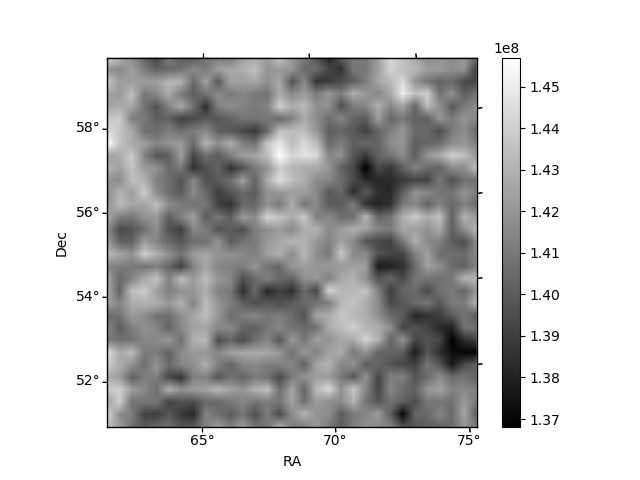 |
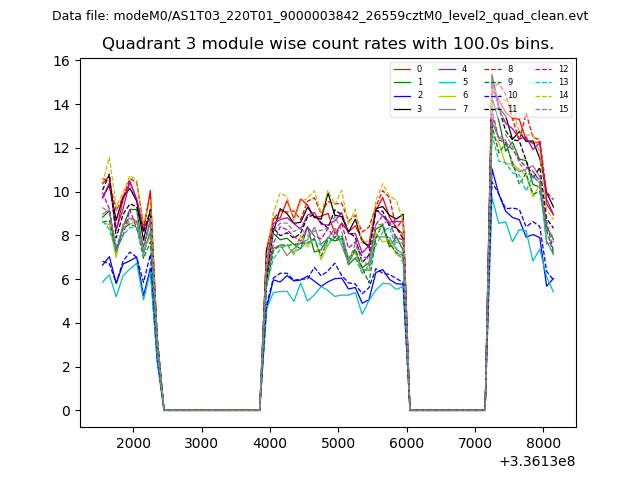
| Module-wise count rates for Quadrant C Data is divided into 100 sec bins |
 |
 |
| Module-wise count rates for Quadrant D Data is divided into 100 sec bins |
 |
 |
| Parameter | Plot |
|---|---|
| CZT HV Monitor | 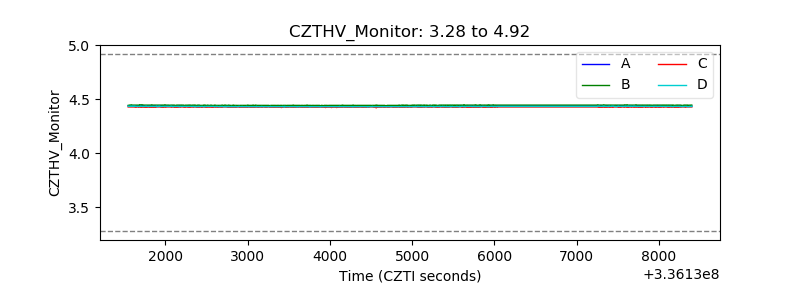 |
| D_VDD | 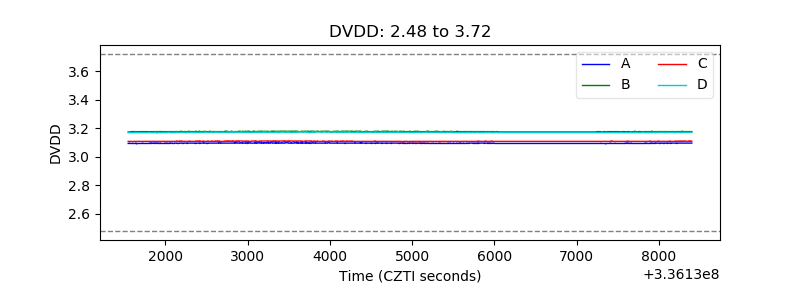 |
| Temperature 1 | 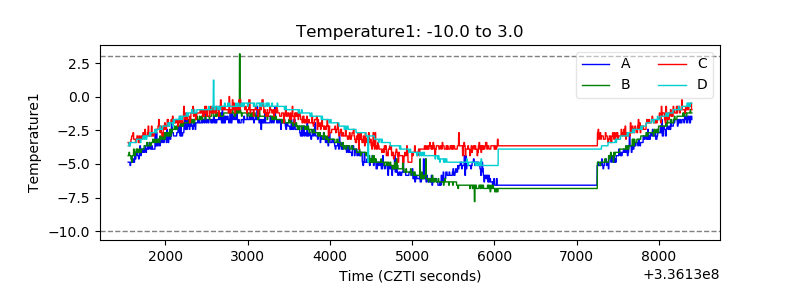 |
| Veto HV Monitor | 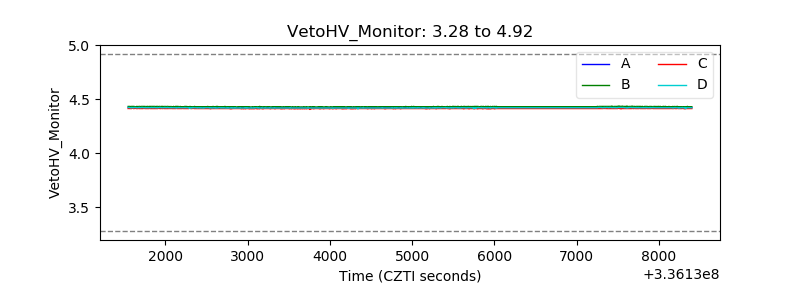 |
| Veto LLD | 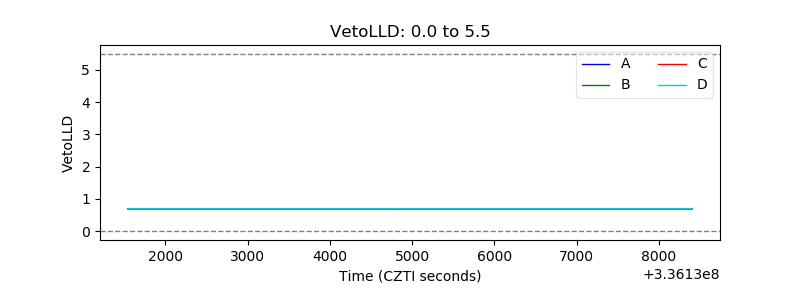 |
| Alpha Counter | 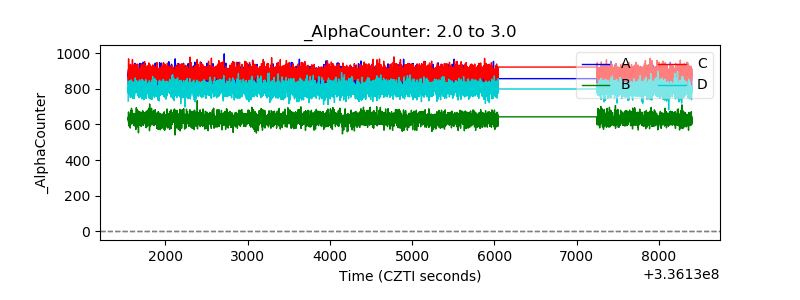 |
| _CPM_Rate | 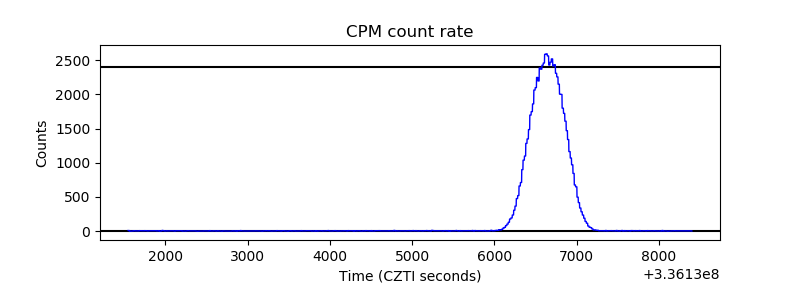 |
| CZT Counter | 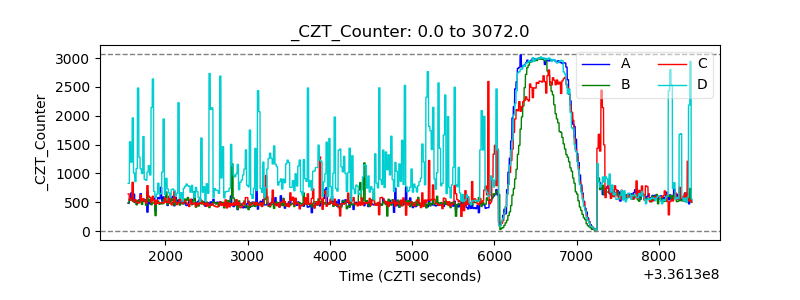 |
| +2.5 Volts monitor |  |
| +5 Volts monitor |  |
| _ROLL_ROT | 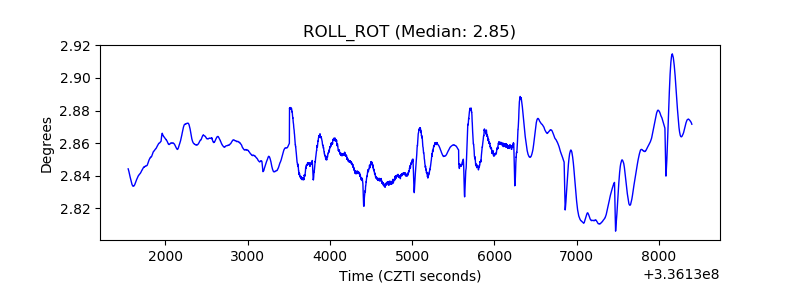 |
| _Roll_DEC | 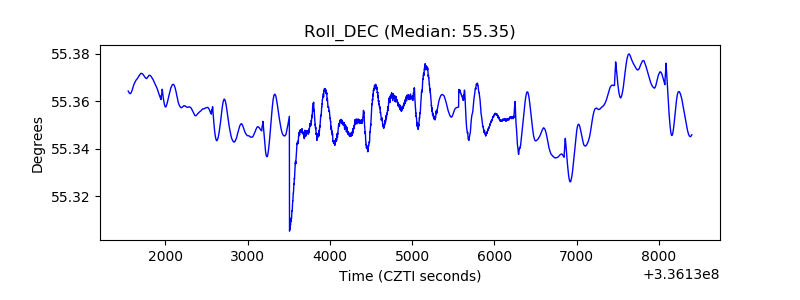 |
| _Roll_RA | 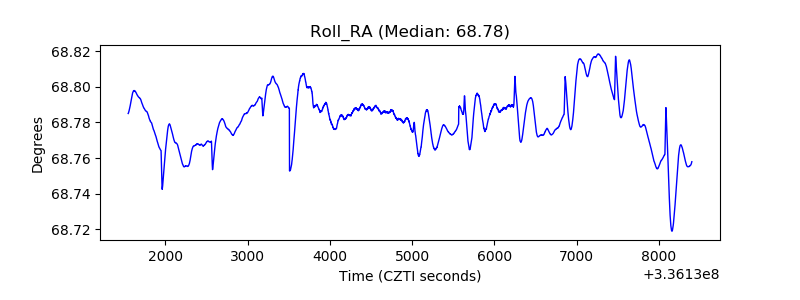 |
| Veto Counter | 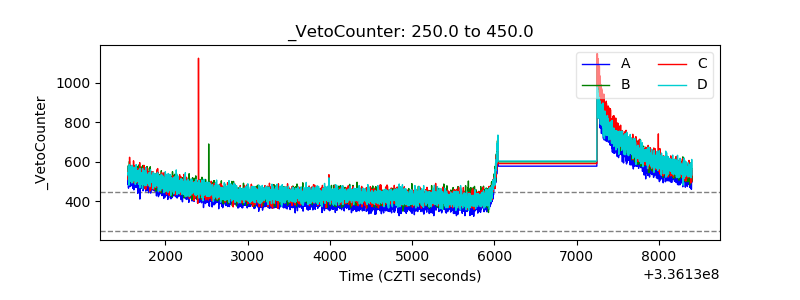 |