| Param | Original file | Final file |
|---|---|---|
| Filename | modeM0/AS1T03_220T01_9000003842_26560cztM0_level2.evt | modeM0/AS1T03_220T01_9000003842_26560cztM0_level2_quad_clean.evt |
| Size (bytes) | 585,601,920 | 86,544,000 |
| Size | 558.5 MB | 82.5 MB |
| Events in quadrant A | 3,273,863 | 570,128 |
| Events in quadrant B | 3,678,329 | 573,894 |
| Events in quadrant C | 3,526,511 | 554,984 |
| Events in quadrant D | 6,842,743 | 495,105 |
| Mode M0 | |||
|---|---|---|---|
| Quadrant | BADHDUFLAG | Total packets | Discarded packets |
| A | 0 | 13489 | 0 |
| B | 0 | 14833 | 0 |
| C | 0 | 14322 | 0 |
| D | 0 | 24418 | 0 |
| Mode M9 | |||
|---|---|---|---|
| Quadrant | BADHDUFLAG | Total packets | Discarded packets |
| A | 0 | 13 | 0 |
| B | 0 | 13 | 0 |
| C | 0 | 13 | 0 |
| D | 0 | 13 | 0 |
| Quadrant | Total seconds | Saturated seconds | Saturation percentage |
|---|---|---|---|
| A | 6105 | 68 | 1.113841% |
| B | 6106 | 136 | 2.227317% |
| C | 6106 | 126 | 2.063544% |
| D | 6106 | 1273 | 20.848346% |
Noise dominated data is calculated using 1-second bins in cleaned event files. If a bin has >2000 counts, and if more than 50% of those come from <1% of pixels, then it is considered to be noise-dominated and hence unusable.
| Quadrant | # 1 sec bins | Bins with >0 counts | Bins with >2000 counts | High rate bins dominated by noise | Noise dominated (total time) | Noise dominated (detector-on time) | Marked lightcurve |
|---|---|---|---|---|---|---|---|
| A | 7395 | 6105 | 0 | 0 | 0.00% | 0.00% | 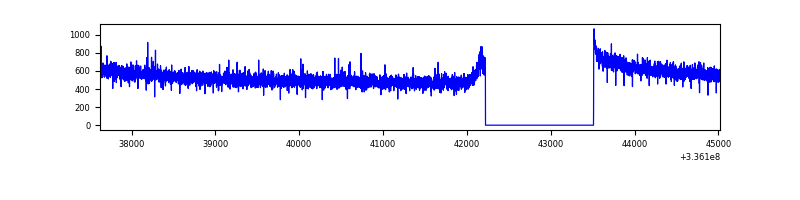 |
| B | 7396 | 6106 | 32 | 32 | 0.43% | 0.52% | 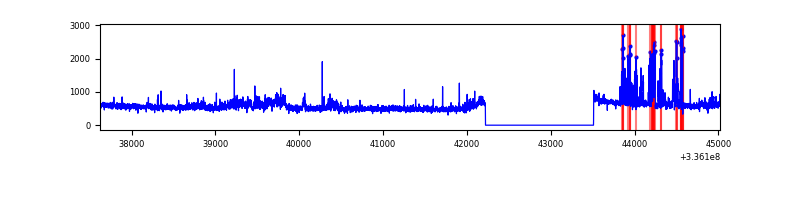 |
| C | 7396 | 6106 | 8 | 8 | 0.11% | 0.13% | 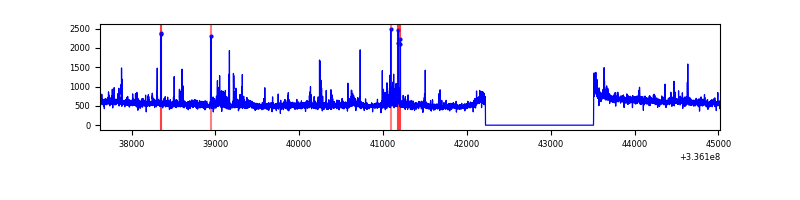 |
| D | 7396 | 6106 | 1111 | 1111 | 15.02% | 18.20% | 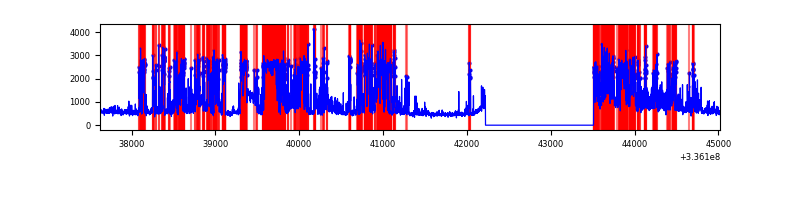 |
Top three noisy pixels from each quadrant. If the there are fewer than three noisy pixels in the level2.evt file, extra rows are filled as -1
| Pixel properties | Quadrant properties | ||||||
|---|---|---|---|---|---|---|---|
| Quadrant | DetID | PixID | Counts | Sigma | Mean | Median | Sigma |
| A | 5 | 168 | 14023 | 79.43 | 843 | 830 | 166.1 |
| A | 13 | 254 | 10378 | 57.49 | 843 | 830 | 166.1 |
| A | 0 | 13 | 8615 | 46.87 | 843 | 830 | 166.1 |
| B | 0 | 189 | 284691 | 1866.68 | 825 | 807 | 152.1 |
| B | 5 | 172 | 79789 | 519.35 | 825 | 807 | 152.1 |
| B | 3 | 112 | 26559 | 169.33 | 825 | 807 | 152.1 |
| C | 4 | 254 | 144930 | 779.25 | 800 | 808 | 185.0 |
| C | 14 | 238 | 130865 | 703.2 | 800 | 808 | 185.0 |
| C | 3 | 233 | 124648 | 669.59 | 800 | 808 | 185.0 |
| D | 7 | 80 | 3310229 | 18939.26 | 736 | 717 | 174.7 |
| D | 1 | 52 | 421677 | 2409.02 | 736 | 717 | 174.7 |
| D | 2 | 250 | 181822 | 1036.4 | 736 | 717 | 174.7 |
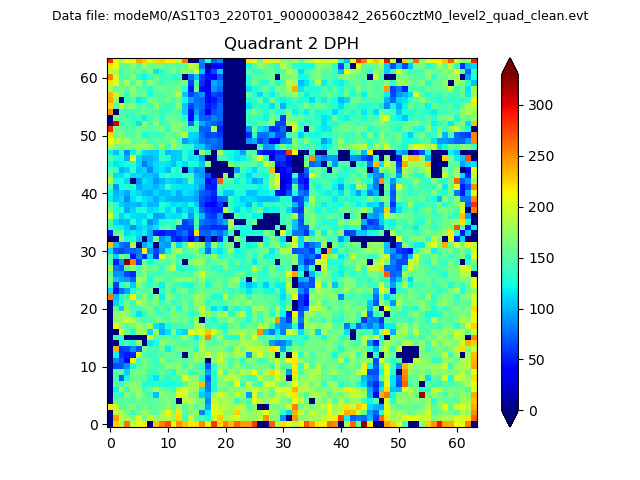
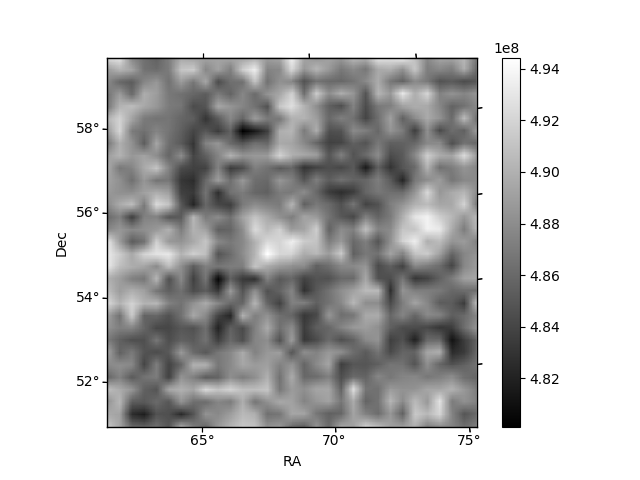
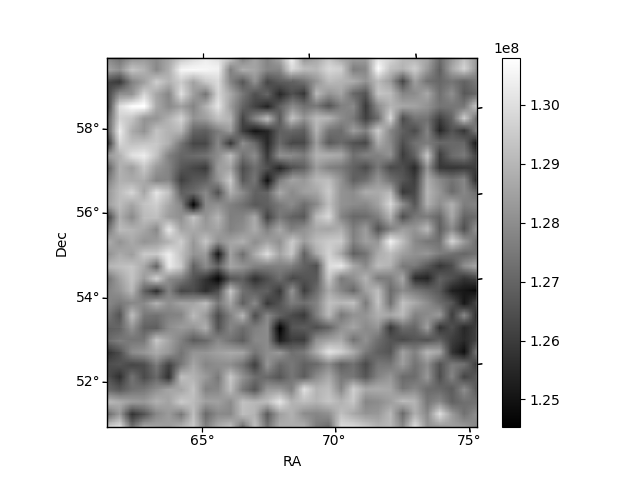
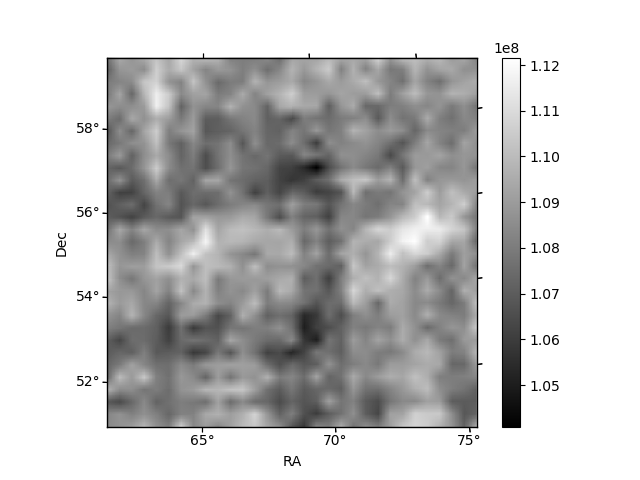
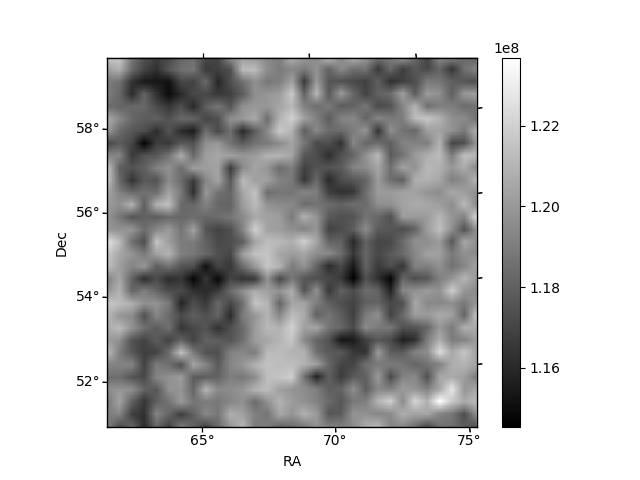
Histogram calculated using DETX and DETY for each event in the final _common_clean file
| Quadrant A | 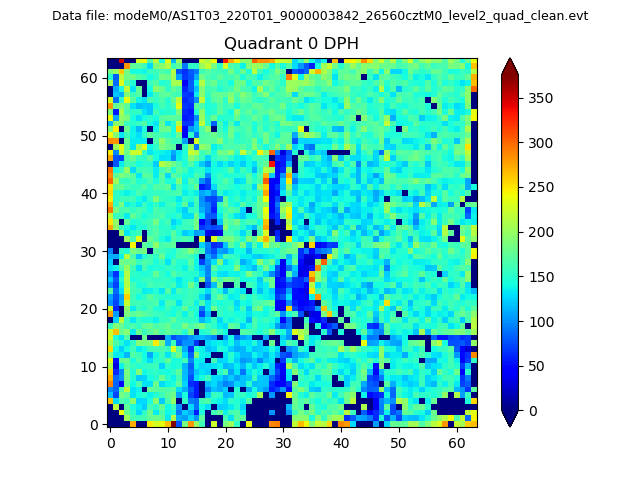 |
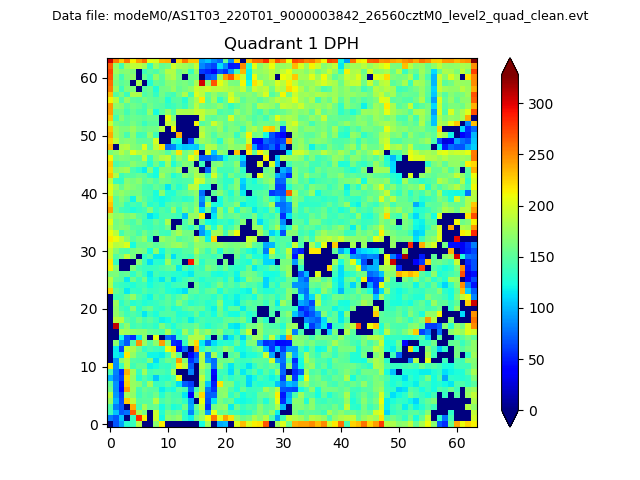 |
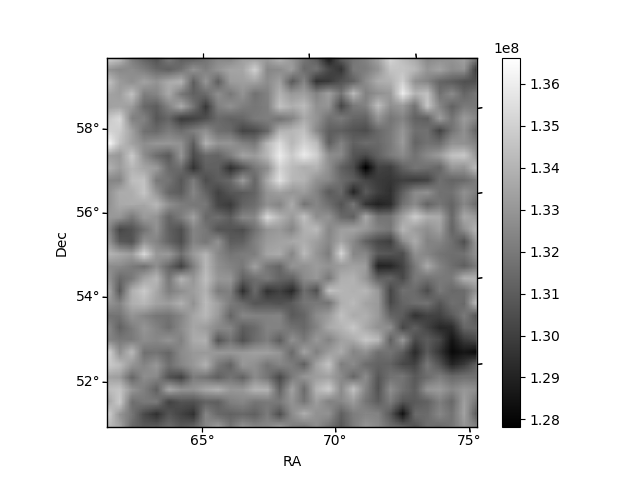
Quadrant B |
|---|---|---|---|
| Quadrant D | 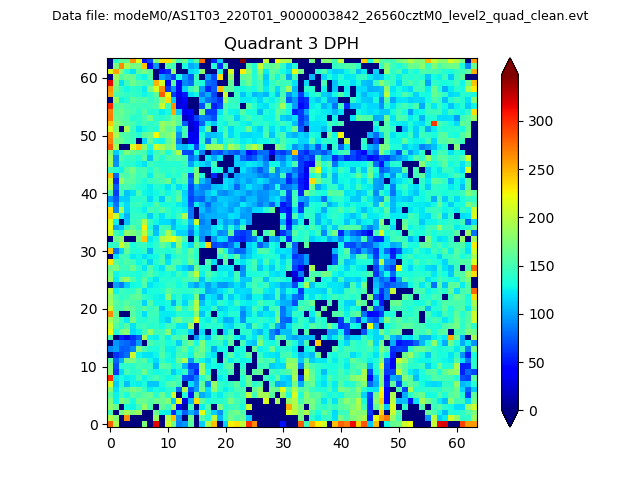 |
 |
Quadrant C |
| Plot type | Count rate plots | Images |
|---|---|---|
| Comparison with Poisson distribution Blue bars denote a histogram of data divided into 1 sec bins. Red curve is a Poisson curve with rate = median count rate of data. |
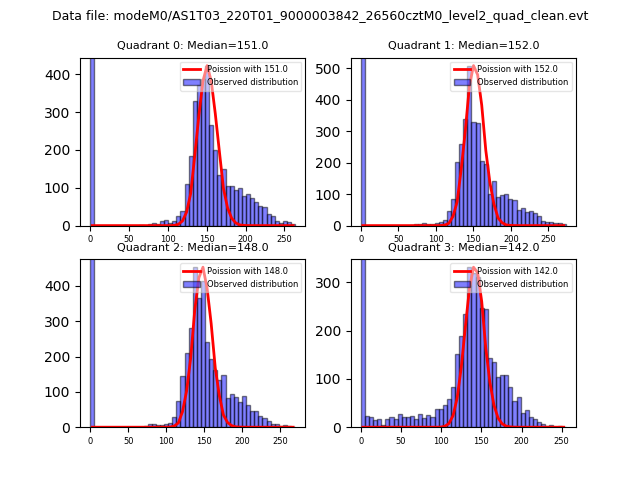 |
 |
| Quadrant-wise count rates Data is divided into 100 sec bins |
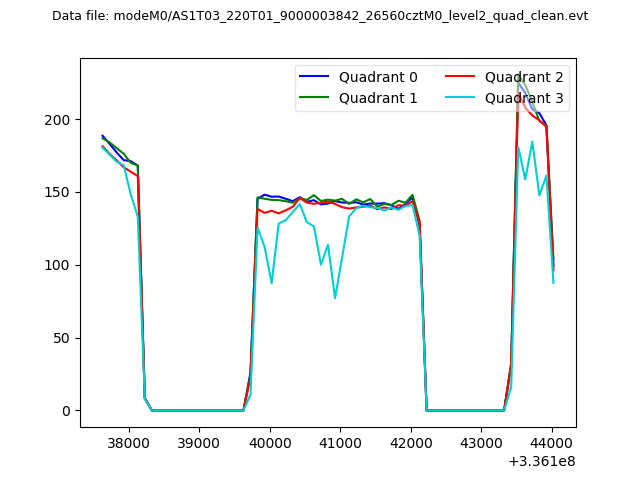 |
|
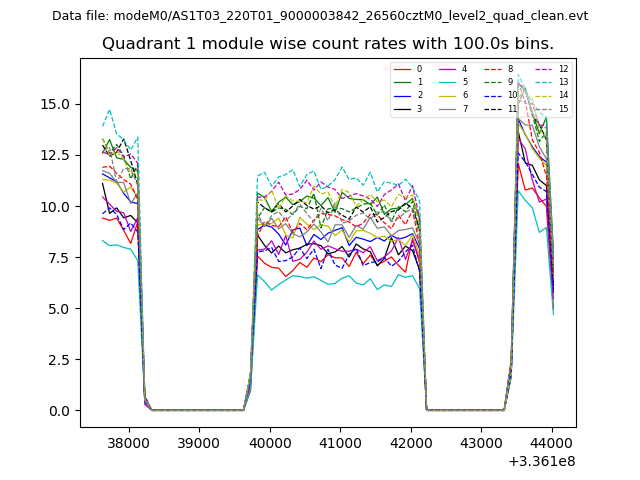
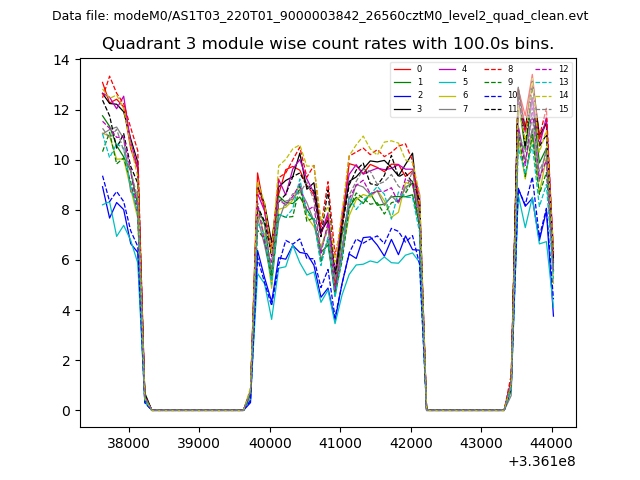
| Module-wise count rates for Quadrant A Data is divided into 100 sec bins |
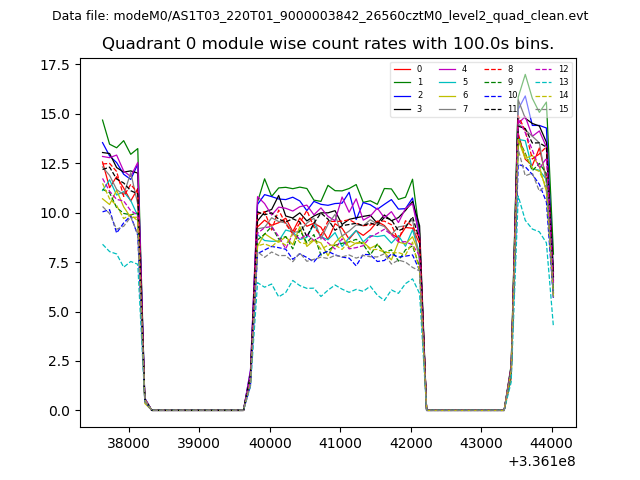 |
 |
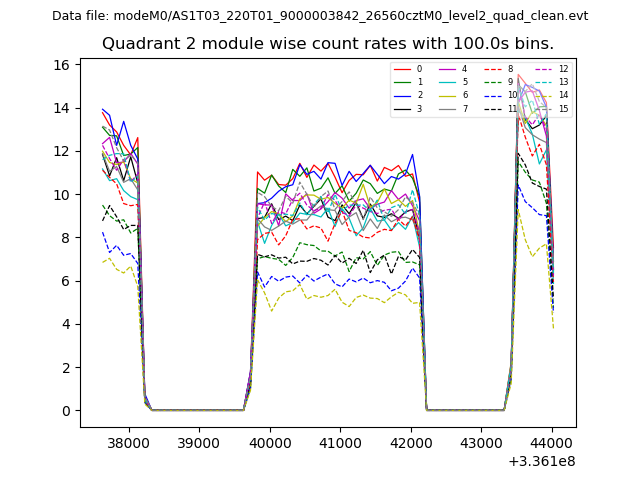
| Module-wise count rates for Quadrant B Data is divided into 100 sec bins |
 |
 |
| Module-wise count rates for Quadrant C Data is divided into 100 sec bins |
 |
 |
| Module-wise count rates for Quadrant D Data is divided into 100 sec bins |
 |
 |
| Parameter | Plot |
|---|---|
| CZT HV Monitor | 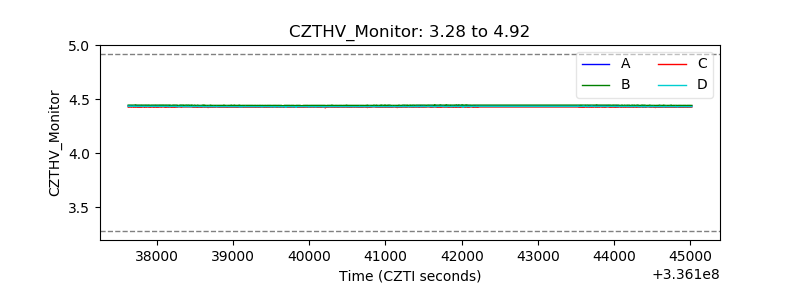 |
| D_VDD | 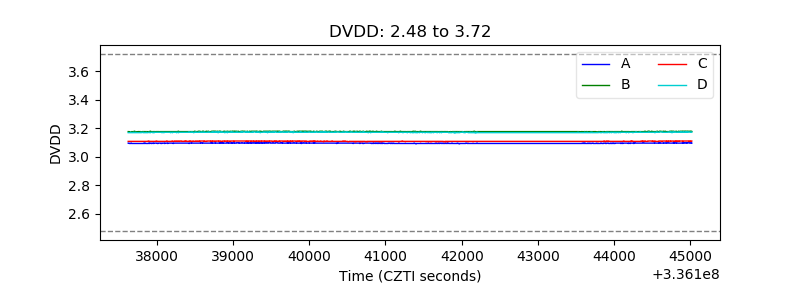 |
| Temperature 1 | 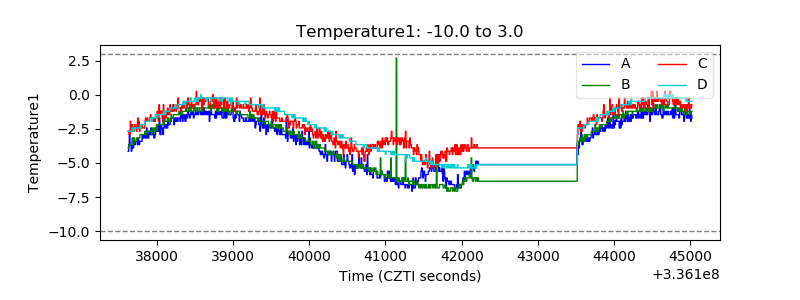 |
| Veto HV Monitor | 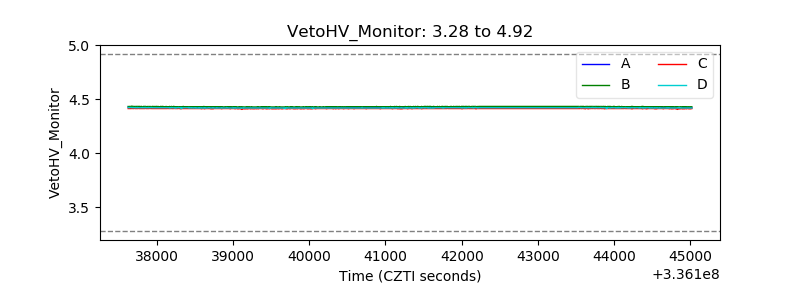 |
| Veto LLD | 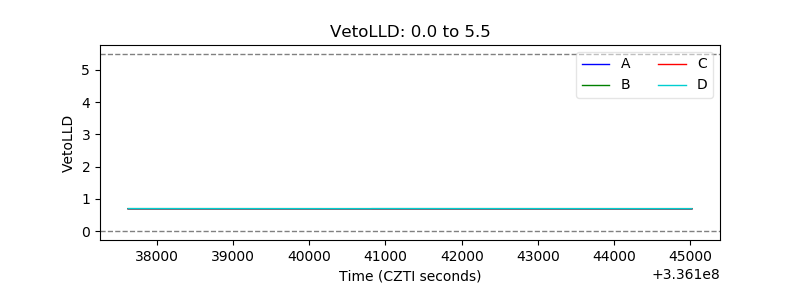 |
| Alpha Counter | 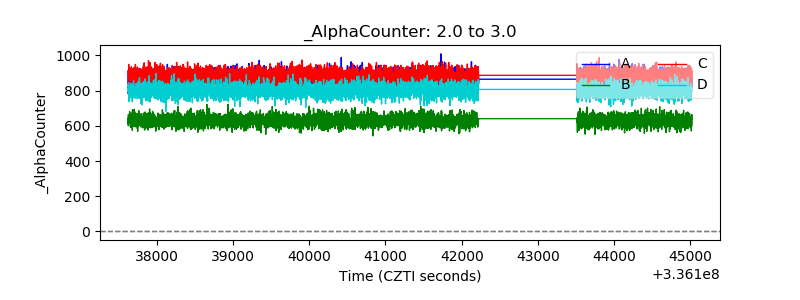 |
| _CPM_Rate | 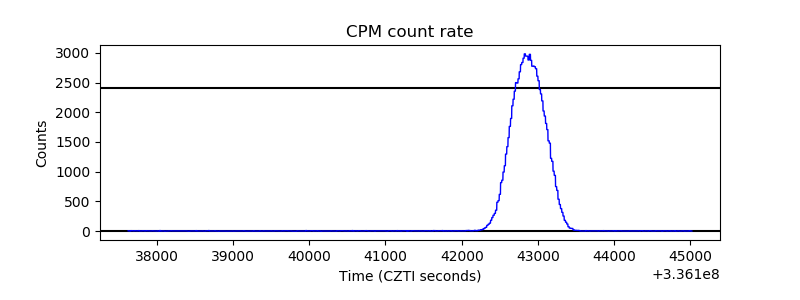 |
| CZT Counter | 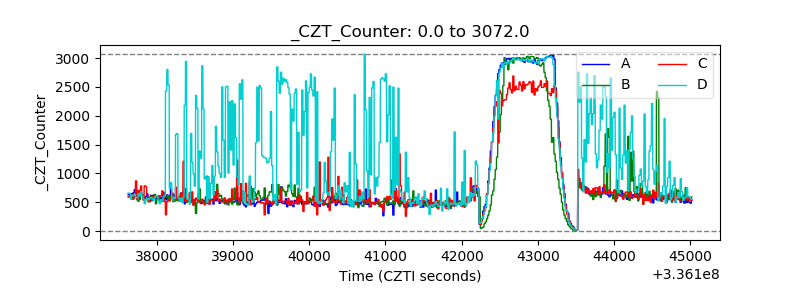 |
| +2.5 Volts monitor |  |
| +5 Volts monitor | 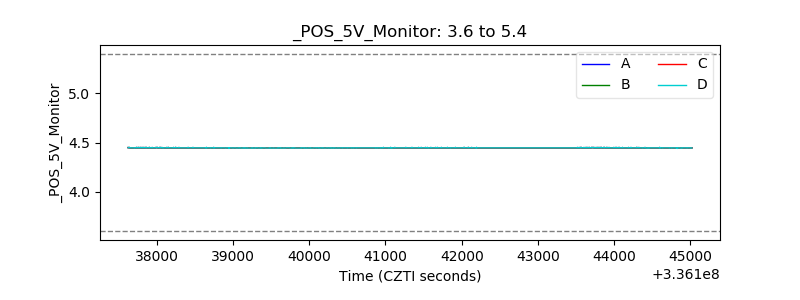 |
| _ROLL_ROT | 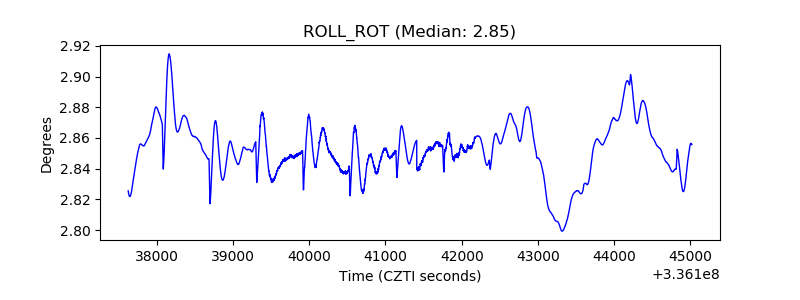 |
| _Roll_DEC | 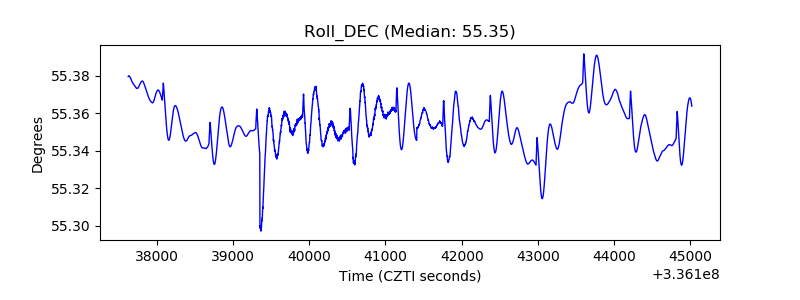 |
| _Roll_RA | 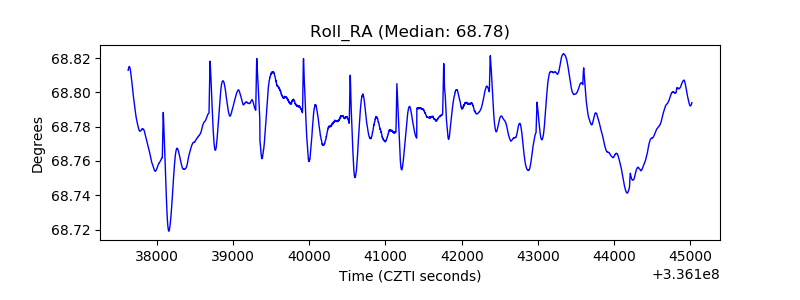 |
| Veto Counter | 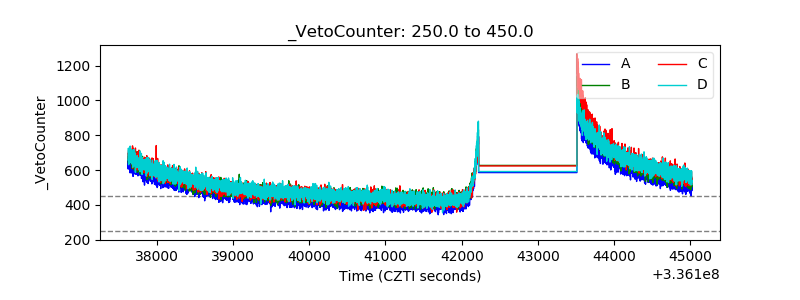 |