| Param | Original file | Final file |
|---|---|---|
| Filename | modeM0/AS1T03_220T01_9000003842_26561cztM0_level2.evt | modeM0/AS1T03_220T01_9000003842_26561cztM0_level2_quad_clean.evt |
| Size (bytes) | 578,079,360 | 79,882,560 |
| Size | 551.3 MB | 76.2 MB |
| Events in quadrant A | 3,372,278 | 506,816 |
| Events in quadrant B | 3,911,723 | 512,343 |
| Events in quadrant C | 3,678,067 | 499,409 |
| Events in quadrant D | 6,131,759 | 473,859 |
| Mode M0 | |||
|---|---|---|---|
| Quadrant | BADHDUFLAG | Total packets | Discarded packets |
| A | 0 | 14014 | 0 |
| B | 0 | 15710 | 0 |
| C | 0 | 15037 | 0 |
| D | 0 | 22316 | 0 |
| Mode M9 | |||
|---|---|---|---|
| Quadrant | BADHDUFLAG | Total packets | Discarded packets |
| A | 0 | 13 | 0 |
| B | 0 | 13 | 0 |
| C | 0 | 13 | 0 |
| D | 0 | 13 | 0 |
| Quadrant | Total seconds | Saturated seconds | Saturation percentage |
|---|---|---|---|
| A | 6100 | 74 | 1.213115% |
| B | 6100 | 156 | 2.557377% |
| C | 6099 | 125 | 2.049516% |
| D | 6099 | 942 | 15.445155% |
Noise dominated data is calculated using 1-second bins in cleaned event files. If a bin has >2000 counts, and if more than 50% of those come from <1% of pixels, then it is considered to be noise-dominated and hence unusable.
| Quadrant | # 1 sec bins | Bins with >0 counts | Bins with >2000 counts | High rate bins dominated by noise | Noise dominated (total time) | Noise dominated (detector-on time) | Marked lightcurve |
|---|---|---|---|---|---|---|---|
| A | 7475 | 6100 | 0 | 0 | 0.00% | 0.00% | 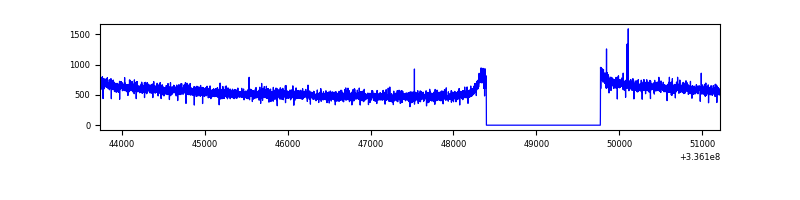 |
| B | 7475 | 6100 | 49 | 49 | 0.66% | 0.80% | 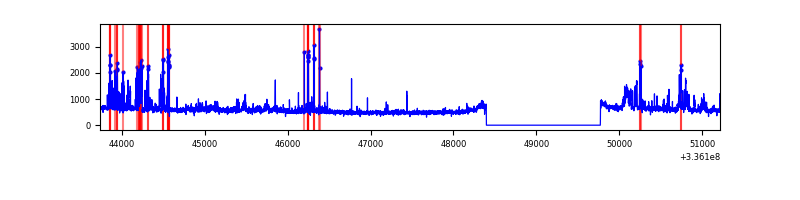 |
| C | 7474 | 6099 | 8 | 8 | 0.11% | 0.13% | 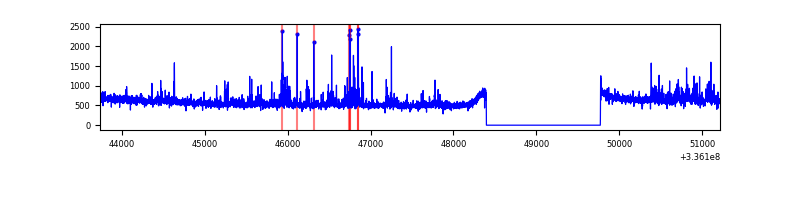 |
| D | 7474 | 6099 | 818 | 818 | 10.94% | 13.41% | 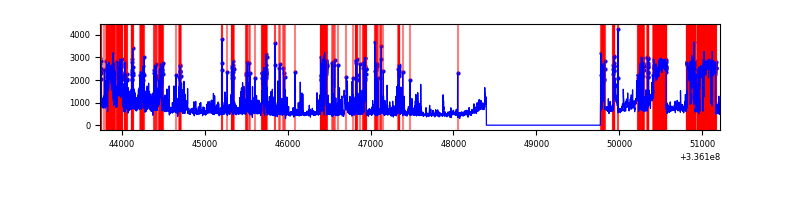 |
Top three noisy pixels from each quadrant. If the there are fewer than three noisy pixels in the level2.evt file, extra rows are filled as -1
| Pixel properties | Quadrant properties | ||||||
|---|---|---|---|---|---|---|---|
| Quadrant | DetID | PixID | Counts | Sigma | Mean | Median | Sigma |
| A | 5 | 168 | 28823 | 165.91 | 863 | 850 | 168.6 |
| A | 0 | 13 | 13981 | 77.88 | 863 | 850 | 168.6 |
| A | 13 | 254 | 10653 | 58.14 | 863 | 850 | 168.6 |
| B | 0 | 189 | 252863 | 1641.65 | 848 | 831 | 153.5 |
| B | 5 | 172 | 214176 | 1389.66 | 848 | 831 | 153.5 |
| B | 3 | 64 | 87654 | 565.54 | 848 | 831 | 153.5 |
| C | 4 | 254 | 172075 | 904.46 | 826 | 832 | 189.3 |
| C | 14 | 238 | 134445 | 705.71 | 826 | 832 | 189.3 |
| C | 3 | 233 | 132346 | 694.62 | 826 | 832 | 189.3 |
| D | 7 | 80 | 1944446 | 10401.69 | 780 | 762 | 186.9 |
| D | 1 | 52 | 984745 | 5265.82 | 780 | 762 | 186.9 |
| D | 2 | 250 | 158814 | 845.82 | 780 | 762 | 186.9 |
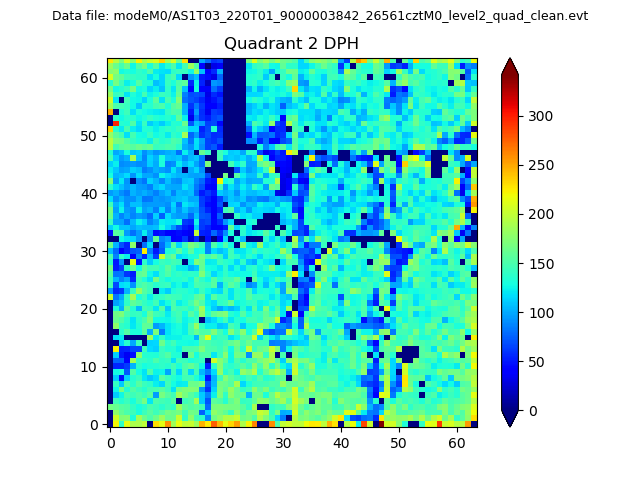
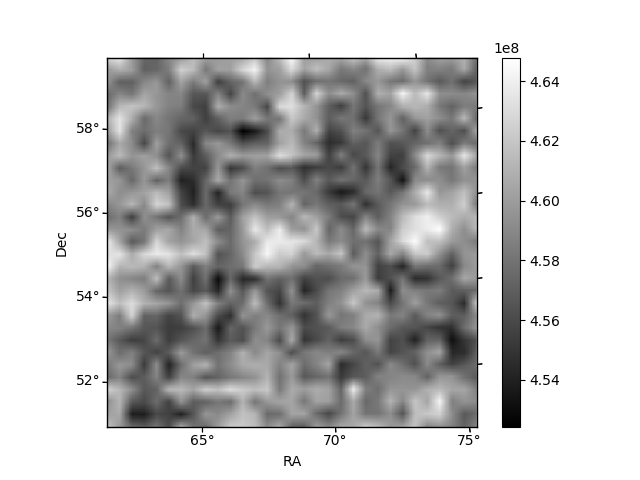
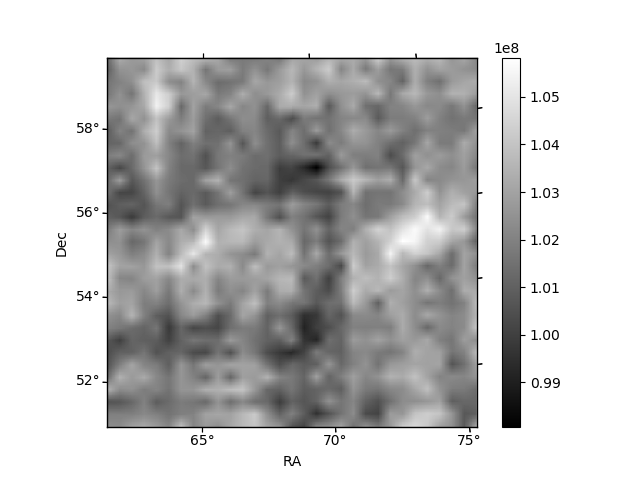
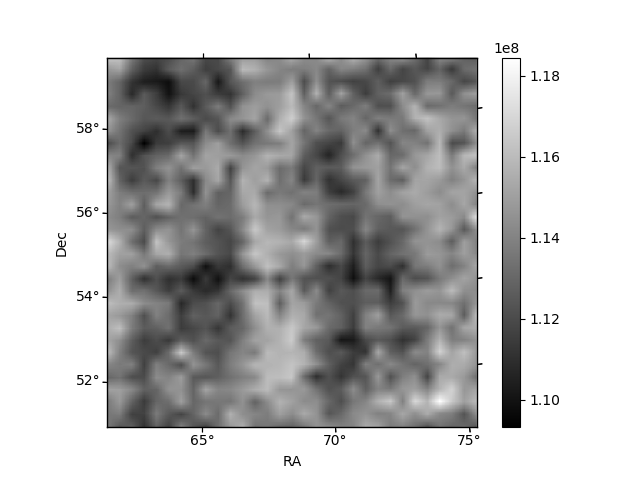
Histogram calculated using DETX and DETY for each event in the final _common_clean file
| Quadrant A | 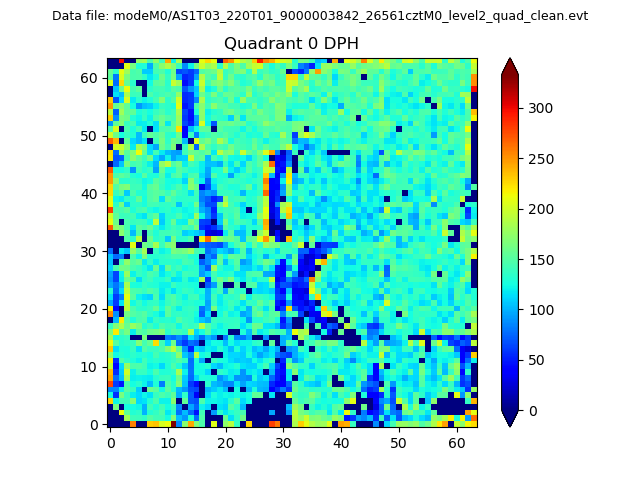 |
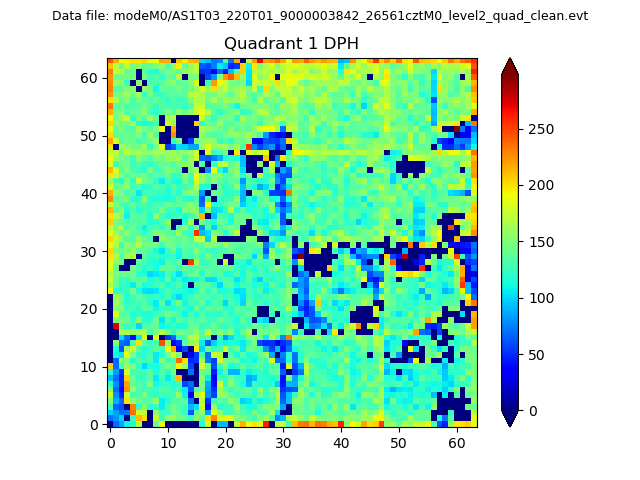 |
Quadrant B |
|---|---|---|---|
| Quadrant D | 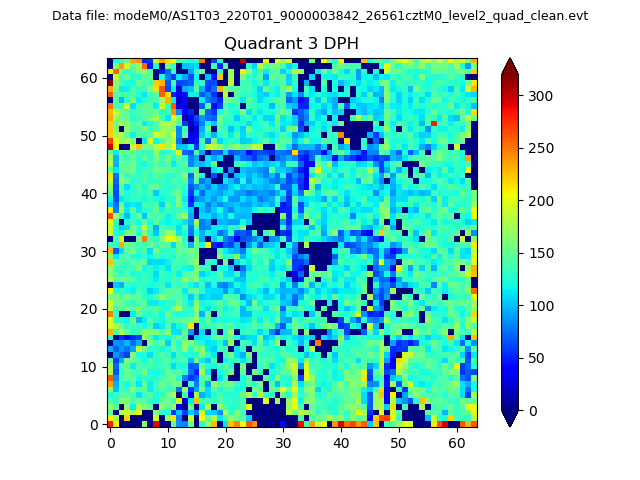 |
 |
Quadrant C |
| Plot type | Count rate plots | Images |
|---|---|---|
| Comparison with Poisson distribution Blue bars denote a histogram of data divided into 1 sec bins. Red curve is a Poisson curve with rate = median count rate of data. |
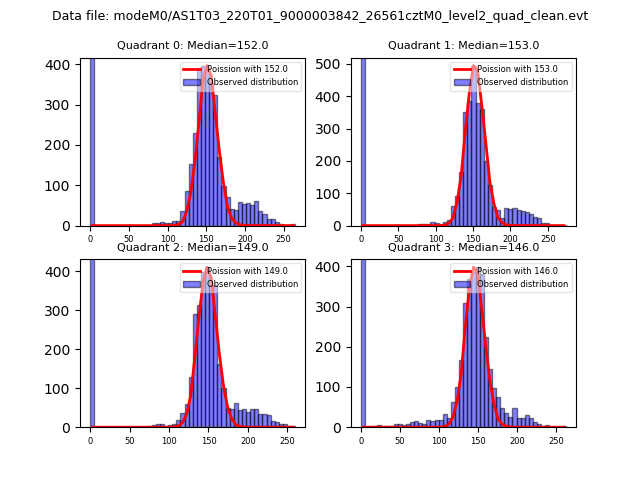 |
 |
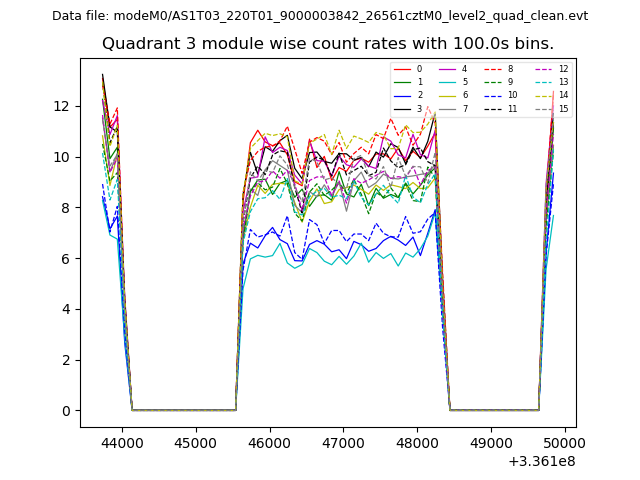
| Quadrant-wise count rates Data is divided into 100 sec bins |
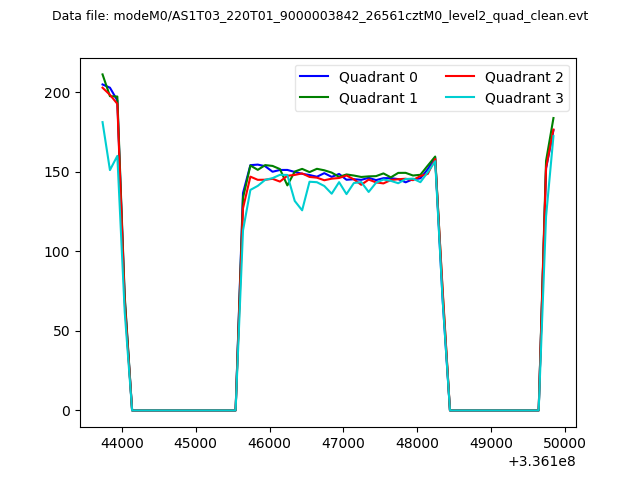 |
|
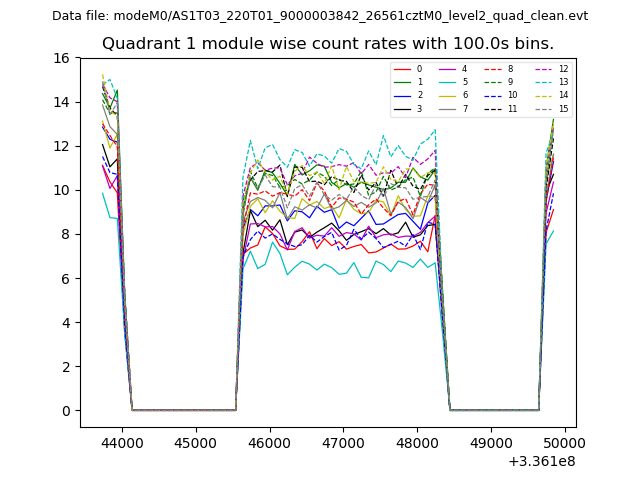
| Module-wise count rates for Quadrant A Data is divided into 100 sec bins |
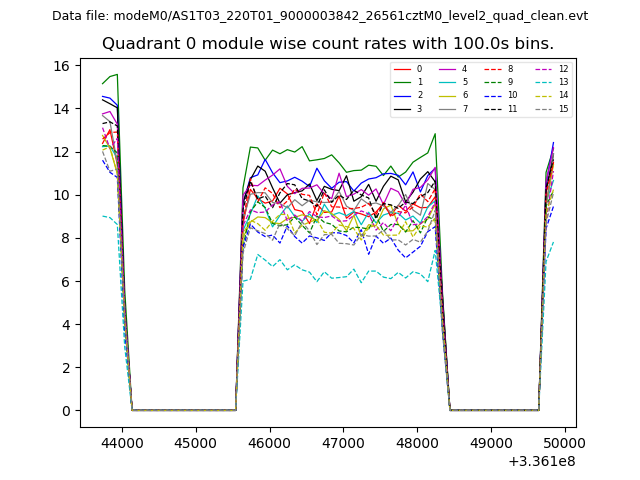 |
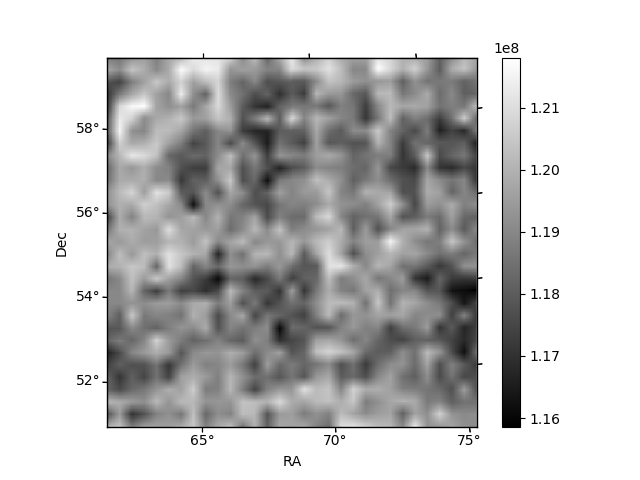 |
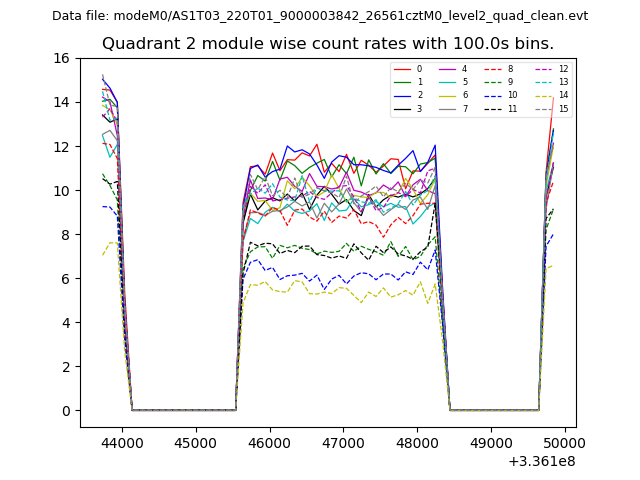
| Module-wise count rates for Quadrant B Data is divided into 100 sec bins |
 |
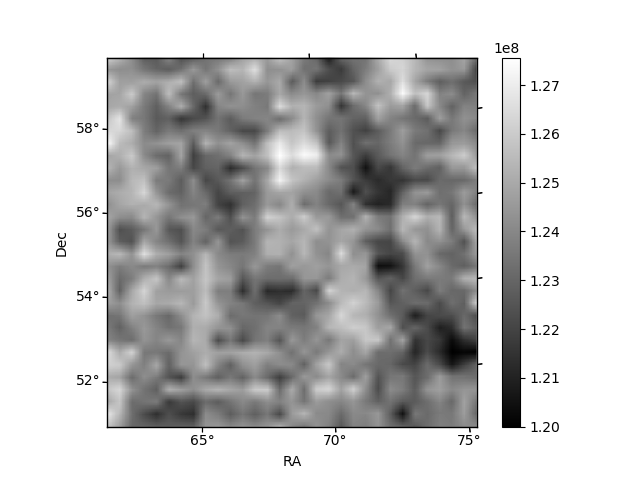 |
| Module-wise count rates for Quadrant C Data is divided into 100 sec bins |
 |
 |
| Module-wise count rates for Quadrant D Data is divided into 100 sec bins |
 |
 |
| Parameter | Plot |
|---|---|
| CZT HV Monitor | 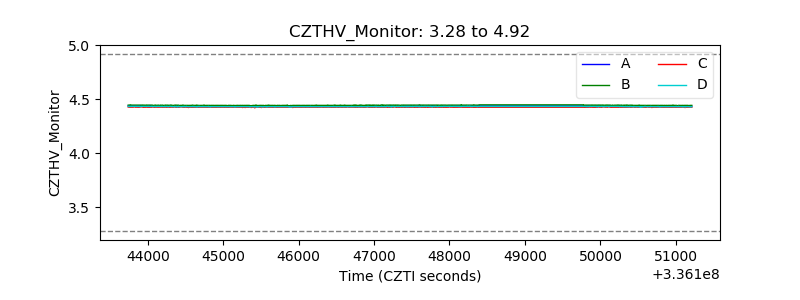 |
| D_VDD | 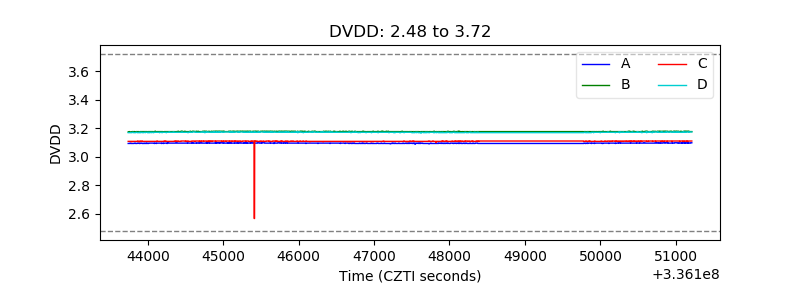 |
| Temperature 1 | 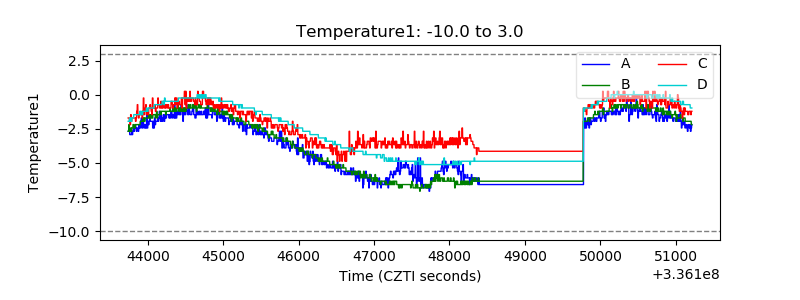 |
| Veto HV Monitor | 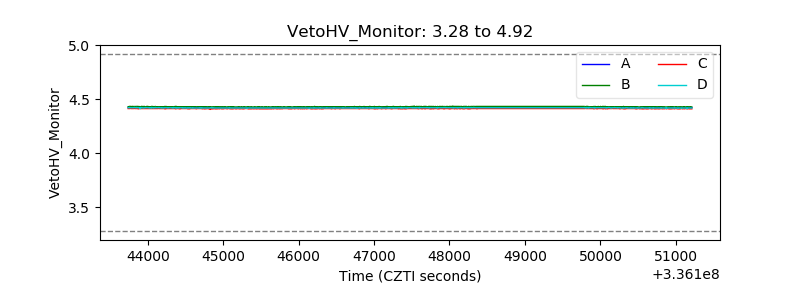 |
| Veto LLD | 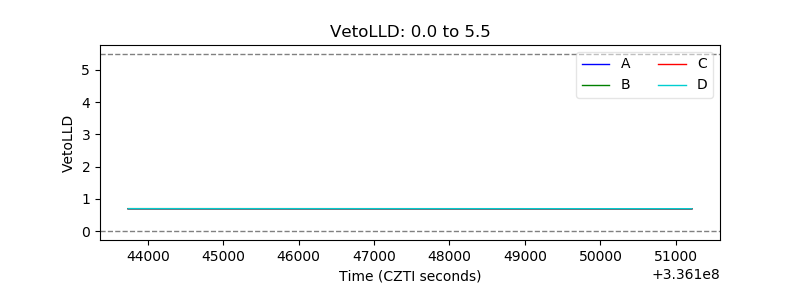 |
| Alpha Counter | 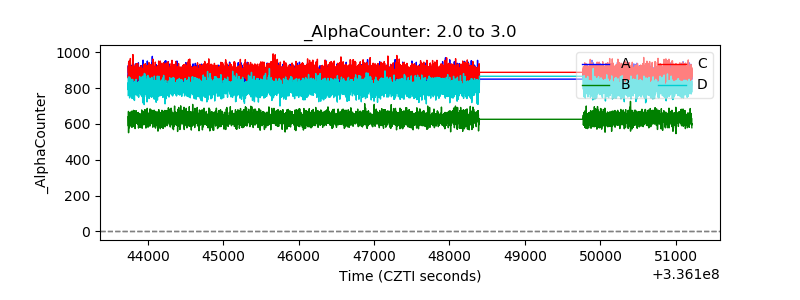 |
| _CPM_Rate | 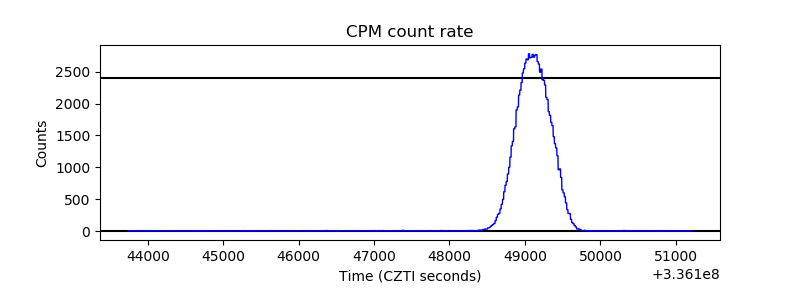 |
| CZT Counter | 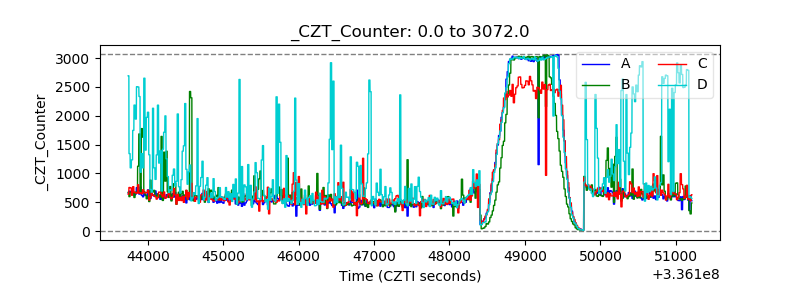 |
| +2.5 Volts monitor | 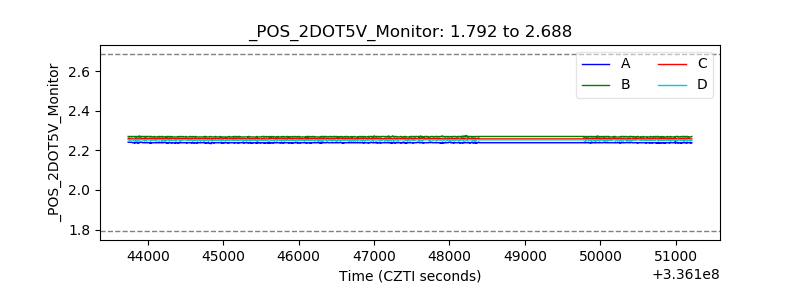 |
| +5 Volts monitor | 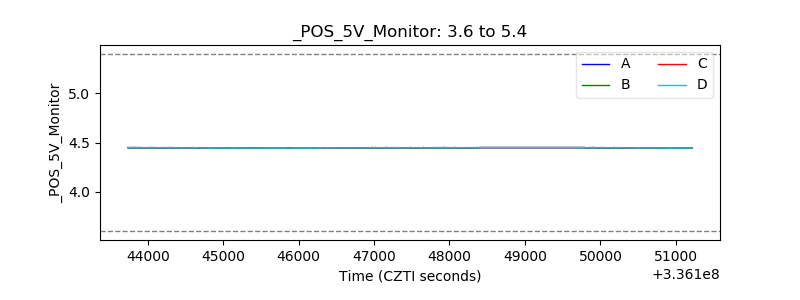 |
| _ROLL_ROT | 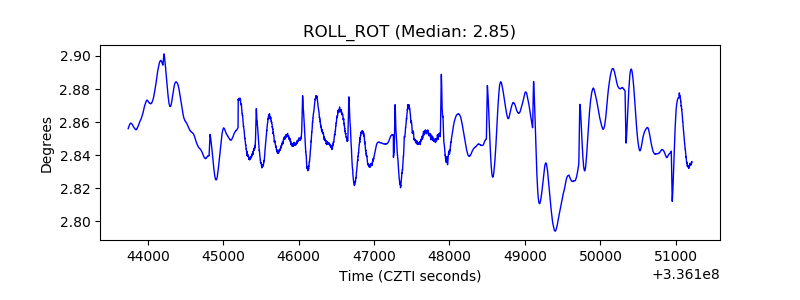 |
| _Roll_DEC |  |
| _Roll_RA | 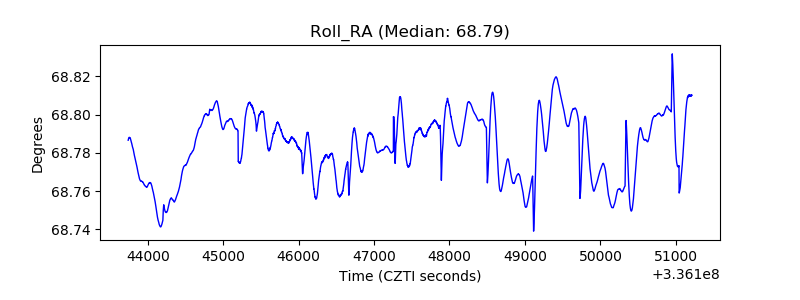 |
| Veto Counter | 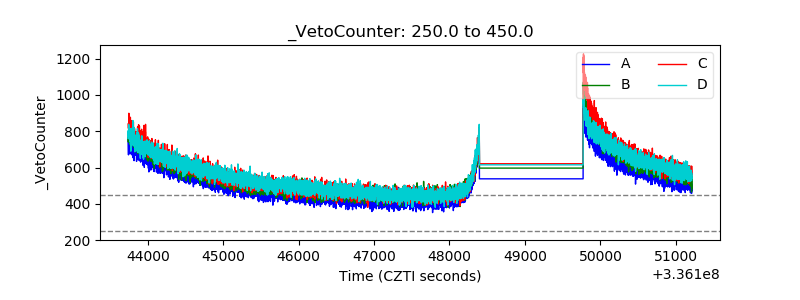 |