| Param | Original file | Final file |
|---|---|---|
| Filename | modeM0/AS1T03_220T01_9000003842_26562cztM0_level2.evt | modeM0/AS1T03_220T01_9000003842_26562cztM0_level2_quad_clean.evt |
| Size (bytes) | 636,655,680 | 77,037,120 |
| Size | 607.2 MB | 73.5 MB |
| Events in quadrant A | 3,444,023 | 492,871 |
| Events in quadrant B | 4,572,835 | 485,721 |
| Events in quadrant C | 3,857,155 | 486,917 |
| Events in quadrant D | 6,988,419 | 434,644 |
| Mode M0 | |||
|---|---|---|---|
| Quadrant | BADHDUFLAG | Total packets | Discarded packets |
| A | 0 | 14260 | 0 |
| B | 0 | 17797 | 0 |
| C | 0 | 15678 | 0 |
| D | 0 | 25120 | 0 |
| Mode M9 | |||
|---|---|---|---|
| Quadrant | BADHDUFLAG | Total packets | Discarded packets |
| A | 0 | 13 | 0 |
| B | 0 | 13 | 0 |
| C | 0 | 13 | 0 |
| D | 0 | 13 | 0 |
| Quadrant | Total seconds | Saturated seconds | Saturation percentage |
|---|---|---|---|
| A | 6190 | 112 | 1.809370% |
| B | 6191 | 358 | 5.782588% |
| C | 6191 | 182 | 2.939751% |
| D | 6190 | 1249 | 20.177706% |
Noise dominated data is calculated using 1-second bins in cleaned event files. If a bin has >2000 counts, and if more than 50% of those come from <1% of pixels, then it is considered to be noise-dominated and hence unusable.
| Quadrant | # 1 sec bins | Bins with >0 counts | Bins with >2000 counts | High rate bins dominated by noise | Noise dominated (total time) | Noise dominated (detector-on time) | Marked lightcurve |
|---|---|---|---|---|---|---|---|
| A | 7535 | 6190 | 0 | 0 | 0.00% | 0.00% | 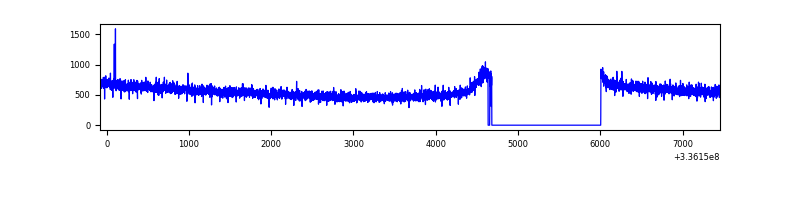 |
| B | 7536 | 6191 | 177 | 177 | 2.35% | 2.86% | 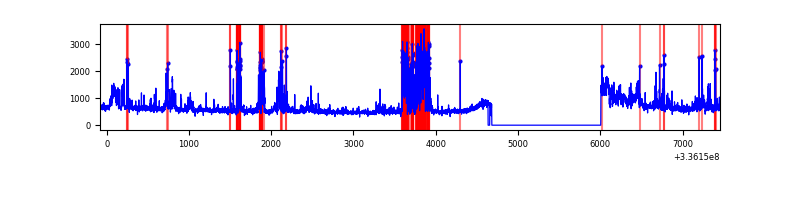 |
| C | 7536 | 6191 | 3 | 3 | 0.04% | 0.05% | 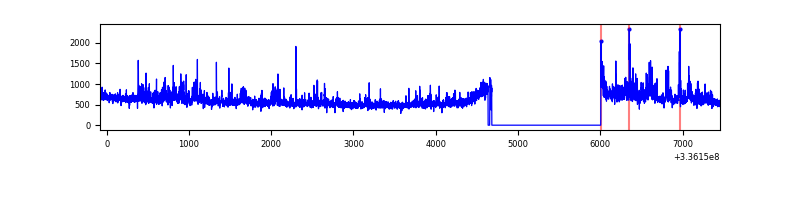 |
| D | 7535 | 6190 | 1191 | 1191 | 15.81% | 19.24% | 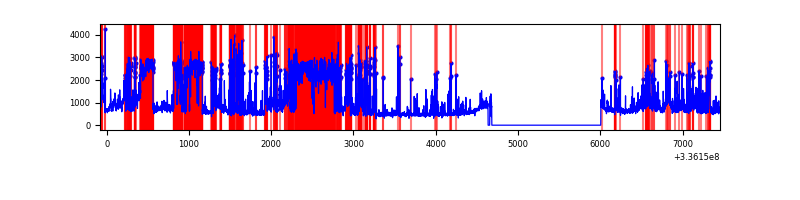 |
Top three noisy pixels from each quadrant. If the there are fewer than three noisy pixels in the level2.evt file, extra rows are filled as -1
| Pixel properties | Quadrant properties | ||||||
|---|---|---|---|---|---|---|---|
| Quadrant | DetID | PixID | Counts | Sigma | Mean | Median | Sigma |
| A | 5 | 168 | 74877 | 434.38 | 868 | 857 | 170.4 |
| A | 0 | 13 | 14320 | 79.01 | 868 | 857 | 170.4 |
| A | 13 | 254 | 11163 | 60.48 | 868 | 857 | 170.4 |
| B | 3 | 64 | 491642 | 3170.01 | 851 | 832 | 154.8 |
| B | 5 | 172 | 357903 | 2306.22 | 851 | 832 | 154.8 |
| B | 0 | 189 | 305265 | 1966.25 | 851 | 832 | 154.8 |
| C | 3 | 233 | 413376 | 2168.24 | 835 | 843 | 190.3 |
| C | 14 | 238 | 136861 | 714.9 | 835 | 843 | 190.3 |
| C | 4 | 254 | 35939 | 184.46 | 835 | 843 | 190.3 |
| D | 7 | 80 | 2723318 | 13418.74 | 771 | 754 | 202.9 |
| D | 1 | 52 | 885854 | 4362.4 | 771 | 754 | 202.9 |
| D | 2 | 250 | 347942 | 1711.19 | 771 | 754 | 202.9 |
Histogram calculated using DETX and DETY for each event in the final _common_clean file
| Quadrant A | 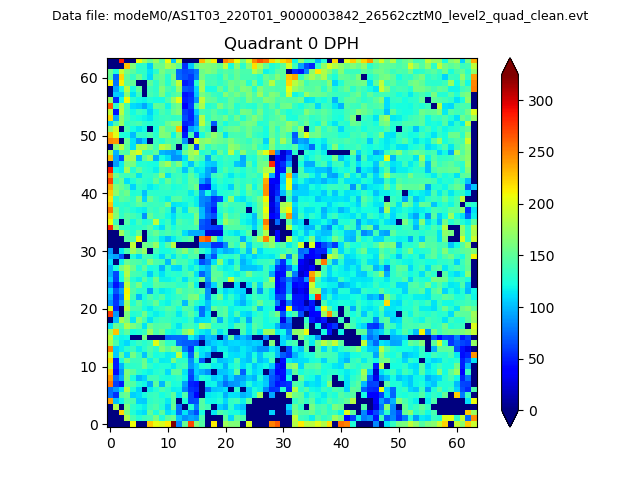 |
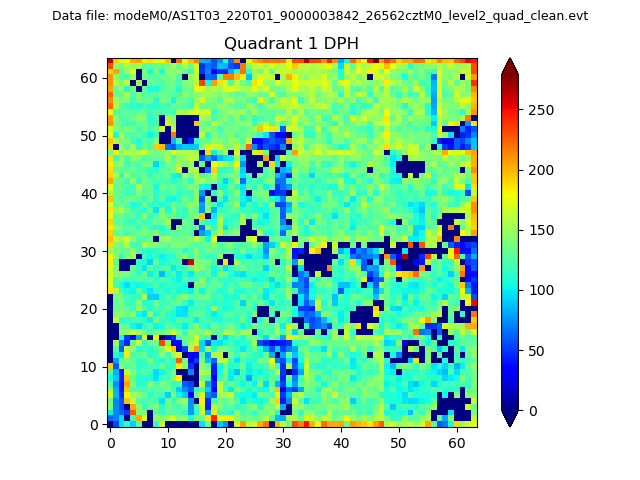 |
Quadrant B |
|---|---|---|---|
| Quadrant D | 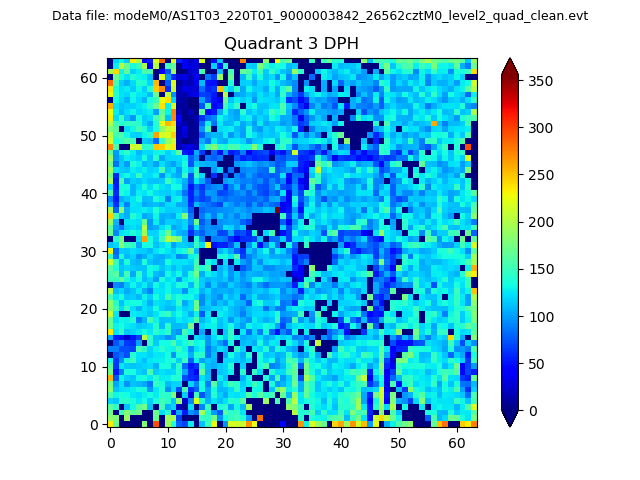 |
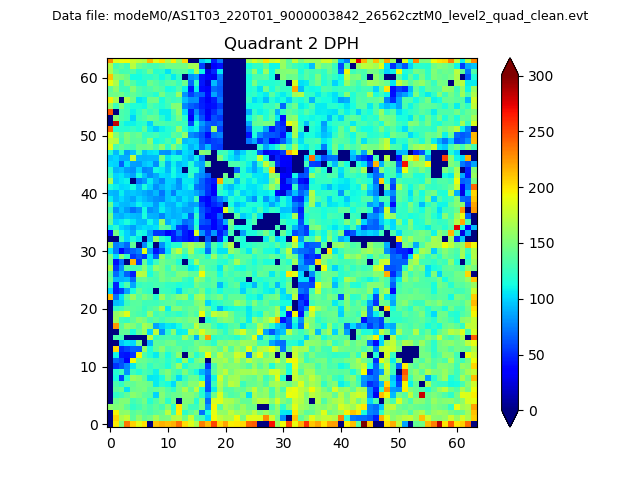 |
Quadrant C |
| Plot type | Count rate plots | Images |
|---|---|---|
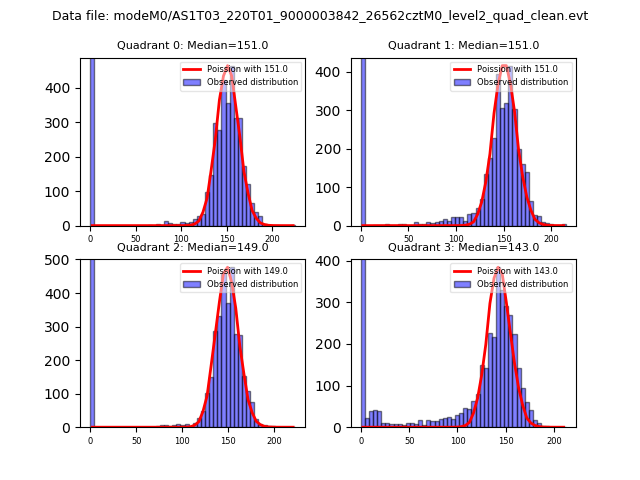
| Comparison with Poisson distribution Blue bars denote a histogram of data divided into 1 sec bins. Red curve is a Poisson curve with rate = median count rate of data. |
 |
 |
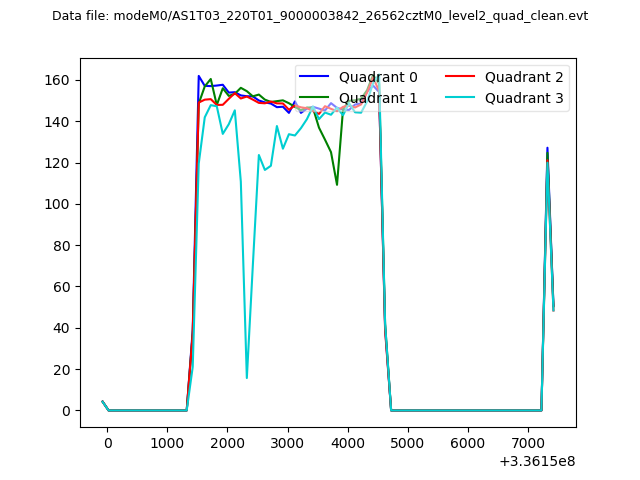
| Quadrant-wise count rates Data is divided into 100 sec bins |
 |
|
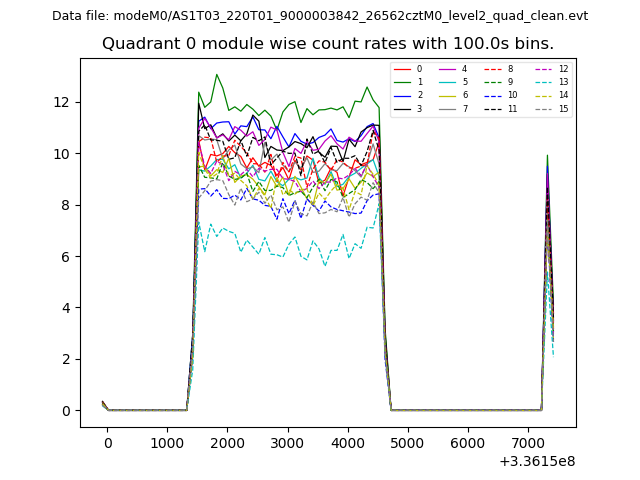
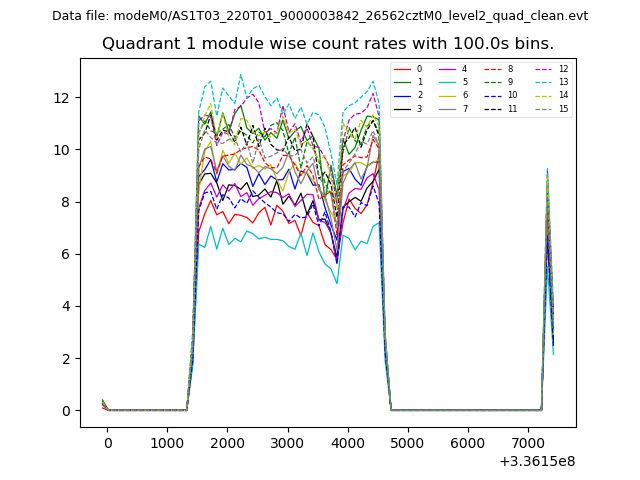
| Module-wise count rates for Quadrant A Data is divided into 100 sec bins |
 |
 |
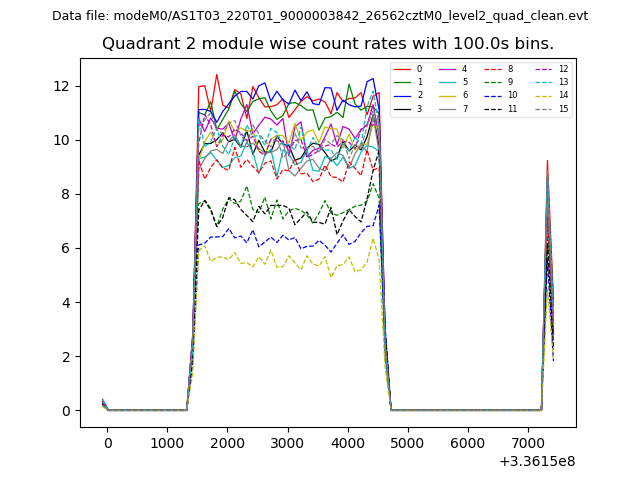
| Module-wise count rates for Quadrant B Data is divided into 100 sec bins |
 |
 |
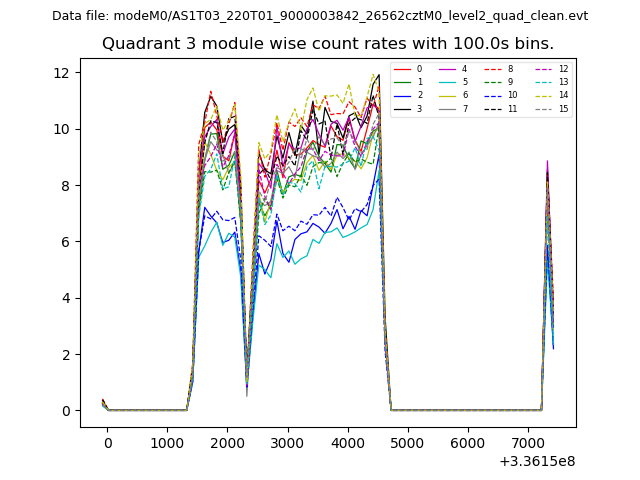
| Module-wise count rates for Quadrant C Data is divided into 100 sec bins |
 |
 |
| Module-wise count rates for Quadrant D Data is divided into 100 sec bins |
 |
 |
| Parameter | Plot |
|---|---|
| CZT HV Monitor | 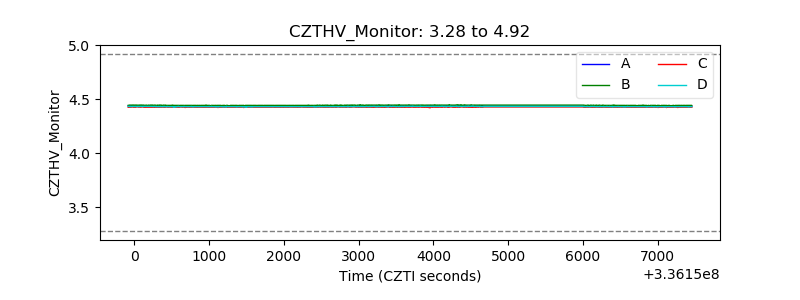 |
| D_VDD | 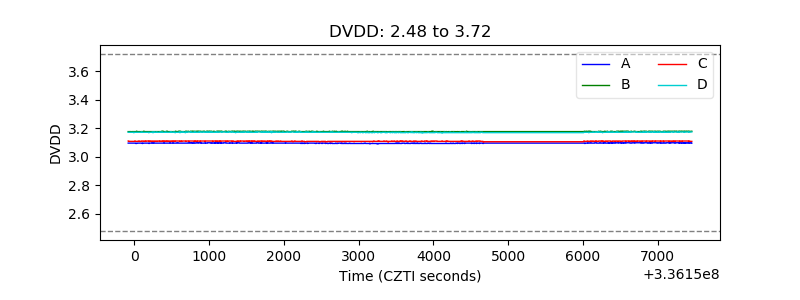 |
| Temperature 1 | 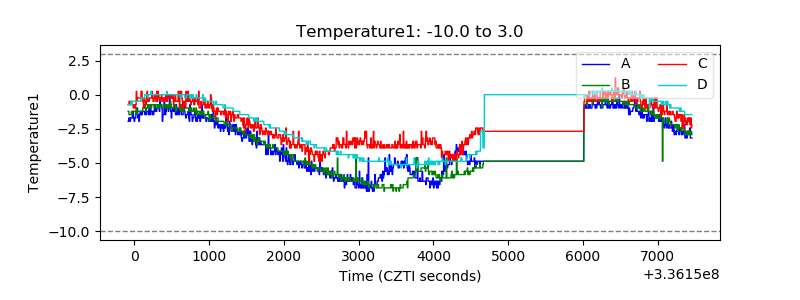 |
| Veto HV Monitor | 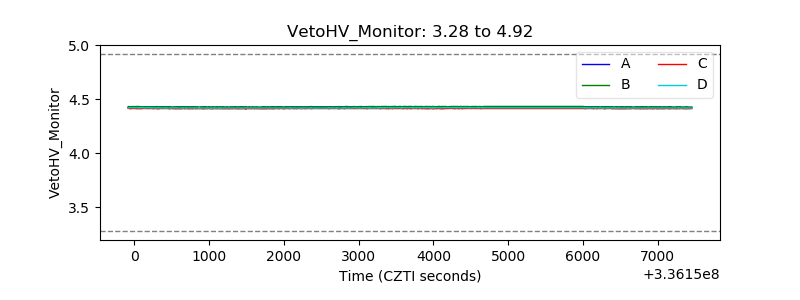 |
| Veto LLD | 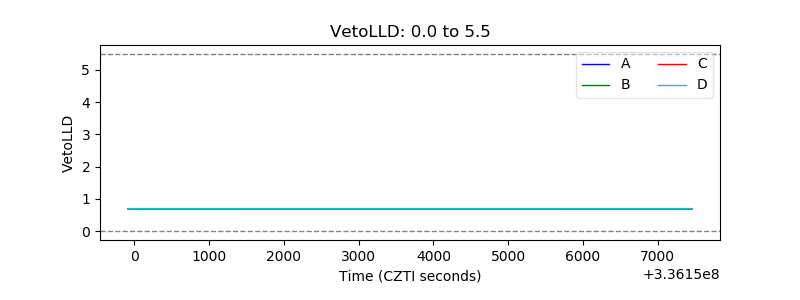 |
| Alpha Counter | 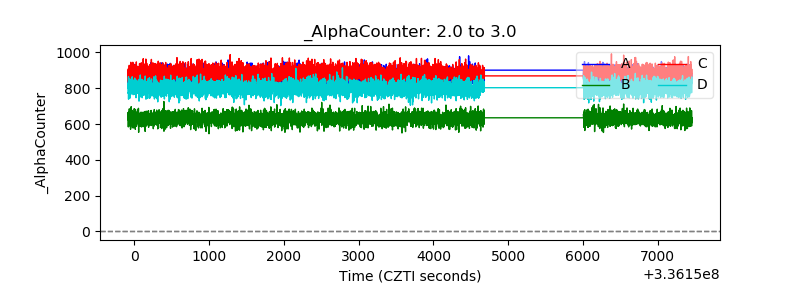 |
| _CPM_Rate |  |
| CZT Counter | 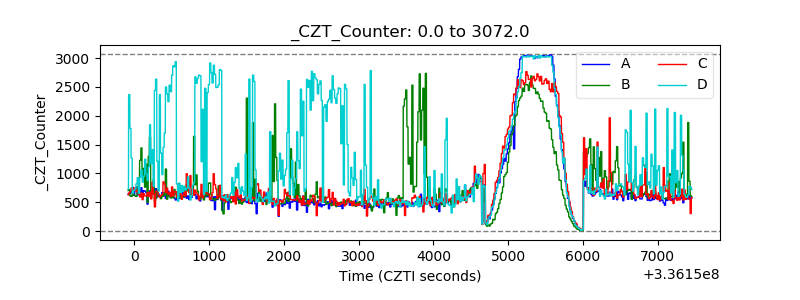 |
| +2.5 Volts monitor | 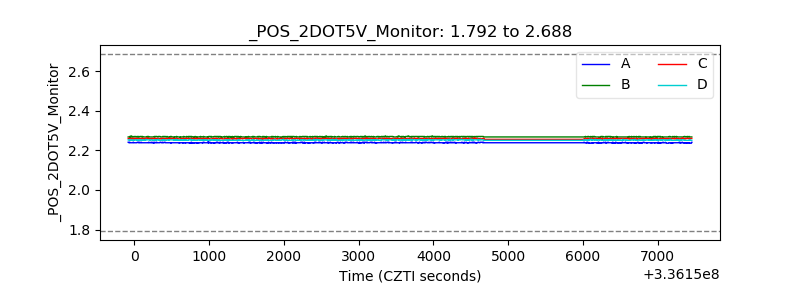 |
| +5 Volts monitor | 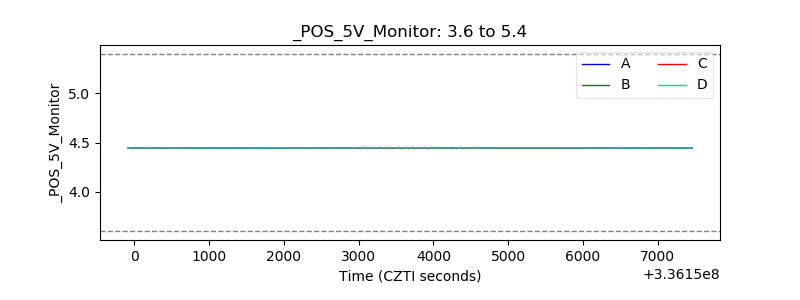 |
| _ROLL_ROT | 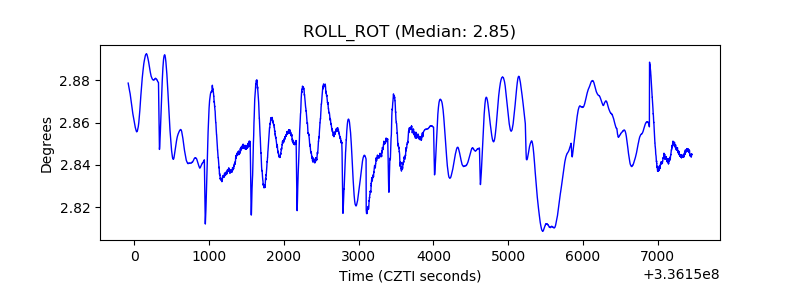 |
| _Roll_DEC |  |
| _Roll_RA | 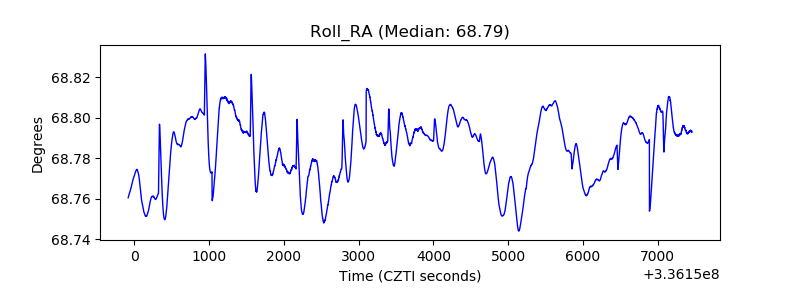 |
| Veto Counter | 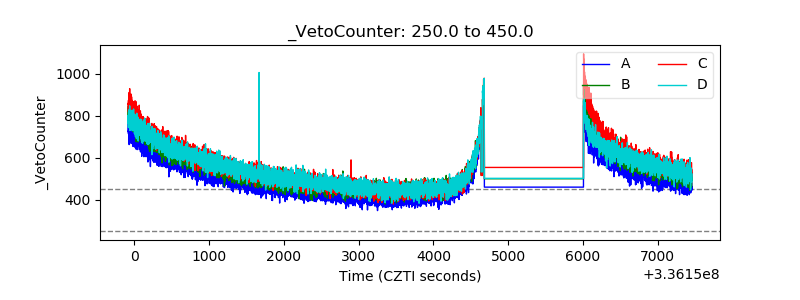 |