| Param | Original file | Final file |
|---|---|---|
| Filename | modeM0/AS1T03_220T01_9000003842_26563cztM0_level2.evt | modeM0/AS1T03_220T01_9000003842_26563cztM0_level2_quad_clean.evt |
| Size (bytes) | 589,999,680 | 92,030,400 |
| Size | 562.7 MB | 87.8 MB |
| Events in quadrant A | 3,470,014 | 592,668 |
| Events in quadrant B | 4,276,655 | 599,515 |
| Events in quadrant C | 3,976,829 | 592,875 |
| Events in quadrant D | 5,716,810 | 560,893 |
| Mode M0 | |||
|---|---|---|---|
| Quadrant | BADHDUFLAG | Total packets | Discarded packets |
| A | 0 | 14299 | 0 |
| B | 0 | 16954 | 0 |
| C | 0 | 16053 | 0 |
| D | 0 | 21484 | 0 |
| Mode M9 | |||
|---|---|---|---|
| Quadrant | BADHDUFLAG | Total packets | Discarded packets |
| A | 0 | 12 | 0 |
| B | 0 | 12 | 0 |
| C | 0 | 12 | 0 |
| D | 0 | 12 | 0 |
| Quadrant | Total seconds | Saturated seconds | Saturation percentage |
|---|---|---|---|
| A | 6314 | 122 | 1.932214% |
| B | 6313 | 235 | 3.722477% |
| C | 6313 | 191 | 3.025503% |
| D | 6314 | 735 | 11.640798% |
Noise dominated data is calculated using 1-second bins in cleaned event files. If a bin has >2000 counts, and if more than 50% of those come from <1% of pixels, then it is considered to be noise-dominated and hence unusable.
| Quadrant | # 1 sec bins | Bins with >0 counts | Bins with >2000 counts | High rate bins dominated by noise | Noise dominated (total time) | Noise dominated (detector-on time) | Marked lightcurve |
|---|---|---|---|---|---|---|---|
| A | 7544 | 6314 | 24 | 24 | 0.32% | 0.38% | 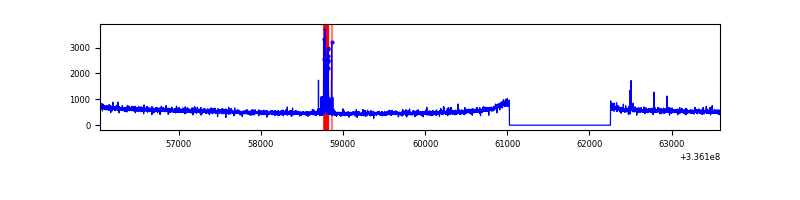 |
| B | 7543 | 6313 | 91 | 91 | 1.21% | 1.44% | 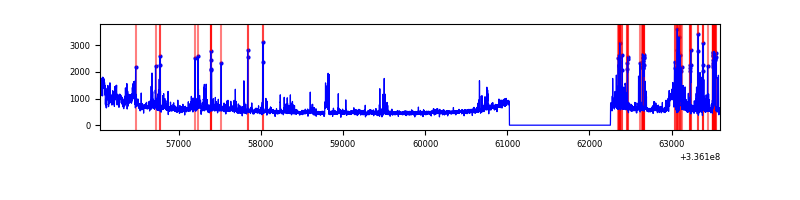 |
| C | 7543 | 6313 | 23 | 23 | 0.30% | 0.36% | 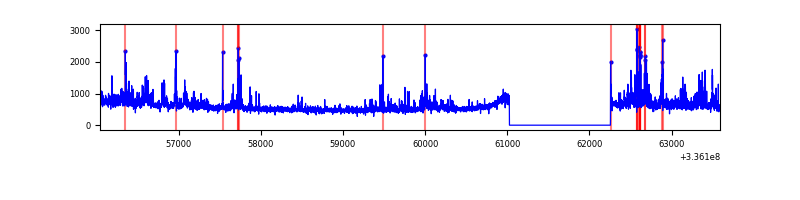 |
| D | 7543 | 6313 | 581 | 581 | 7.70% | 9.20% | 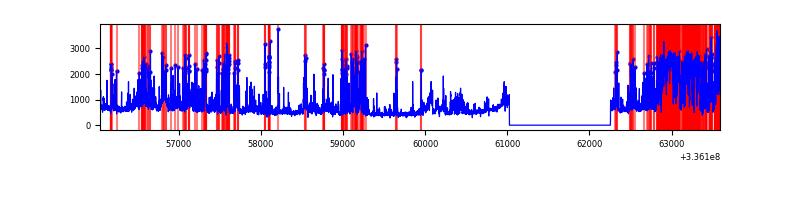 |
Top three noisy pixels from each quadrant. If the there are fewer than three noisy pixels in the level2.evt file, extra rows are filled as -1
| Pixel properties | Quadrant properties | ||||||
|---|---|---|---|---|---|---|---|
| Quadrant | DetID | PixID | Counts | Sigma | Mean | Median | Sigma |
| A | 9 | 130 | 118091 | 698.23 | 844 | 829 | 167.9 |
| A | 5 | 168 | 69650 | 409.79 | 844 | 829 | 167.9 |
| A | 0 | 13 | 24980 | 143.8 | 844 | 829 | 167.9 |
| B | 5 | 172 | 464602 | 3029.47 | 835 | 816 | 153.1 |
| B | 0 | 189 | 234828 | 1528.58 | 835 | 816 | 153.1 |
| B | 3 | 112 | 134224 | 871.43 | 835 | 816 | 153.1 |
| C | 3 | 233 | 620923 | 3303.96 | 821 | 827 | 187.7 |
| C | 14 | 238 | 132608 | 702.15 | 821 | 827 | 187.7 |
| C | 4 | 254 | 7291 | 34.44 | 821 | 827 | 187.7 |
| D | 7 | 80 | 976094 | 5050.02 | 800 | 778 | 193.1 |
| D | 2 | 250 | 673717 | 3484.36 | 800 | 778 | 193.1 |
| D | 12 | 233 | 544758 | 2816.63 | 800 | 778 | 193.1 |
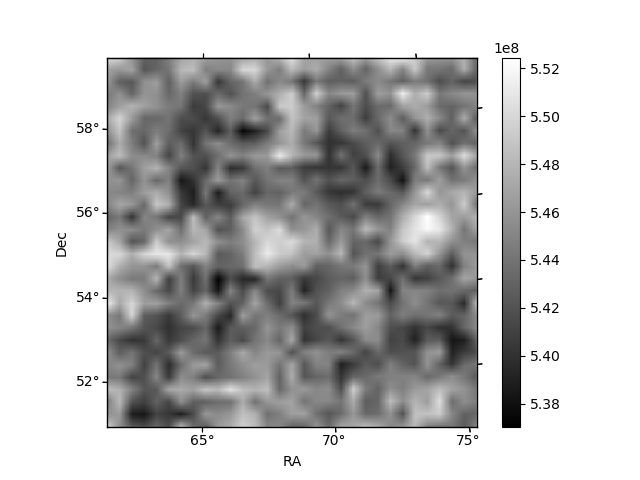
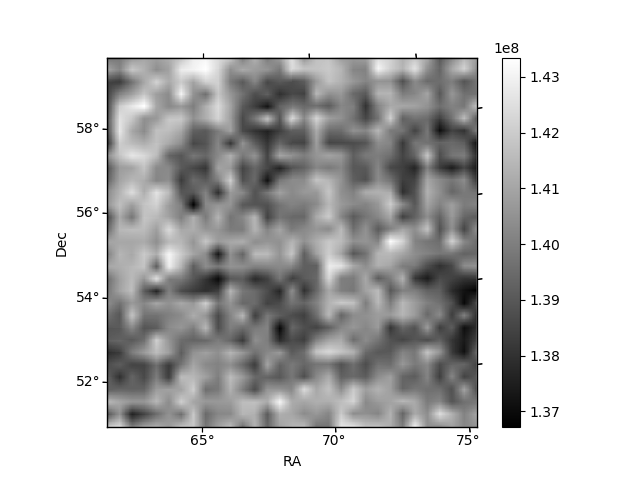
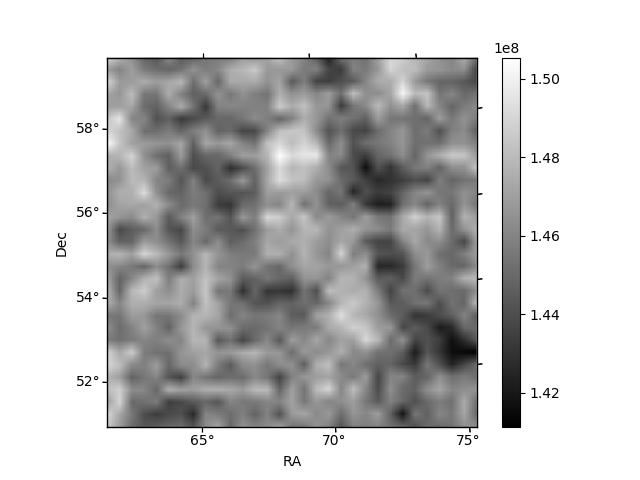
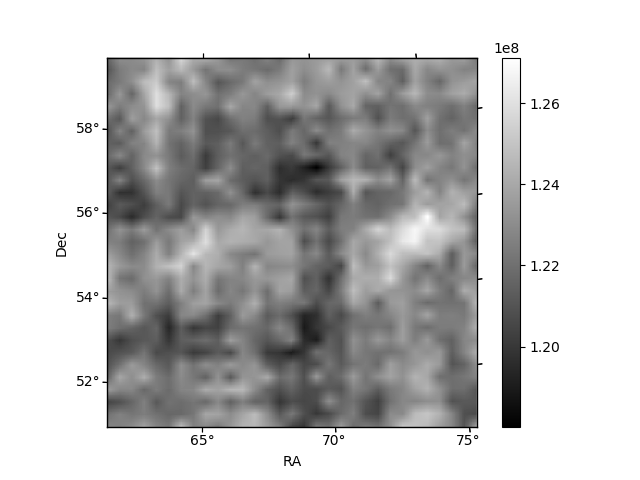
Histogram calculated using DETX and DETY for each event in the final _common_clean file
| Quadrant A | 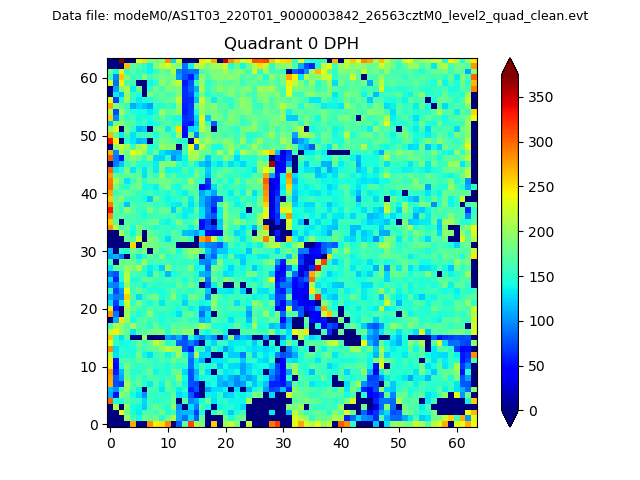 |
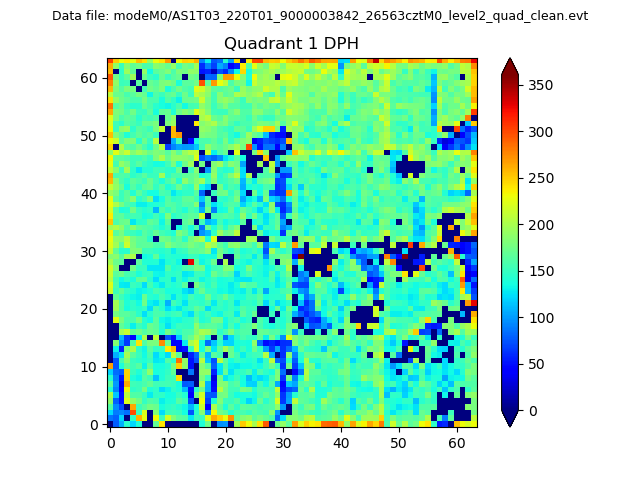 |
Quadrant B |
|---|---|---|---|
| Quadrant D | 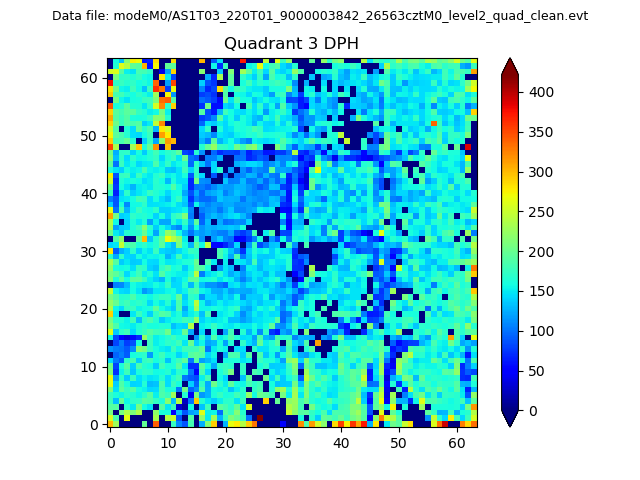 |
 |
Quadrant C |
| Plot type | Count rate plots | Images |
|---|---|---|
| Comparison with Poisson distribution Blue bars denote a histogram of data divided into 1 sec bins. Red curve is a Poisson curve with rate = median count rate of data. |
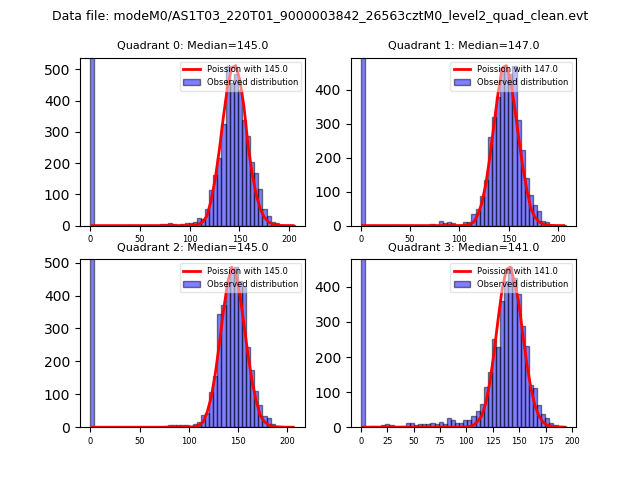 |
 |
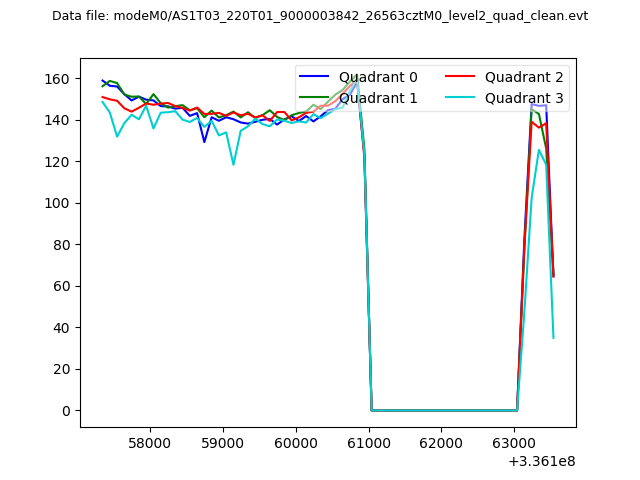
| Quadrant-wise count rates Data is divided into 100 sec bins |
 |
|
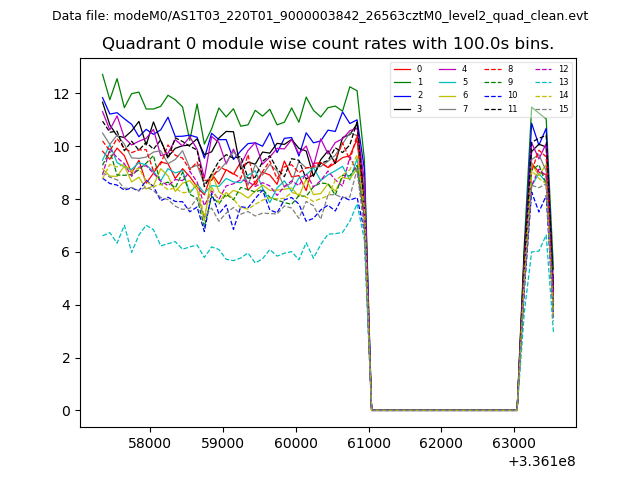
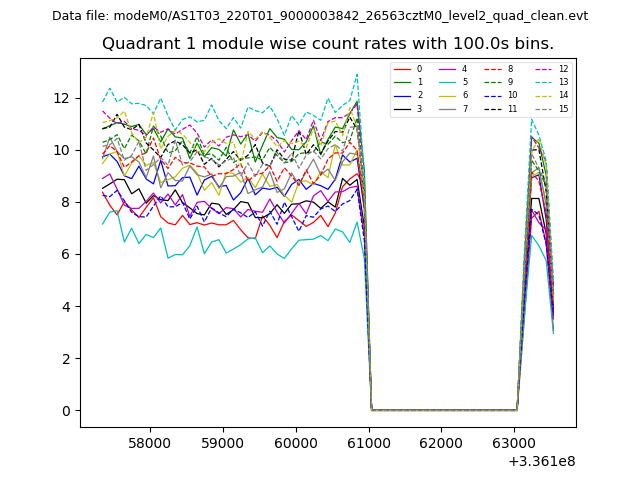
| Module-wise count rates for Quadrant A Data is divided into 100 sec bins |
 |
 |
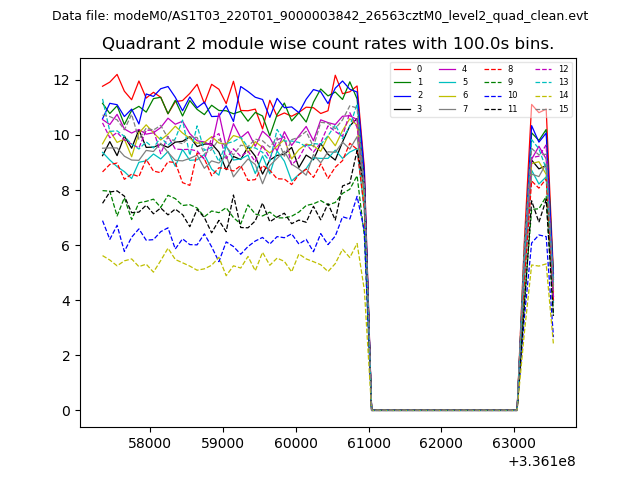
| Module-wise count rates for Quadrant B Data is divided into 100 sec bins |
 |
 |
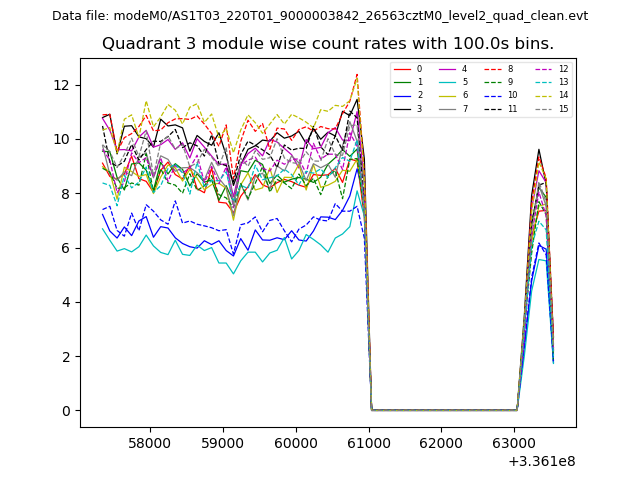
| Module-wise count rates for Quadrant C Data is divided into 100 sec bins |
 |
 |
| Module-wise count rates for Quadrant D Data is divided into 100 sec bins |
 |
 |
| Parameter | Plot |
|---|---|
| CZT HV Monitor | 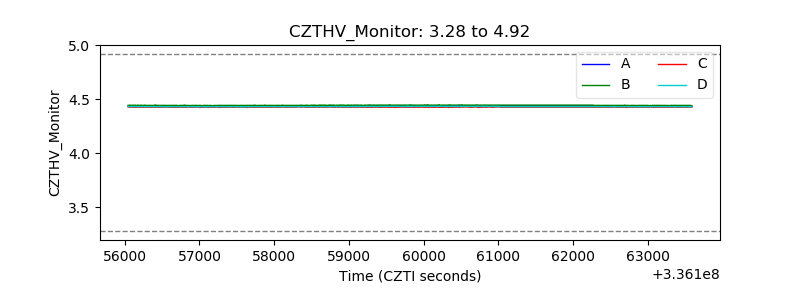 |
| D_VDD | 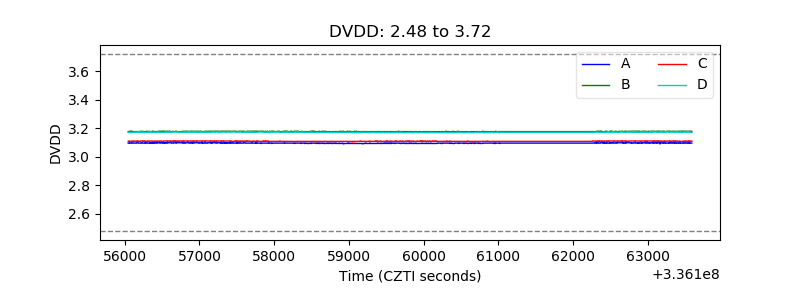 |
| Temperature 1 | 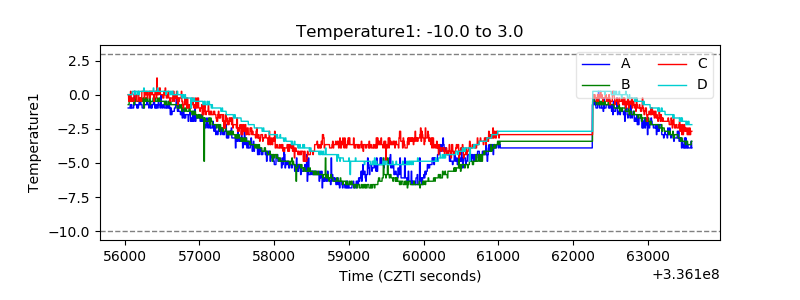 |
| Veto HV Monitor | 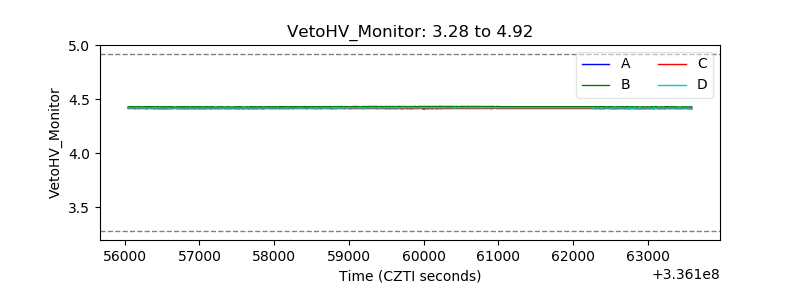 |
| Veto LLD | 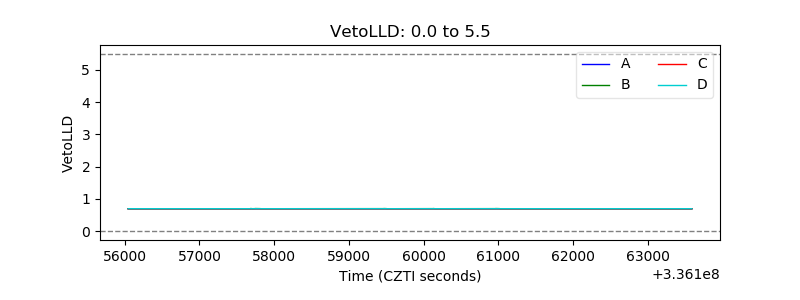 |
| Alpha Counter | 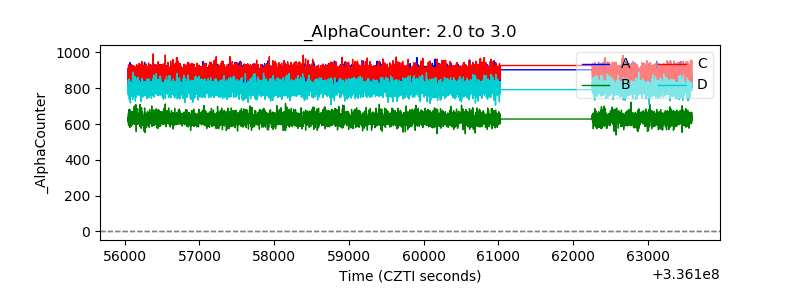 |
| _CPM_Rate | 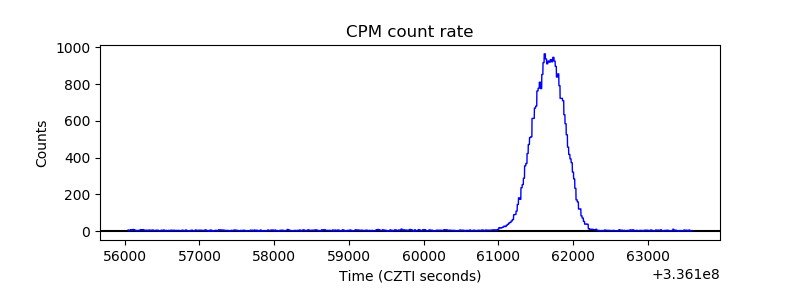 |
| CZT Counter | 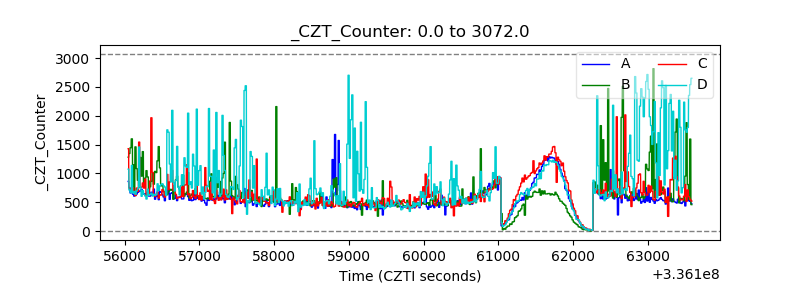 |
| +2.5 Volts monitor | 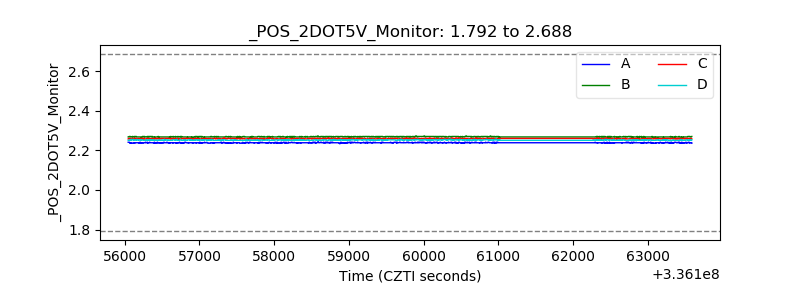 |
| +5 Volts monitor | 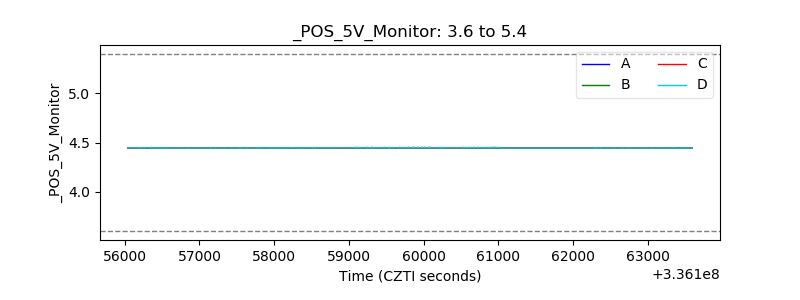 |
| _ROLL_ROT | 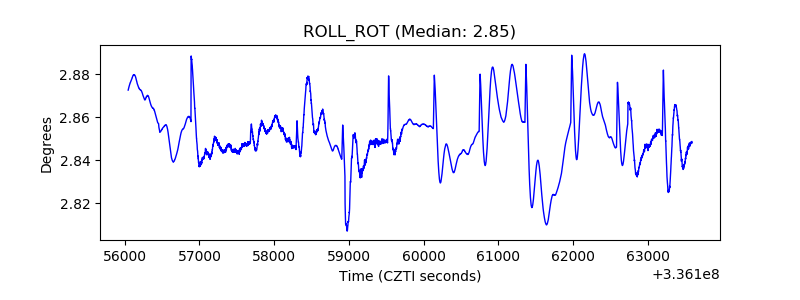 |
| _Roll_DEC |  |
| _Roll_RA | 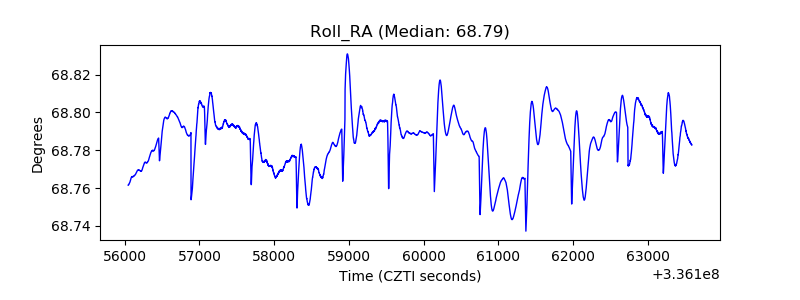 |
| Veto Counter | 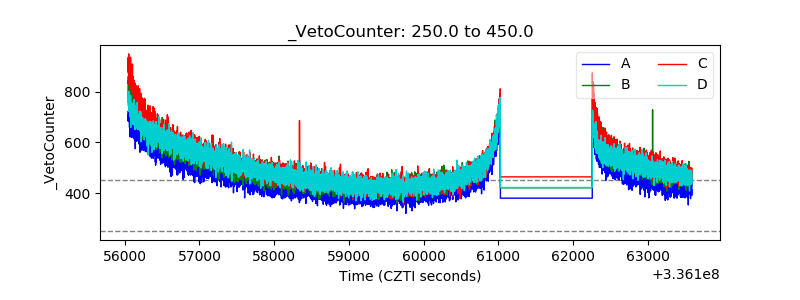 |