| Param | Original file | Final file |
|---|---|---|
| Filename | modeM0/AS1T03_220T01_9000003842_26564cztM0_level2.evt | modeM0/AS1T03_220T01_9000003842_26564cztM0_level2_quad_clean.evt |
| Size (bytes) | 790,225,920 | 99,745,920 |
| Size | 753.6 MB | 95.1 MB |
| Events in quadrant A | 3,323,538 | 696,721 |
| Events in quadrant B | 4,225,849 | 699,833 |
| Events in quadrant C | 4,069,978 | 685,548 |
| Events in quadrant D | 11,867,874 | 478,684 |
| Mode M0 | |||
|---|---|---|---|
| Quadrant | BADHDUFLAG | Total packets | Discarded packets |
| A | 0 | 13896 | 0 |
| B | 0 | 16899 | 0 |
| C | 0 | 16431 | 0 |
| D | 0 | 39835 | 0 |
| Mode M9 | |||
|---|---|---|---|
| Quadrant | BADHDUFLAG | Total packets | Discarded packets |
| A | 0 | 8 | 0 |
| B | 0 | 8 | 0 |
| C | 0 | 8 | 0 |
| D | 0 | 8 | 0 |
| Quadrant | Total seconds | Saturated seconds | Saturation percentage |
|---|---|---|---|
| A | 6575 | 79 | 1.201521% |
| B | 6576 | 303 | 4.607664% |
| C | 6576 | 270 | 4.105839% |
| D | 6575 | 3663 | 55.711027% |
Noise dominated data is calculated using 1-second bins in cleaned event files. If a bin has >2000 counts, and if more than 50% of those come from <1% of pixels, then it is considered to be noise-dominated and hence unusable.
| Quadrant | # 1 sec bins | Bins with >0 counts | Bins with >2000 counts | High rate bins dominated by noise | Noise dominated (total time) | Noise dominated (detector-on time) | Marked lightcurve |
|---|---|---|---|---|---|---|---|
| A | 7445 | 6575 | 2 | 2 | 0.03% | 0.03% |  |
| B | 7446 | 6576 | 160 | 160 | 2.15% | 2.43% |  |
| C | 7446 | 6576 | 78 | 78 | 1.05% | 1.19% |  |
| D | 7445 | 6575 | 3398 | 3398 | 45.64% | 51.68% |  |
Top three noisy pixels from each quadrant. If the there are fewer than three noisy pixels in the level2.evt file, extra rows are filled as -1
| Pixel properties | Quadrant properties | ||||||
|---|---|---|---|---|---|---|---|
| Quadrant | DetID | PixID | Counts | Sigma | Mean | Median | Sigma |
| A | 5 | 168 | 86320 | 521.32 | 824 | 807 | 164.0 |
| A | 9 | 130 | 25226 | 148.87 | 824 | 807 | 164.0 |
| A | 0 | 13 | 23836 | 140.39 | 824 | 807 | 164.0 |
| B | 5 | 172 | 668553 | 4394.2 | 813 | 792 | 152.0 |
| B | 3 | 112 | 149426 | 978.09 | 813 | 792 | 152.0 |
| B | 3 | 64 | 131252 | 858.49 | 813 | 792 | 152.0 |
| C | 3 | 233 | 553772 | 3019.99 | 791 | 800 | 183.1 |
| C | 4 | 254 | 296152 | 1613.03 | 791 | 800 | 183.1 |
| C | 14 | 238 | 124945 | 678.0 | 791 | 800 | 183.1 |
| D | 7 | 80 | 7113934 | 43139.08 | 618 | 604 | 164.9 |
| D | 12 | 233 | 1606459 | 9738.77 | 618 | 604 | 164.9 |
| D | 1 | 52 | 398532 | 2413.25 | 618 | 604 | 164.9 |
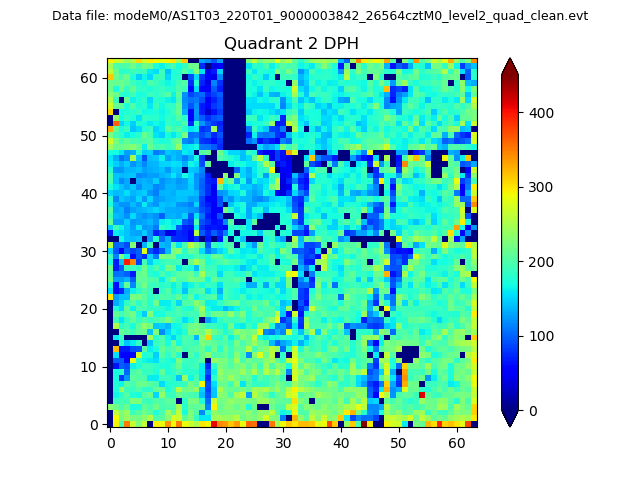
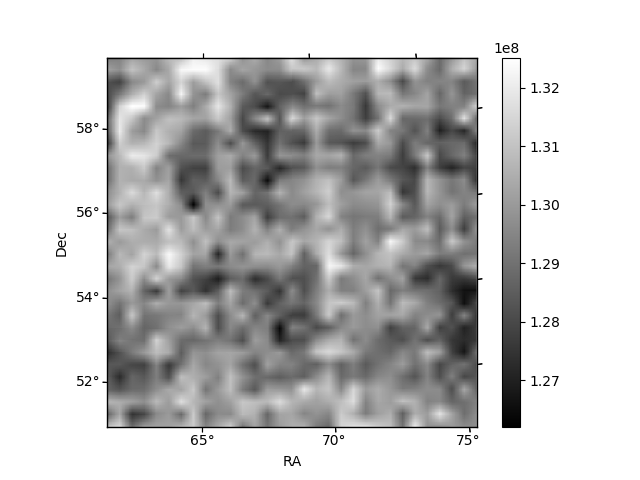
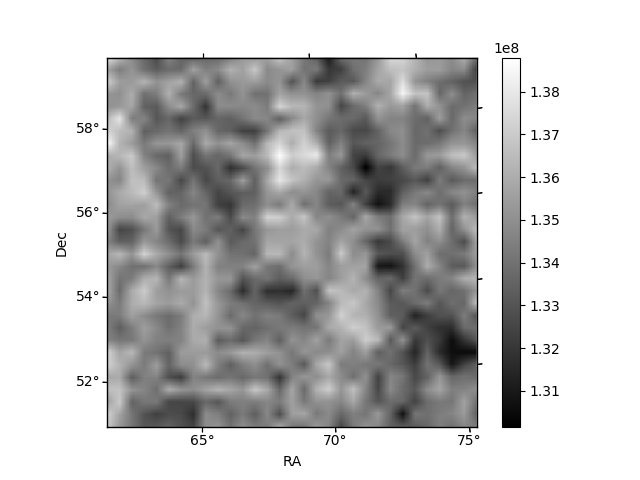
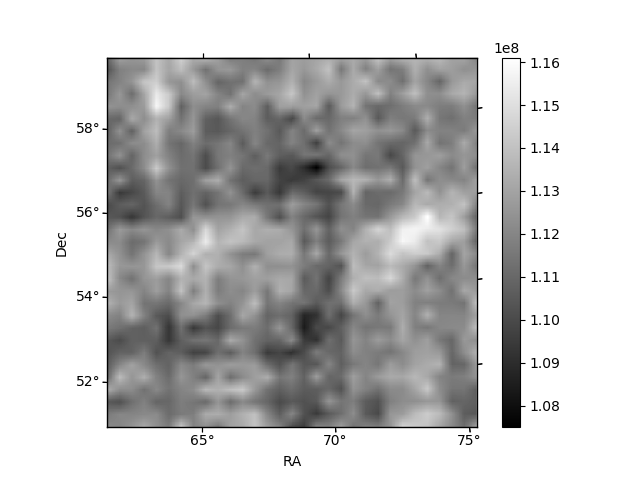
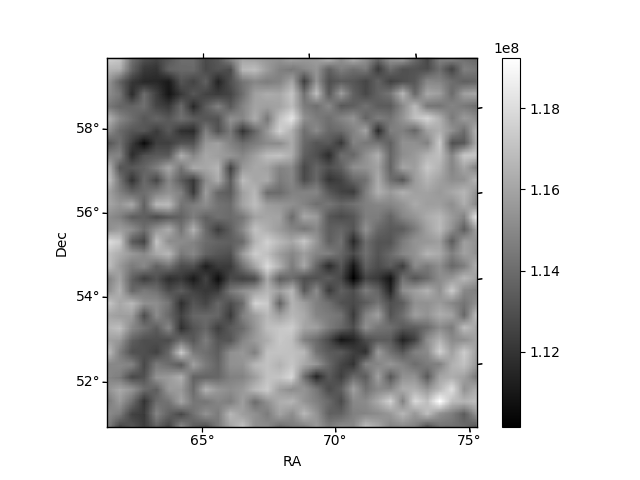
Histogram calculated using DETX and DETY for each event in the final _common_clean file
| Quadrant A | 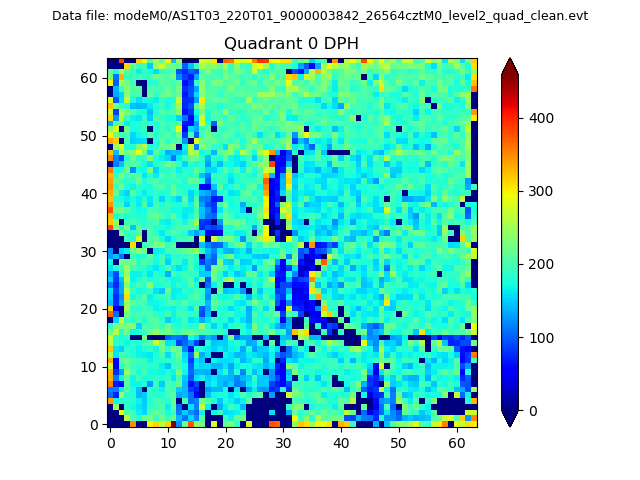 |
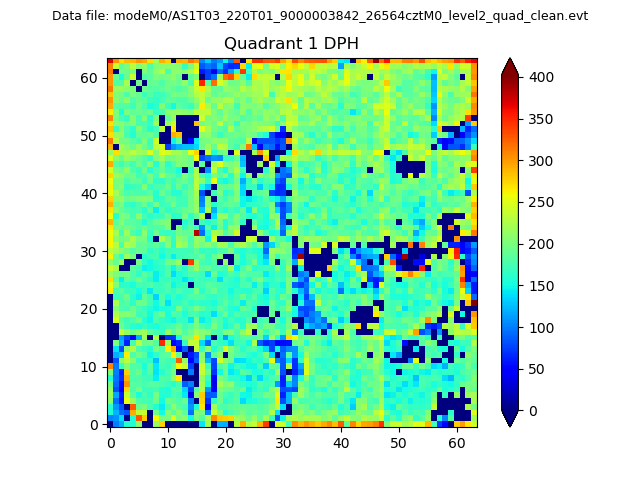 |
Quadrant B |
|---|---|---|---|
| Quadrant D | 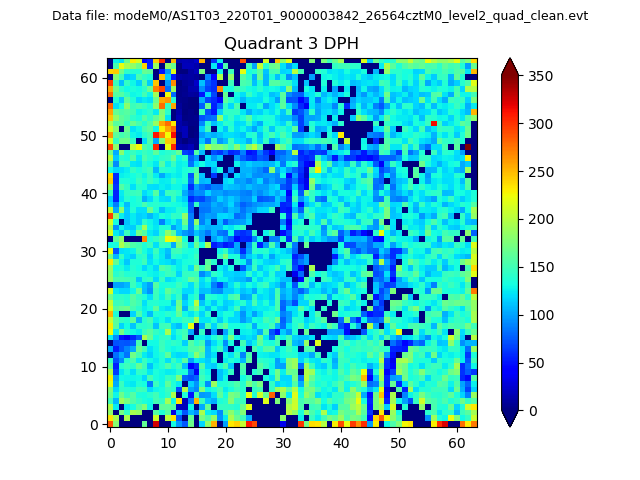 |
 |
Quadrant C |
| Plot type | Count rate plots | Images |
|---|---|---|
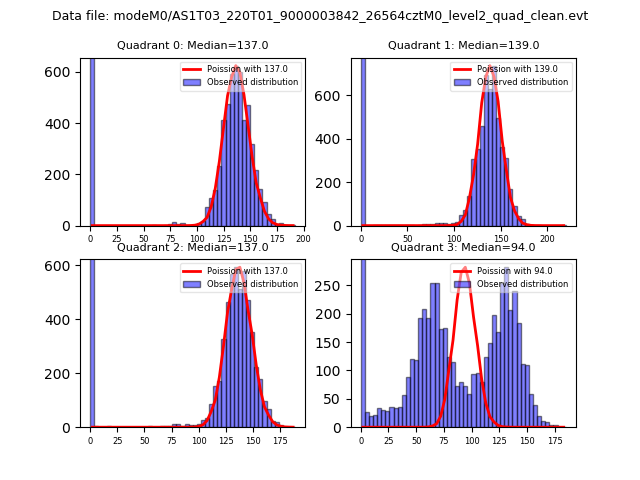
| Comparison with Poisson distribution Blue bars denote a histogram of data divided into 1 sec bins. Red curve is a Poisson curve with rate = median count rate of data. |
 |
 |
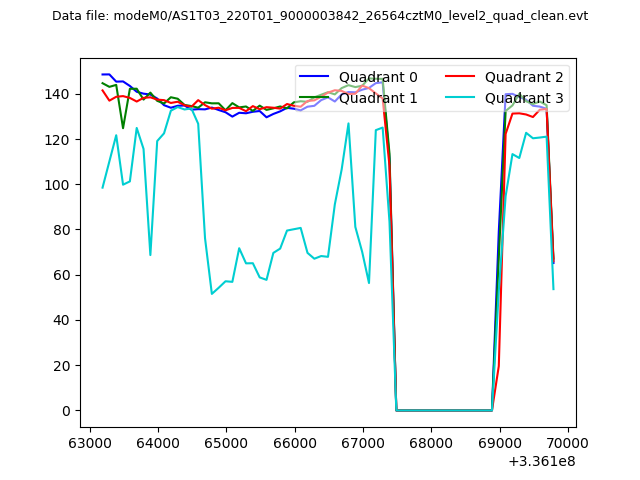
| Quadrant-wise count rates Data is divided into 100 sec bins |
 |
|
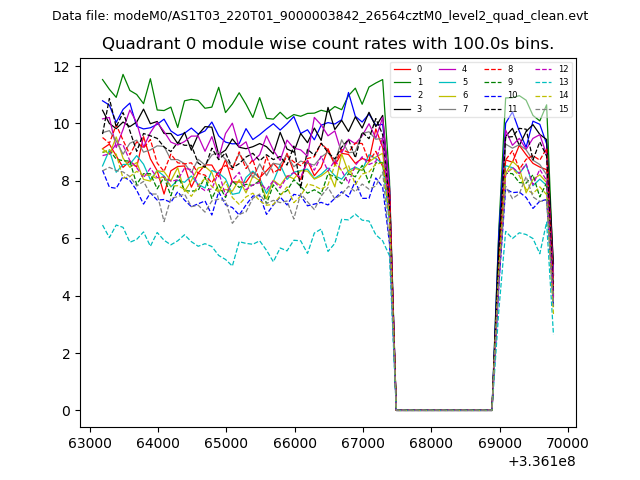
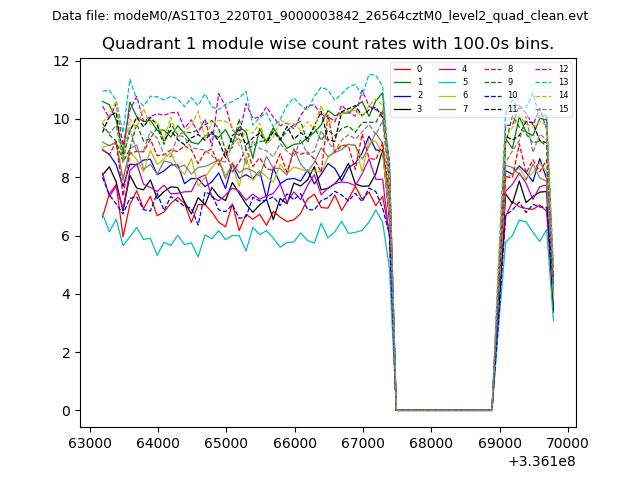
| Module-wise count rates for Quadrant A Data is divided into 100 sec bins |
 |
 |
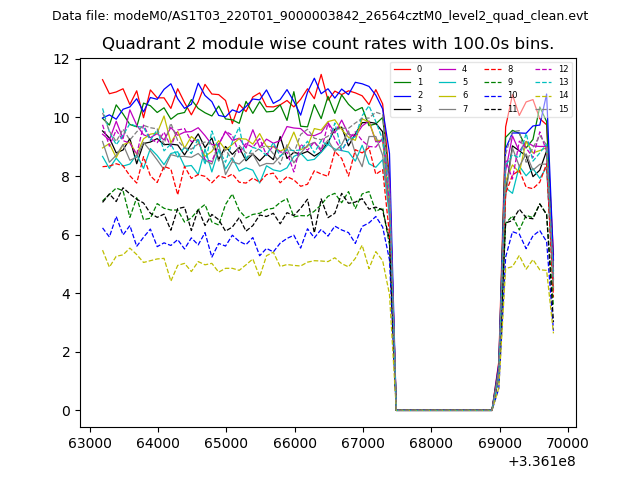
| Module-wise count rates for Quadrant B Data is divided into 100 sec bins |
 |
 |
| Module-wise count rates for Quadrant C Data is divided into 100 sec bins |
 |
 |
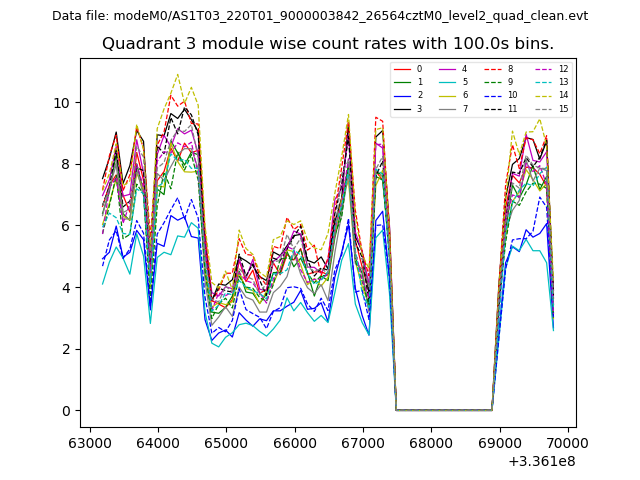
| Module-wise count rates for Quadrant D Data is divided into 100 sec bins |
 |
 |
| Parameter | Plot |
|---|---|
| CZT HV Monitor | 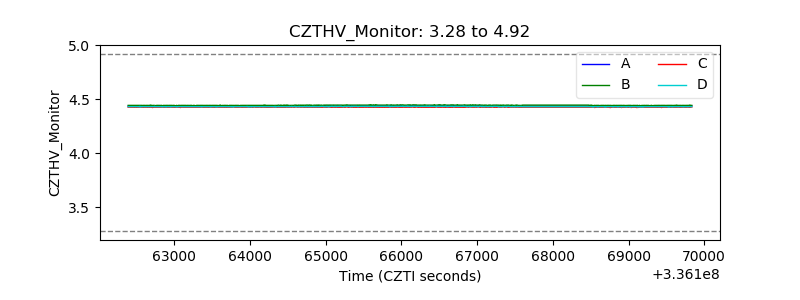 |
| D_VDD | 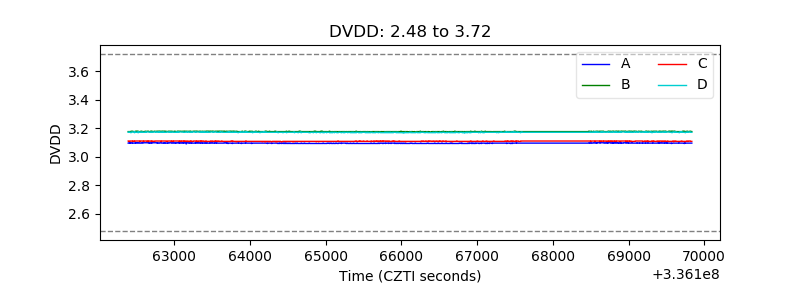 |
| Temperature 1 | 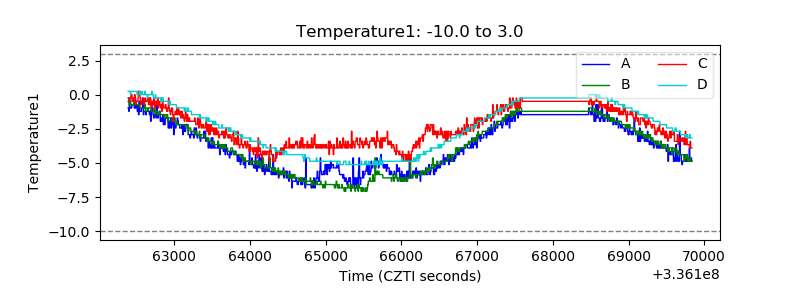 |
| Veto HV Monitor | 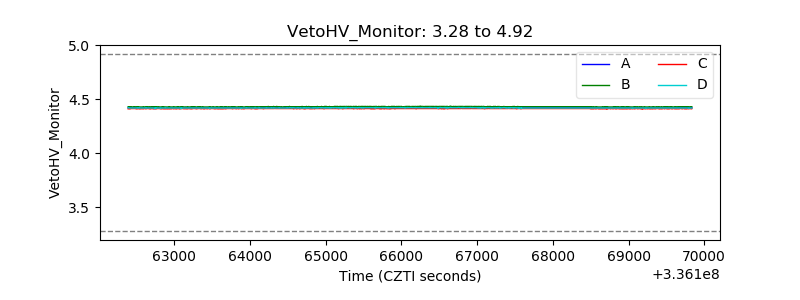 |
| Veto LLD | 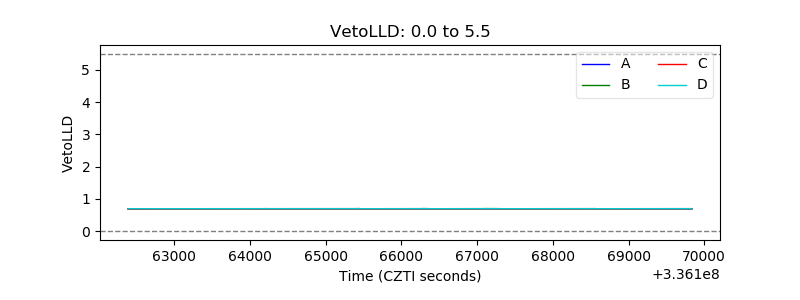 |
| Alpha Counter | 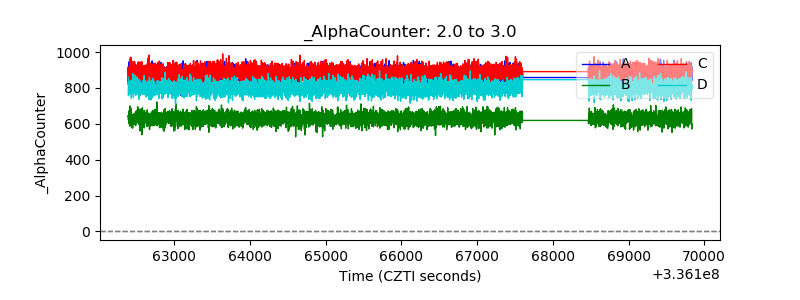 |
| _CPM_Rate | 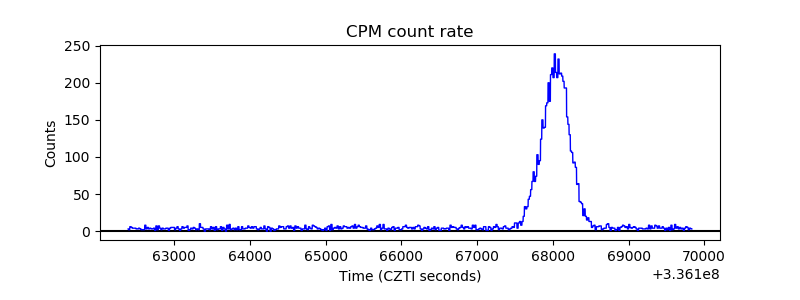 |
| CZT Counter | 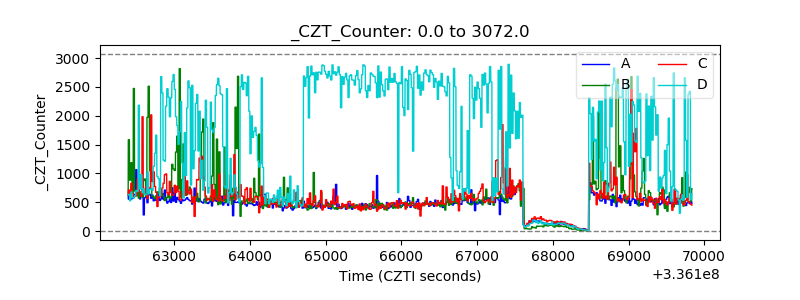 |
| +2.5 Volts monitor |  |
| +5 Volts monitor |  |
| _ROLL_ROT | 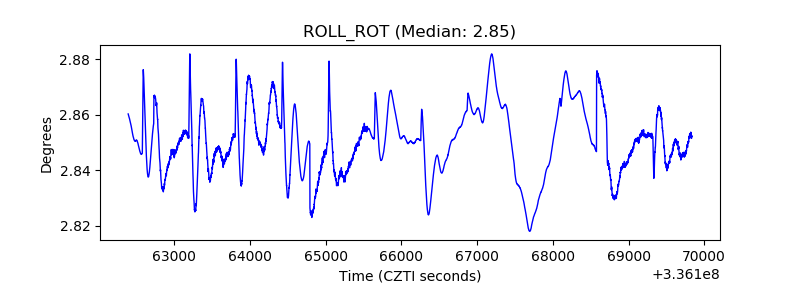 |
| _Roll_DEC | 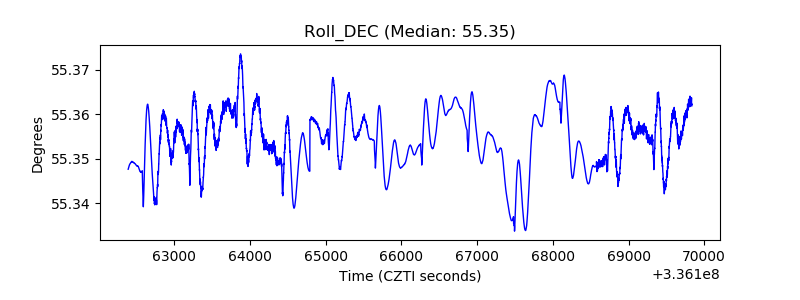 |
| _Roll_RA | 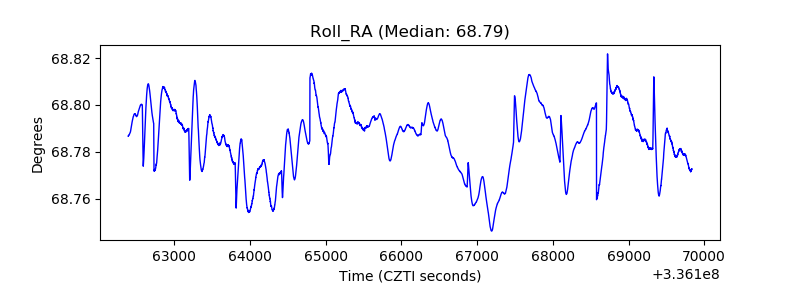 |
| Veto Counter | 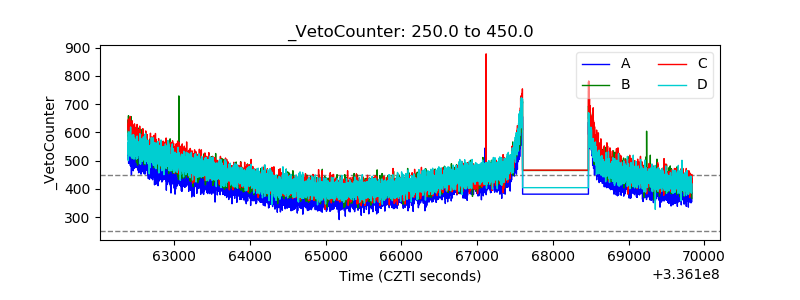 |