| Param | Original file | Final file |
|---|---|---|
| Filename | modeM0/AS1T03_220T01_9000003842_26565cztM0_level2.evt | modeM0/AS1T03_220T01_9000003842_26565cztM0_level2_quad_clean.evt |
| Size (bytes) | 784,719,360 | 107,334,720 |
| Size | 748.4 MB | 102.4 MB |
| Events in quadrant A | 3,674,863 | 722,053 |
| Events in quadrant B | 4,585,666 | 722,437 |
| Events in quadrant C | 5,106,221 | 707,982 |
| Events in quadrant D | 9,903,877 | 587,982 |
| Mode M0 | |||
|---|---|---|---|
| Quadrant | BADHDUFLAG | Total packets | Discarded packets |
| A | 0 | 15571 | 0 |
| B | 0 | 18525 | 0 |
| C | 0 | 20055 | 0 |
| D | 0 | 34576 | 0 |
| Mode M9 | |||
|---|---|---|---|
| Quadrant | BADHDUFLAG | Total packets | Discarded packets |
| A | 0 | 13 | 0 |
| B | 0 | 13 | 0 |
| C | 0 | 13 | 0 |
| D | 0 | 13 | 0 |
| Quadrant | Total seconds | Saturated seconds | Saturation percentage |
|---|---|---|---|
| A | 7318 | 94 | 1.284504% |
| B | 7319 | 434 | 5.929772% |
| C | 7319 | 727 | 9.933051% |
| D | 7318 | 2419 | 33.055480% |
Noise dominated data is calculated using 1-second bins in cleaned event files. If a bin has >2000 counts, and if more than 50% of those come from <1% of pixels, then it is considered to be noise-dominated and hence unusable.
| Quadrant | # 1 sec bins | Bins with >0 counts | Bins with >2000 counts | High rate bins dominated by noise | Noise dominated (total time) | Noise dominated (detector-on time) | Marked lightcurve |
|---|---|---|---|---|---|---|---|
| A | 8663 | 7319 | 1 | 1 | 0.01% | 0.01% | 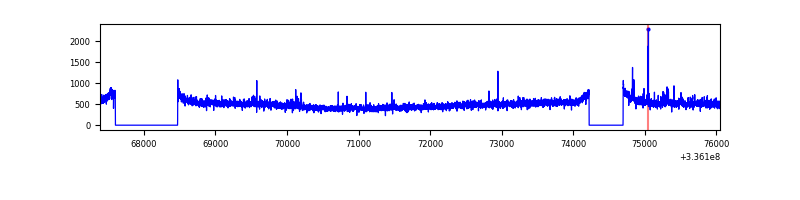 |
| B | 8664 | 7319 | 222 | 222 | 2.56% | 3.03% | 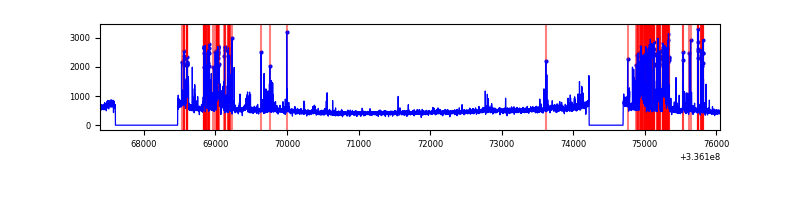 |
| C | 8664 | 7319 | 320 | 320 | 3.69% | 4.37% | 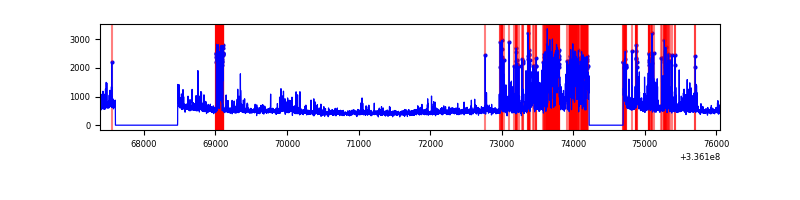 |
| D | 8663 | 7318 | 2051 | 2051 | 23.68% | 28.03% | 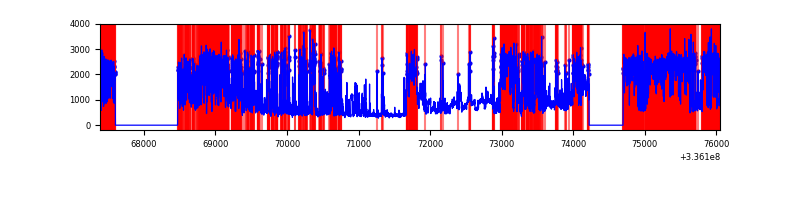 |
Top three noisy pixels from each quadrant. If the there are fewer than three noisy pixels in the level2.evt file, extra rows are filled as -1
| Pixel properties | Quadrant properties | ||||||
|---|---|---|---|---|---|---|---|
| Quadrant | DetID | PixID | Counts | Sigma | Mean | Median | Sigma |
| A | 5 | 168 | 94147 | 510.48 | 907 | 888 | 182.7 |
| A | 0 | 13 | 66540 | 359.37 | 907 | 888 | 182.7 |
| A | 6 | 16 | 16954 | 87.94 | 907 | 888 | 182.7 |
| B | 5 | 172 | 840483 | 5019.45 | 891 | 871 | 167.3 |
| B | 3 | 64 | 122529 | 727.31 | 891 | 871 | 167.3 |
| B | 3 | 112 | 85808 | 507.78 | 891 | 871 | 167.3 |
| C | 4 | 254 | 1460098 | 7429.67 | 845 | 851 | 196.4 |
| C | 3 | 233 | 183013 | 927.47 | 845 | 851 | 196.4 |
| C | 14 | 238 | 132552 | 670.55 | 845 | 851 | 196.4 |
| D | 7 | 80 | 4087260 | 22887.85 | 738 | 717 | 178.5 |
| D | 1 | 52 | 1415474 | 7923.75 | 738 | 717 | 178.5 |
| D | 12 | 233 | 1273107 | 7126.38 | 738 | 717 | 178.5 |
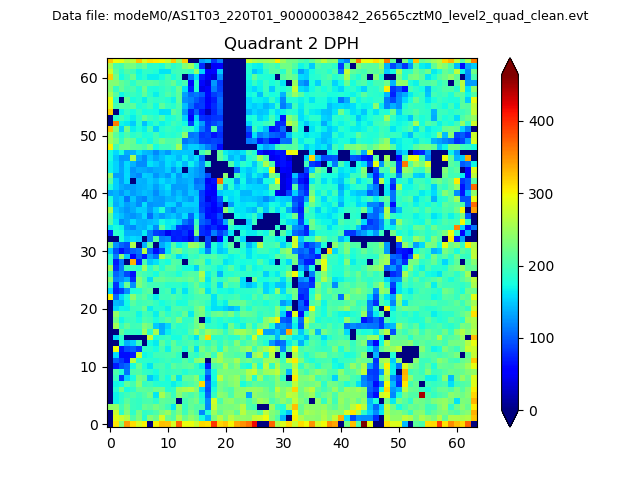
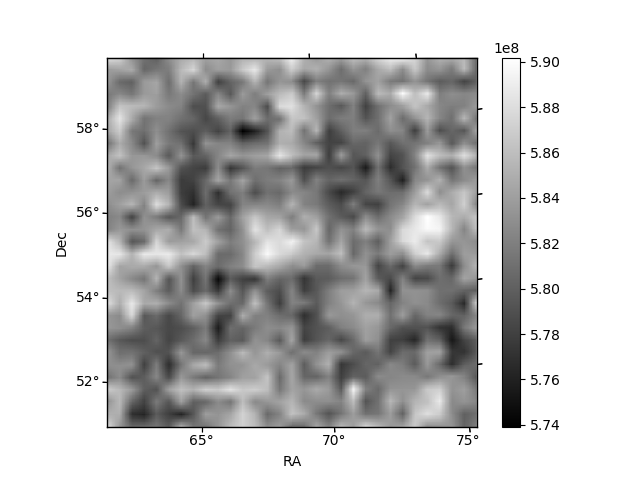
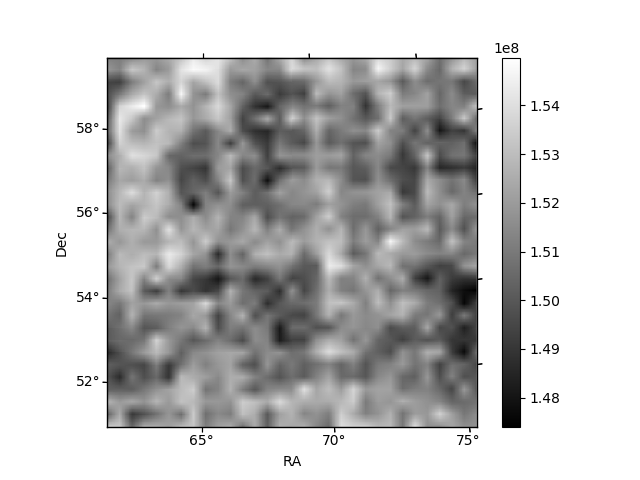
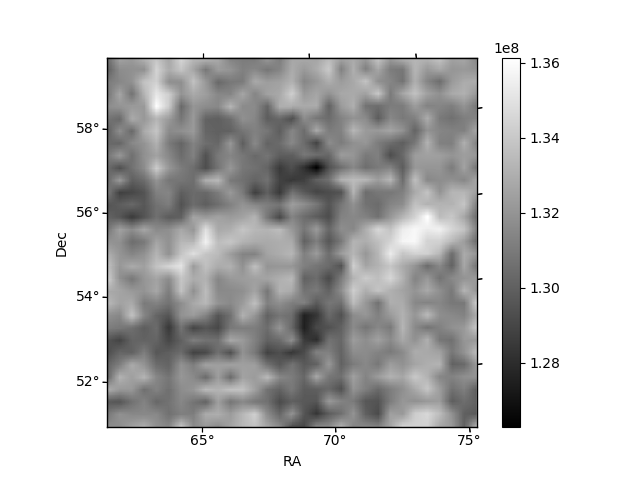
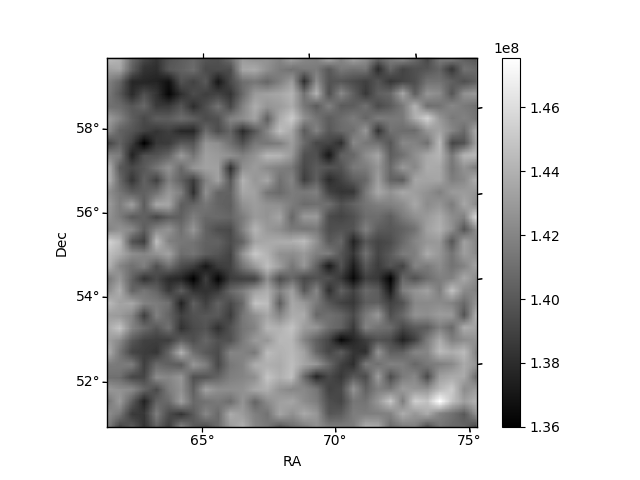
Histogram calculated using DETX and DETY for each event in the final _common_clean file
| Quadrant A | 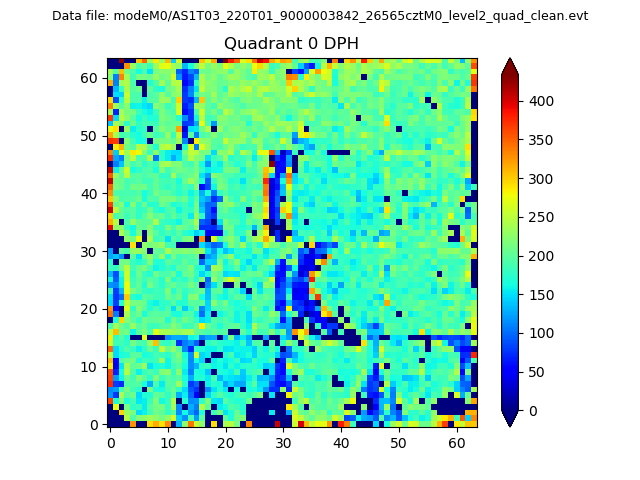 |
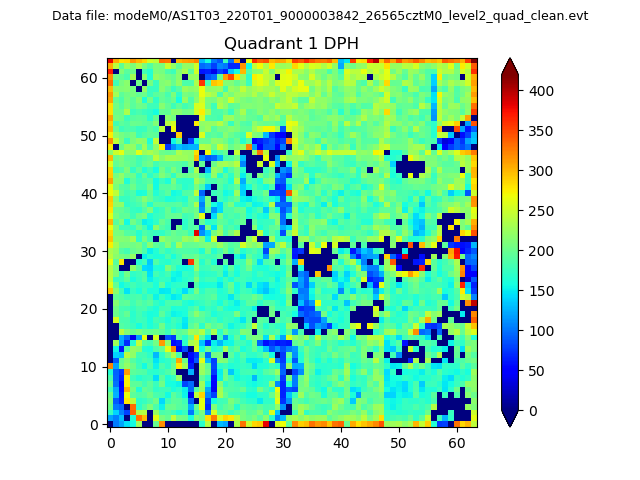 |
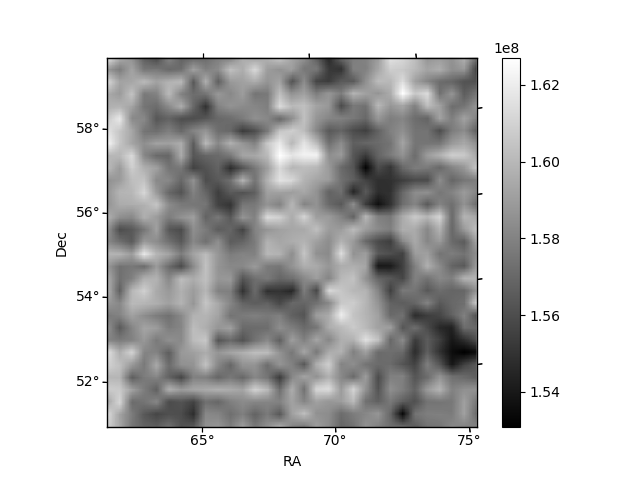
Quadrant B |
|---|---|---|---|
| Quadrant D | 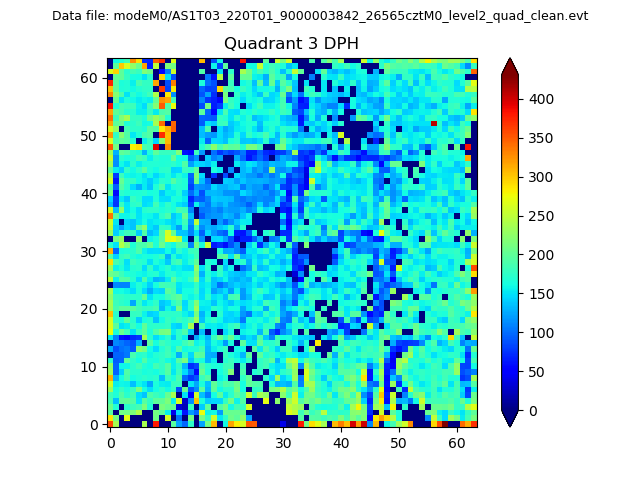 |
 |
Quadrant C |
| Plot type | Count rate plots | Images |
|---|---|---|
| Comparison with Poisson distribution Blue bars denote a histogram of data divided into 1 sec bins. Red curve is a Poisson curve with rate = median count rate of data. |
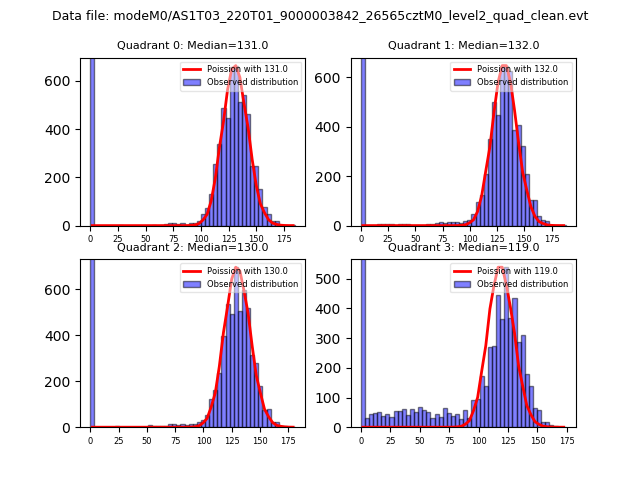 |
 |
| Quadrant-wise count rates Data is divided into 100 sec bins |
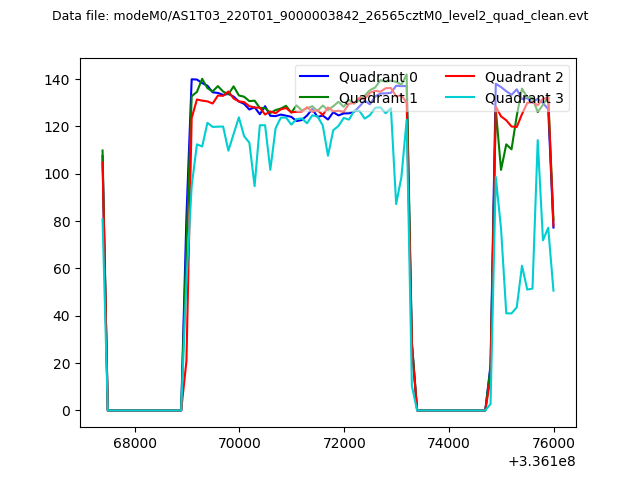 |
|
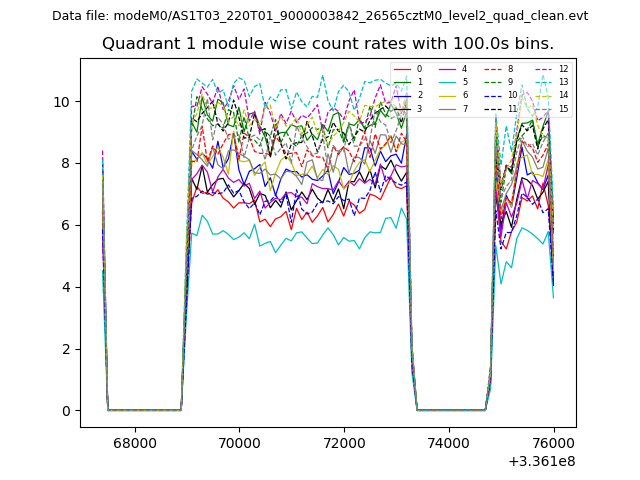
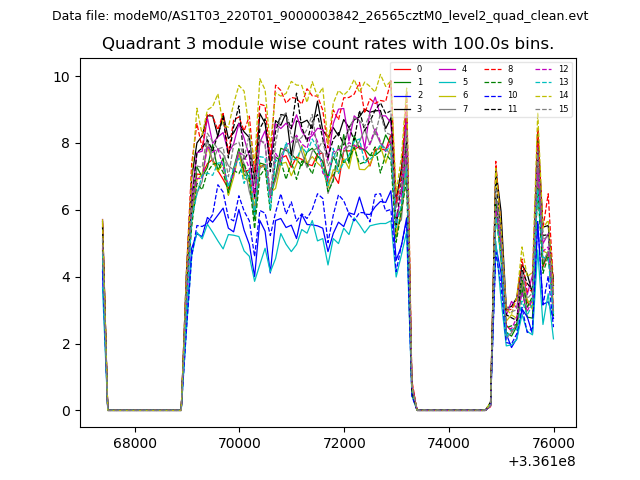
| Module-wise count rates for Quadrant A Data is divided into 100 sec bins |
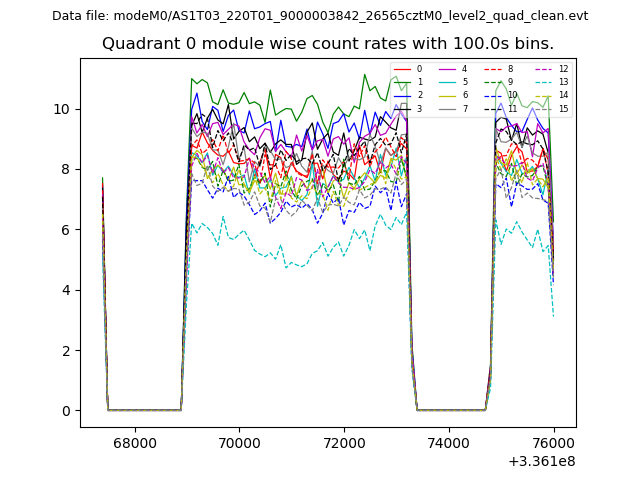 |
 |
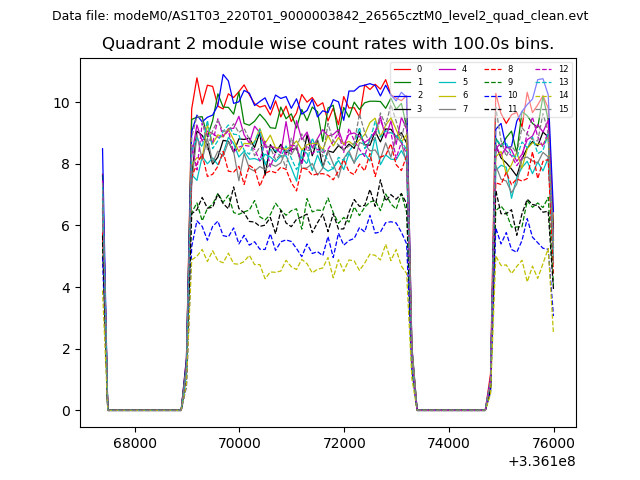
| Module-wise count rates for Quadrant B Data is divided into 100 sec bins |
 |
 |
| Module-wise count rates for Quadrant C Data is divided into 100 sec bins |
 |
 |
| Module-wise count rates for Quadrant D Data is divided into 100 sec bins |
 |
 |
| Parameter | Plot |
|---|---|
| CZT HV Monitor | 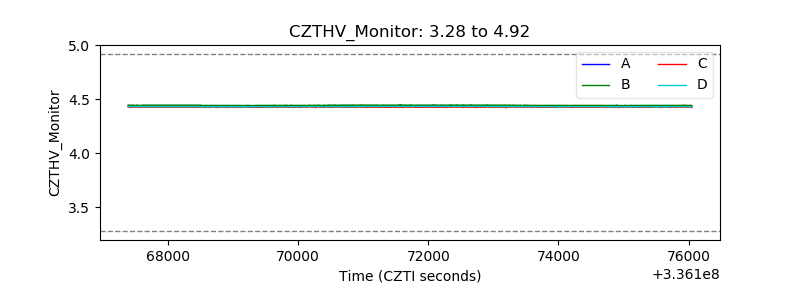 |
| D_VDD | 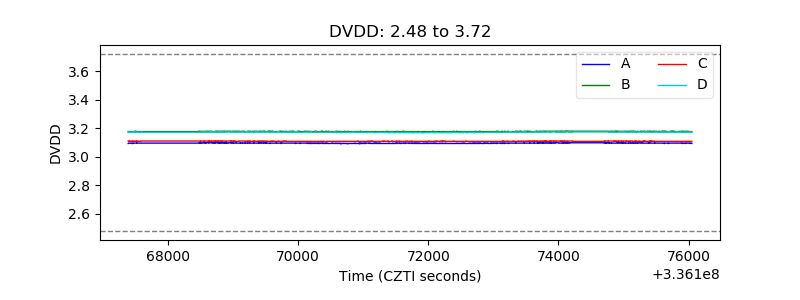 |
| Temperature 1 | 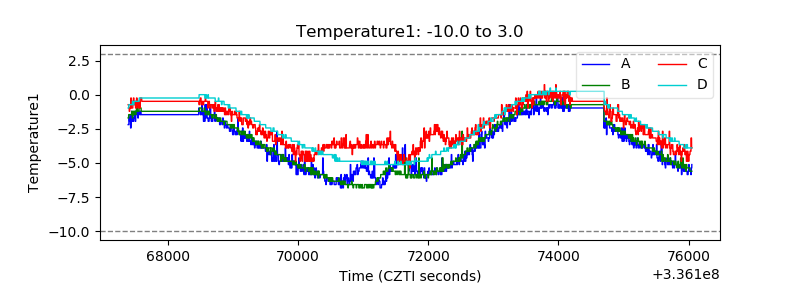 |
| Veto HV Monitor | 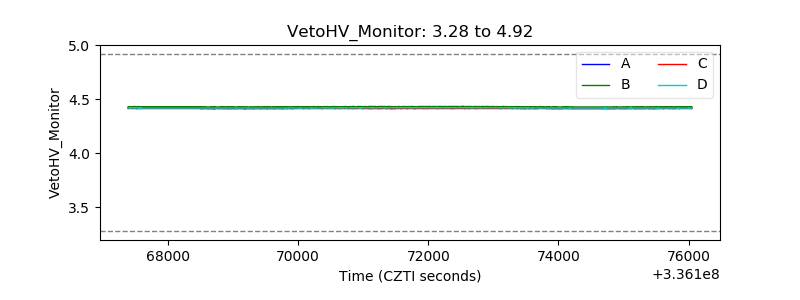 |
| Veto LLD | 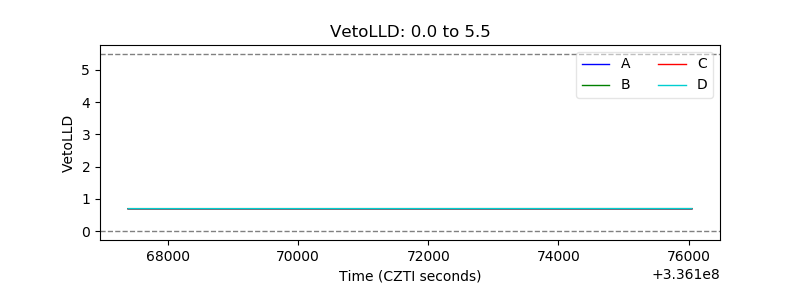 |
| Alpha Counter | 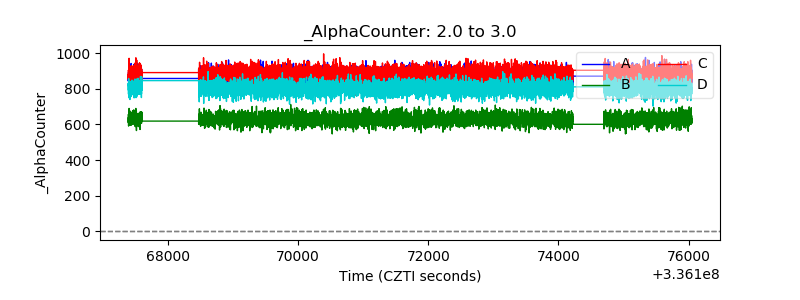 |
| _CPM_Rate | 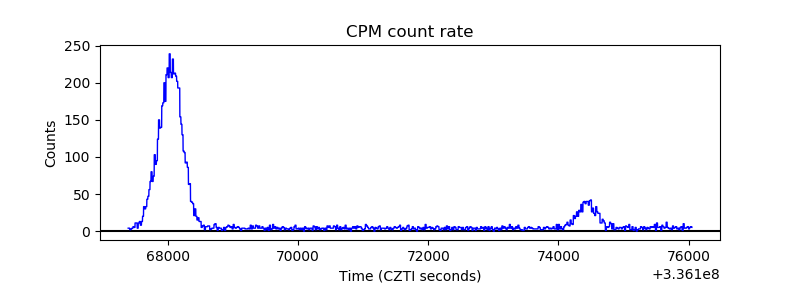 |
| CZT Counter | 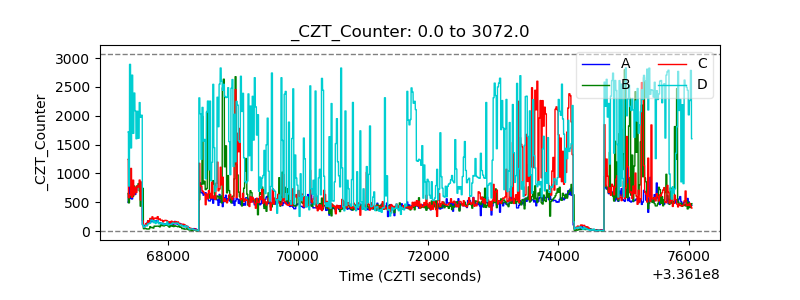 |
| +2.5 Volts monitor | 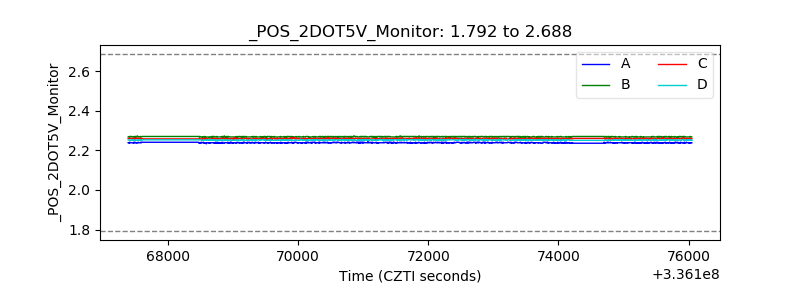 |
| +5 Volts monitor | 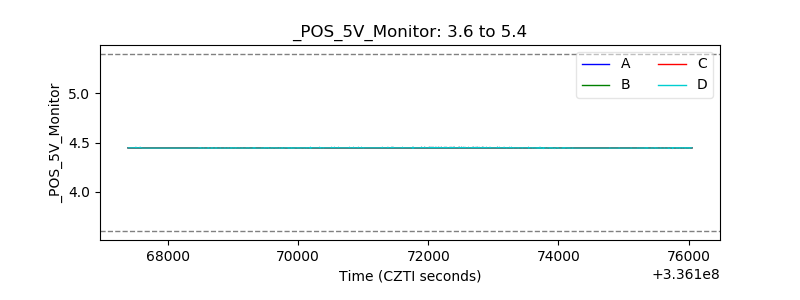 |
| _ROLL_ROT | 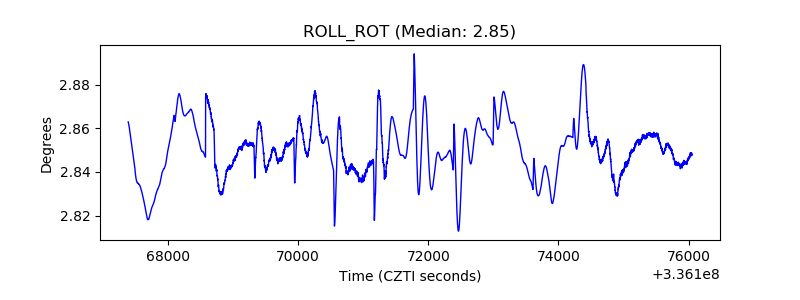 |
| _Roll_DEC | 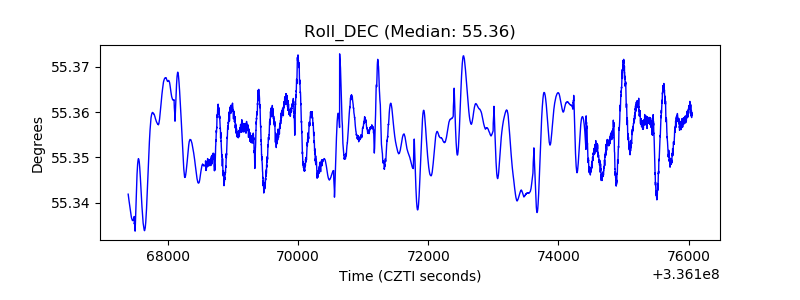 |
| _Roll_RA | 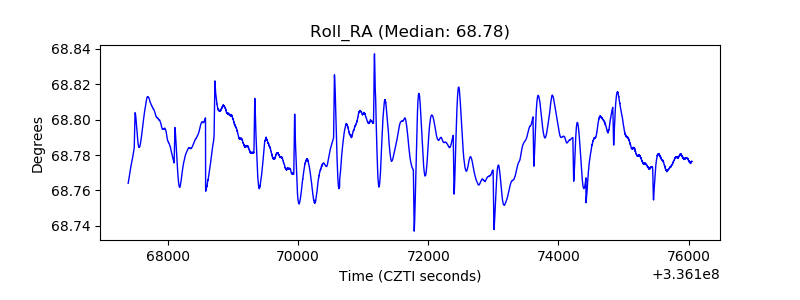 |
| Veto Counter | 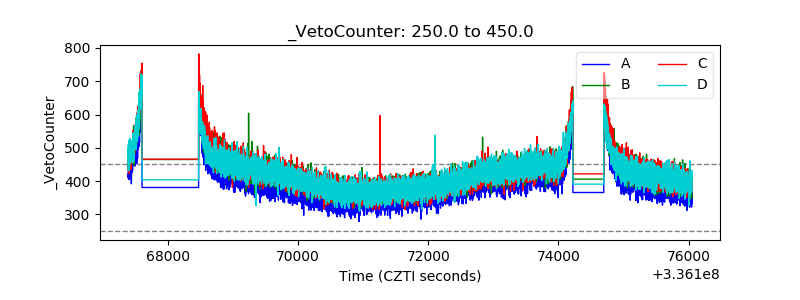 |