| Param | Original file | Final file |
|---|---|---|
| Filename | modeM0/AS1T03_220T01_9000003842_26566cztM0_level2.evt | modeM0/AS1T03_220T01_9000003842_26566cztM0_level2_quad_clean.evt |
| Size (bytes) | 237,130,560 | 29,056,320 |
| Size | 226.1 MB | 27.7 MB |
| Events in quadrant A | 961,495 | 212,626 |
| Events in quadrant B | 1,415,037 | 204,412 |
| Events in quadrant C | 1,241,136 | 205,781 |
| Events in quadrant D | 3,439,138 | 123,886 |
| Mode M0 | |||
|---|---|---|---|
| Quadrant | BADHDUFLAG | Total packets | Discarded packets |
| A | 0 | 3965 | 0 |
| B | 0 | 5408 | 0 |
| C | 0 | 4885 | 0 |
| D | 0 | 11460 | 0 |
| Mode M9 | |||
|---|---|---|---|
| Quadrant | BADHDUFLAG | Total packets | Discarded packets |
| A | 0 | 2 | 0 |
| B | 0 | 3 | 0 |
| C | 0 | 3 | 0 |
| D | 0 | 3 | 0 |
| Quadrant | Total seconds | Saturated seconds | Saturation percentage |
|---|---|---|---|
| A | 1807 | 6 | 0.332042% |
| B | 1807 | 204 | 11.289430% |
| C | 1807 | 135 | 7.470946% |
| D | 1807 | 1186 | 65.633647% |
Noise dominated data is calculated using 1-second bins in cleaned event files. If a bin has >2000 counts, and if more than 50% of those come from <1% of pixels, then it is considered to be noise-dominated and hence unusable.
| Quadrant | # 1 sec bins | Bins with >0 counts | Bins with >2000 counts | High rate bins dominated by noise | Noise dominated (total time) | Noise dominated (detector-on time) | Marked lightcurve |
|---|---|---|---|---|---|---|---|
| A | 1807 | 1807 | 1 | 1 | 0.06% | 0.06% |  |
| B | 1807 | 1807 | 144 | 144 | 7.97% | 7.97% |  |
| C | 1807 | 1807 | 51 | 51 | 2.82% | 2.82% |  |
| D | 1807 | 1807 | 1066 | 1066 | 58.99% | 58.99% | 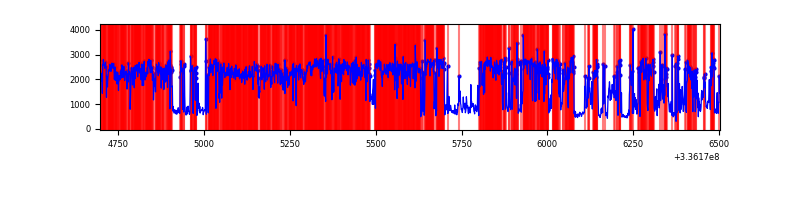 |
Top three noisy pixels from each quadrant. If the there are fewer than three noisy pixels in the level2.evt file, extra rows are filled as -1
| Pixel properties | Quadrant properties | ||||||
|---|---|---|---|---|---|---|---|
| Quadrant | DetID | PixID | Counts | Sigma | Mean | Median | Sigma |
| A | 0 | 13 | 46200 | 976.8 | 222 | 217 | 47.1 |
| A | 5 | 168 | 34546 | 729.23 | 222 | 217 | 47.1 |
| A | 6 | 16 | 20470 | 430.22 | 222 | 217 | 47.1 |
| B | 5 | 172 | 541813 | 12530.77 | 216 | 210 | 43.2 |
| B | 3 | 112 | 18892 | 432.24 | 216 | 210 | 43.2 |
| B | 12 | 111 | 4818 | 106.61 | 216 | 210 | 43.2 |
| C | 4 | 254 | 327888 | 6274.61 | 216 | 217 | 52.2 |
| C | 14 | 238 | 33536 | 638.03 | 216 | 217 | 52.2 |
| C | 3 | 233 | 27849 | 529.13 | 216 | 217 | 52.2 |
| D | 7 | 80 | 1753318 | 49759.31 | 134 | 130 | 35.2 |
| D | 1 | 52 | 1017370 | 28871.5 | 134 | 130 | 35.2 |
| D | 12 | 233 | 88842 | 2517.84 | 134 | 130 | 35.2 |
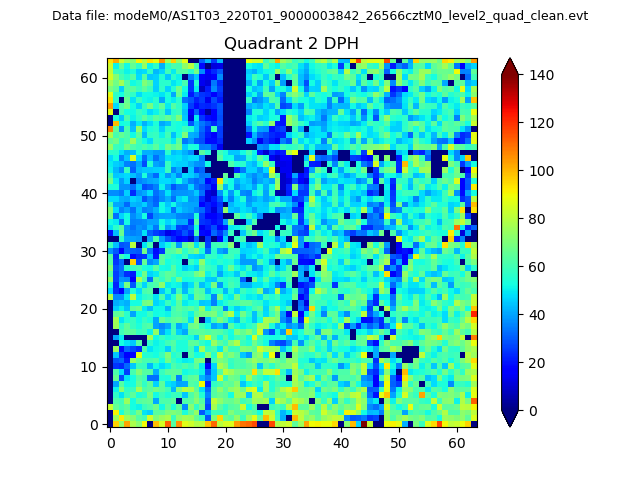
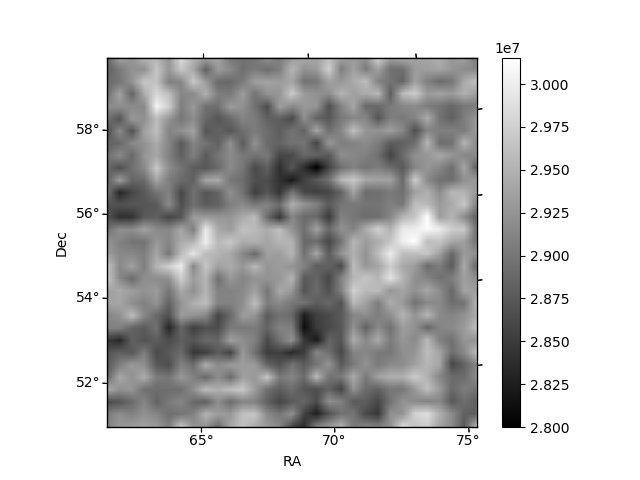
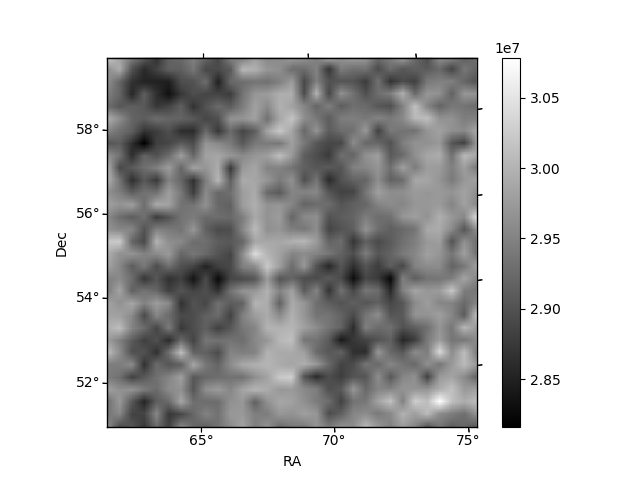
Histogram calculated using DETX and DETY for each event in the final _common_clean file
| Quadrant A | 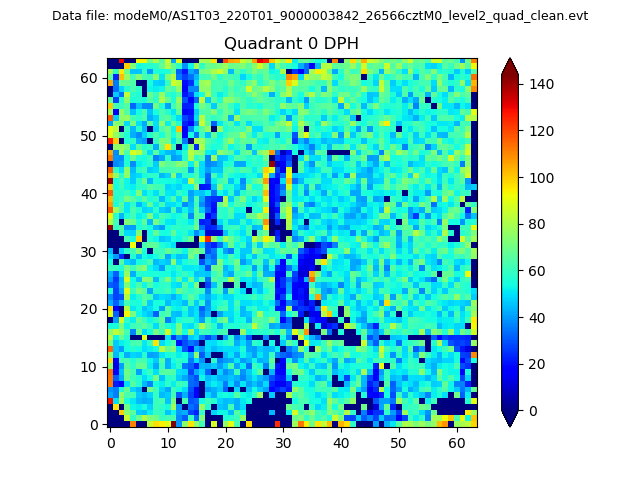 |
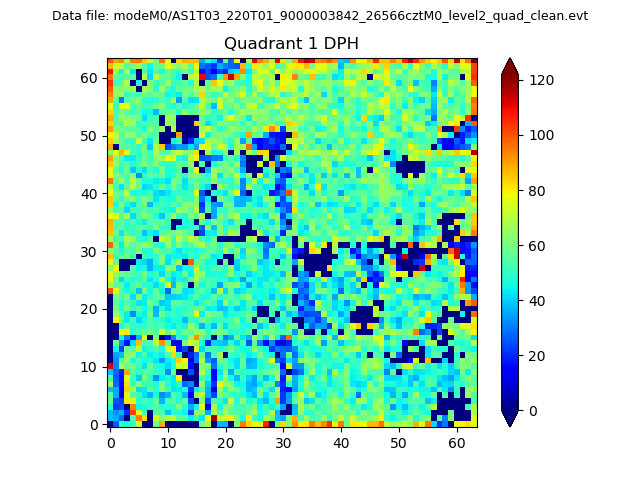 |
Quadrant B |
|---|---|---|---|
| Quadrant D | 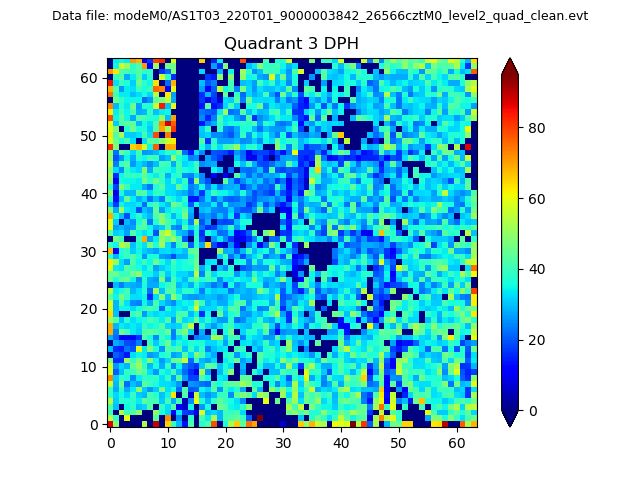 |
 |
Quadrant C |
| Plot type | Count rate plots | Images |
|---|---|---|
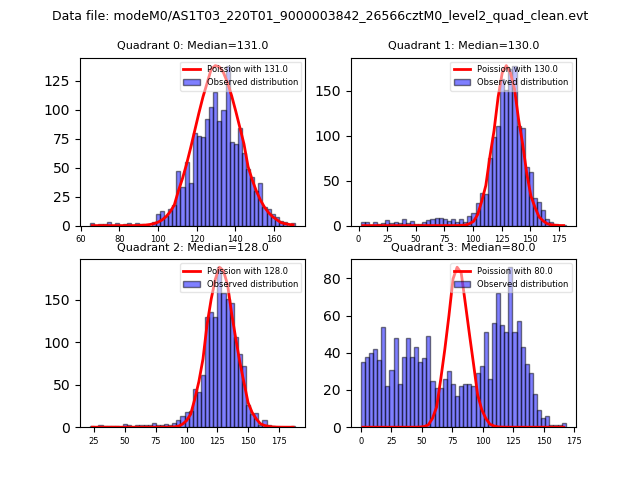
| Comparison with Poisson distribution Blue bars denote a histogram of data divided into 1 sec bins. Red curve is a Poisson curve with rate = median count rate of data. |
 |
 |
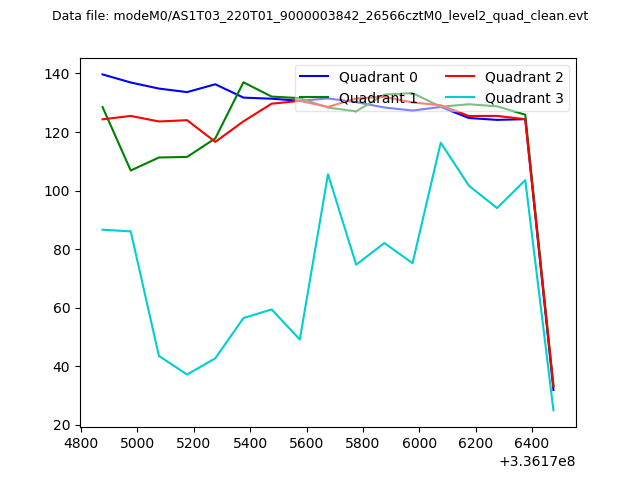
| Quadrant-wise count rates Data is divided into 100 sec bins |
 |
|
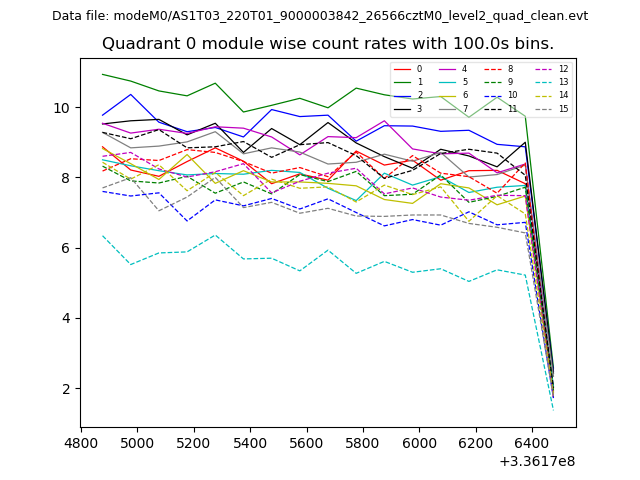
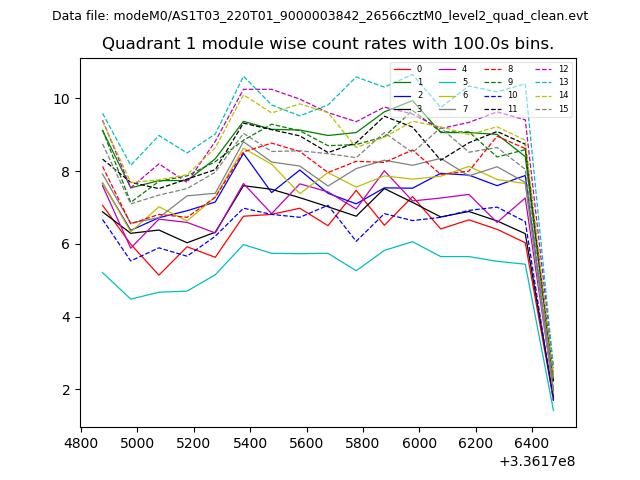
| Module-wise count rates for Quadrant A Data is divided into 100 sec bins |
 |
 |
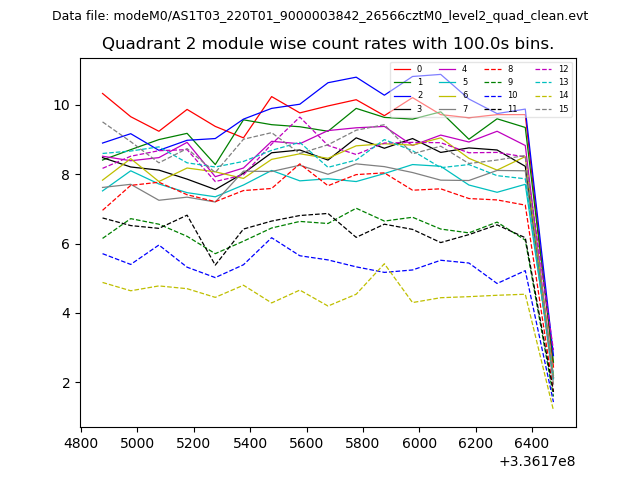
| Module-wise count rates for Quadrant B Data is divided into 100 sec bins |
 |
 |
| Module-wise count rates for Quadrant C Data is divided into 100 sec bins |
 |
 |
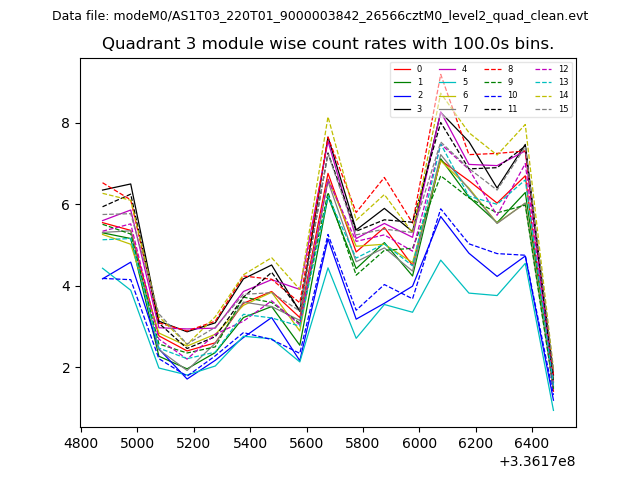
| Module-wise count rates for Quadrant D Data is divided into 100 sec bins |
 |
 |
| Parameter | Plot |
|---|---|
| CZT HV Monitor | 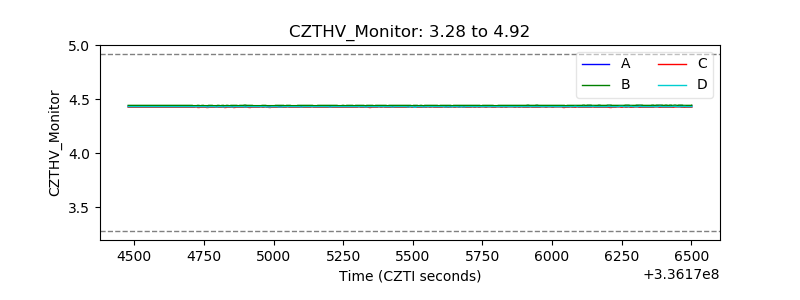 |
| D_VDD | 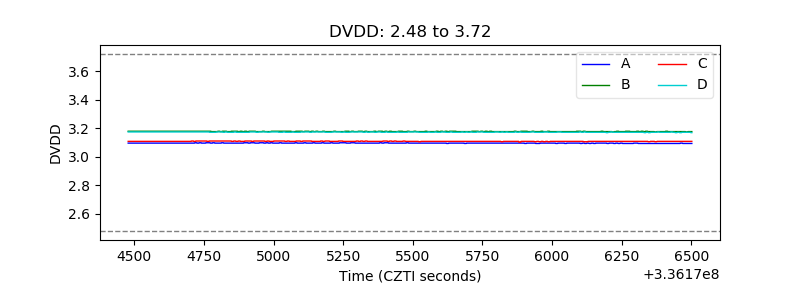 |
| Temperature 1 | 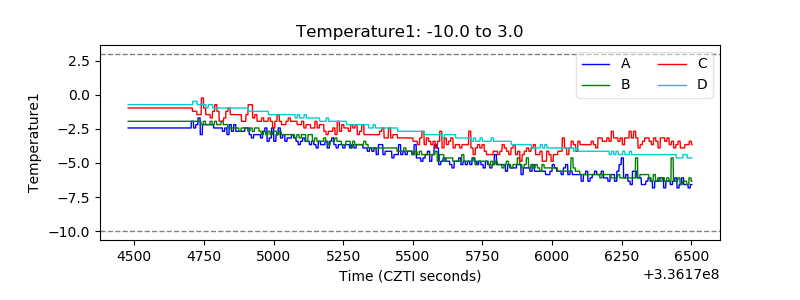 |
| Veto HV Monitor | 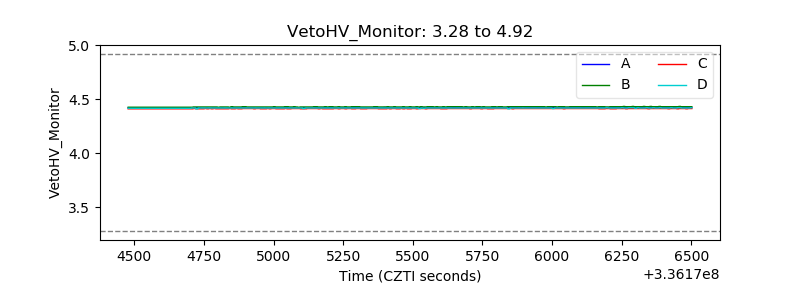 |
| Veto LLD | 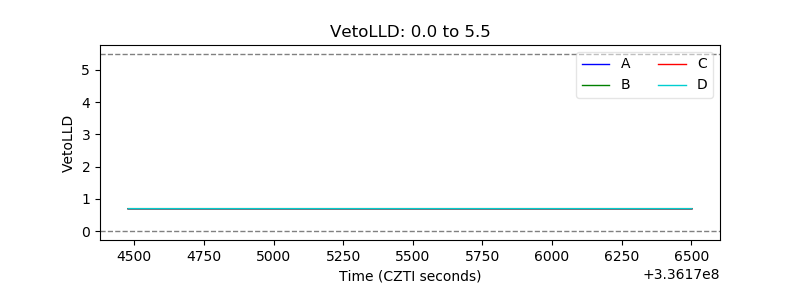 |
| Alpha Counter | 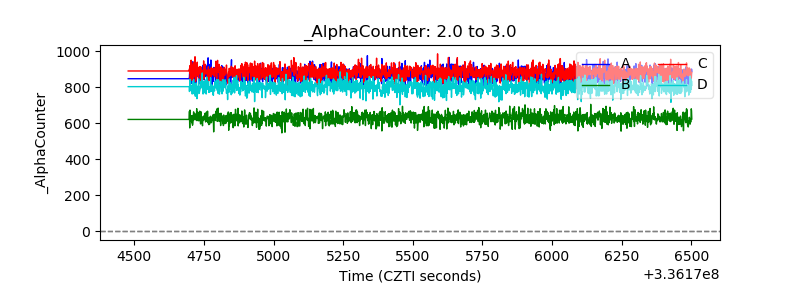 |
| _CPM_Rate | 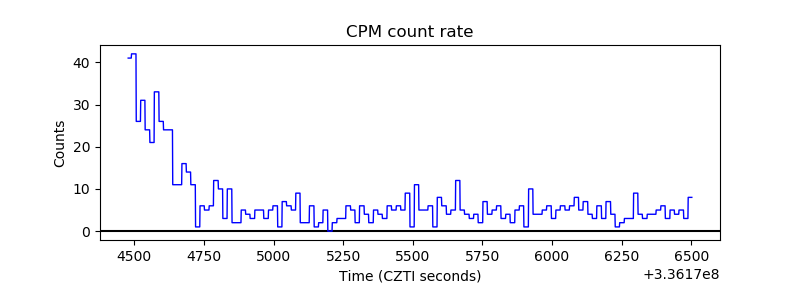 |
| CZT Counter | 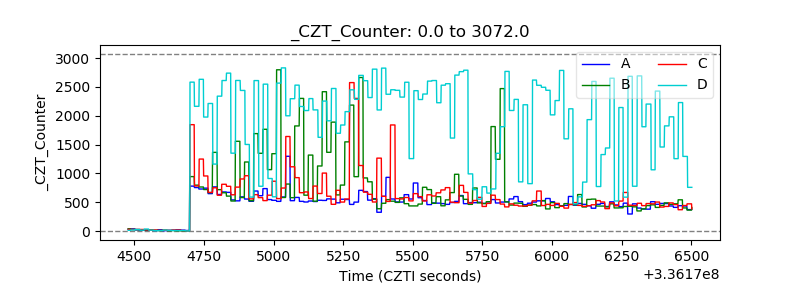 |
| +2.5 Volts monitor | 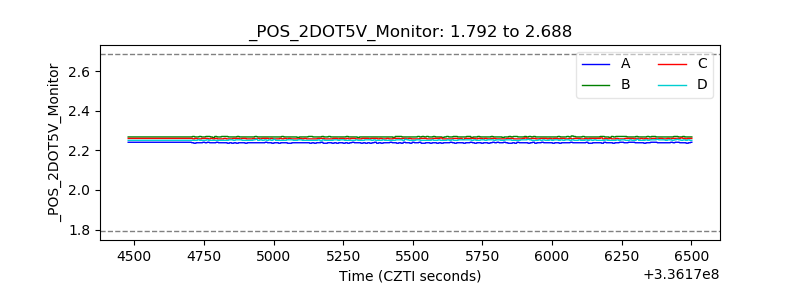 |
| +5 Volts monitor | 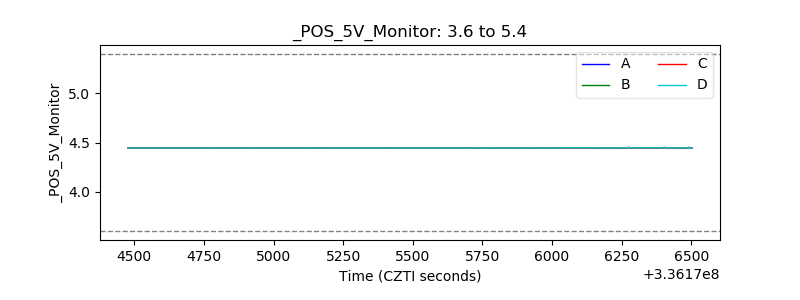 |
| _ROLL_ROT | 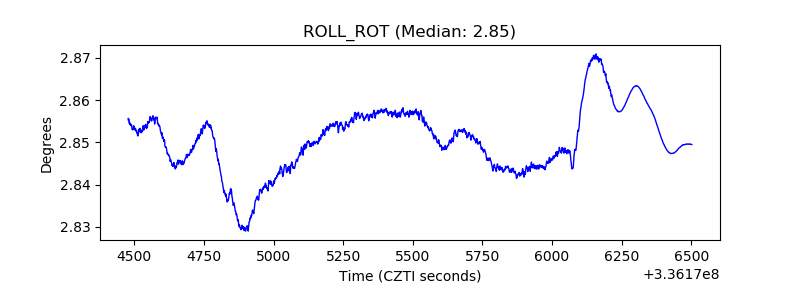 |
| _Roll_DEC | 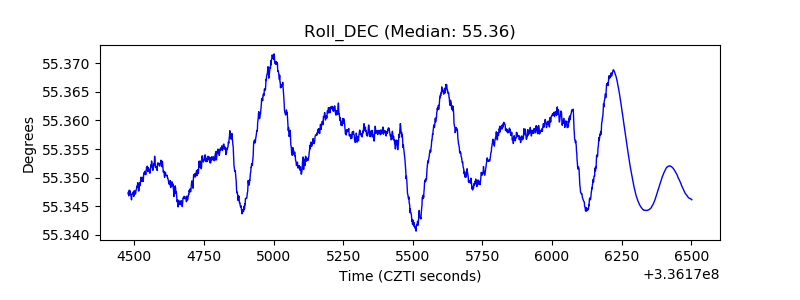 |
| _Roll_RA | 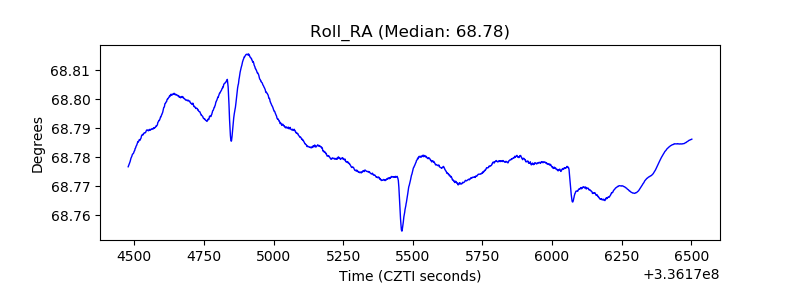 |
| Veto Counter | 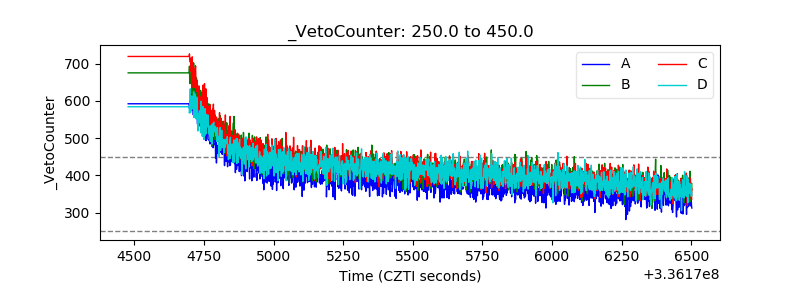 |