| Param | Original file | Final file |
|---|---|---|
| Filename | modeM0/AS1A09_095T02_9000003846_26571cztM0_level2.evt | modeM0/AS1A09_095T02_9000003846_26571cztM0_level2_quad_clean.evt |
| Size (bytes) | 1,080,057,600 | 149,564,160 |
| Size | 1.0 GB | 142.6 MB |
| Events in quadrant A | 4,834,871 | 1,006,323 |
| Events in quadrant B | 5,322,218 | 1,024,950 |
| Events in quadrant C | 7,479,581 | 959,724 |
| Events in quadrant D | 14,383,646 | 829,329 |
| Mode M9 | |||
|---|---|---|---|
| Quadrant | BADHDUFLAG | Total packets | Discarded packets |
| A | 0 | 11 | 0 |
| B | 0 | 11 | 0 |
| C | 0 | 11 | 0 |
| D | 0 | 11 | 0 |
| Mode M0 | |||
|---|---|---|---|
| Quadrant | BADHDUFLAG | Total packets | Discarded packets |
| A | 0 | 20832 | 0 |
| B | 0 | 22473 | 0 |
| C | 0 | 28749 | 0 |
| D | 0 | 49843 | 0 |
| Quadrant | Total seconds | Saturated seconds | Saturation percentage |
|---|---|---|---|
| A | 10219 | 54 | 0.528427% |
| B | 10219 | 200 | 1.957139% |
| C | 10218 | 906 | 8.866706% |
| D | 10218 | 2980 | 29.164220% |
Noise dominated data is calculated using 1-second bins in cleaned event files. If a bin has >2000 counts, and if more than 50% of those come from <1% of pixels, then it is considered to be noise-dominated and hence unusable.
| Quadrant | # 1 sec bins | Bins with >0 counts | Bins with >2000 counts | High rate bins dominated by noise | Noise dominated (total time) | Noise dominated (detector-on time) | Marked lightcurve |
|---|---|---|---|---|---|---|---|
| A | 11414 | 10220 | 0 | 0 | 0.00% | 0.00% | 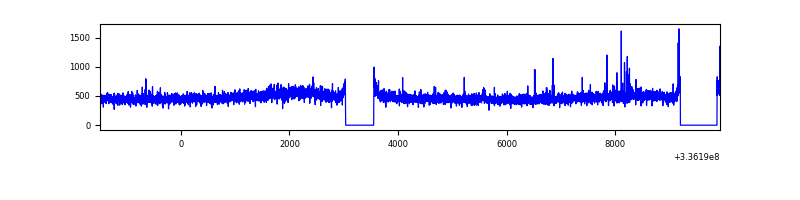 |
| B | 11414 | 10220 | 61 | 61 | 0.53% | 0.60% | 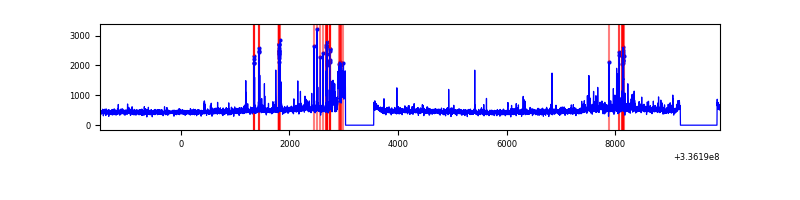 |
| C | 11413 | 10219 | 561 | 561 | 4.92% | 5.49% | 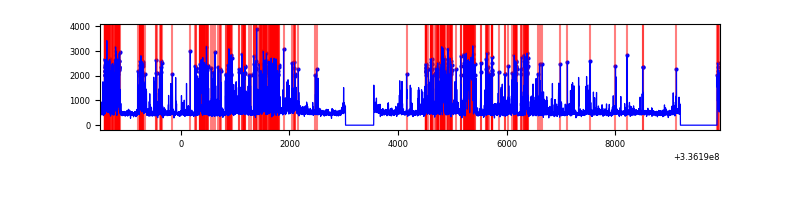 |
| D | 11413 | 10218 | 2663 | 2663 | 23.33% | 26.06% | 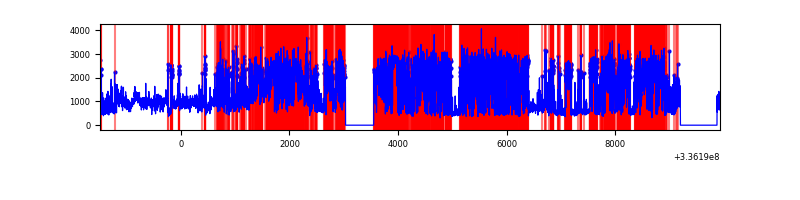 |
Top three noisy pixels from each quadrant. If the there are fewer than three noisy pixels in the level2.evt file, extra rows are filled as -1
| Pixel properties | Quadrant properties | ||||||
|---|---|---|---|---|---|---|---|
| Quadrant | DetID | PixID | Counts | Sigma | Mean | Median | Sigma |
| A | 6 | 16 | 84353 | 340.72 | 1207 | 1181 | 244.1 |
| A | 5 | 168 | 71040 | 286.18 | 1207 | 1181 | 244.1 |
| A | 13 | 254 | 17552 | 67.06 | 1207 | 1181 | 244.1 |
| B | 5 | 172 | 263492 | 1147.0 | 1195 | 1161 | 228.7 |
| B | 0 | 245 | 248826 | 1082.88 | 1195 | 1161 | 228.7 |
| B | 3 | 112 | 84526 | 364.5 | 1195 | 1161 | 228.7 |
| C | 4 | 254 | 2686847 | 10158.14 | 1130 | 1138 | 264.4 |
| C | 14 | 238 | 178492 | 670.81 | 1130 | 1138 | 264.4 |
| C | 3 | 233 | 161388 | 606.11 | 1130 | 1138 | 264.4 |
| D | 7 | 80 | 7714019 | 30721.29 | 1038 | 1005 | 251.1 |
| D | 1 | 52 | 2370341 | 9437.17 | 1038 | 1005 | 251.1 |
| D | 2 | 250 | 249250 | 988.77 | 1038 | 1005 | 251.1 |
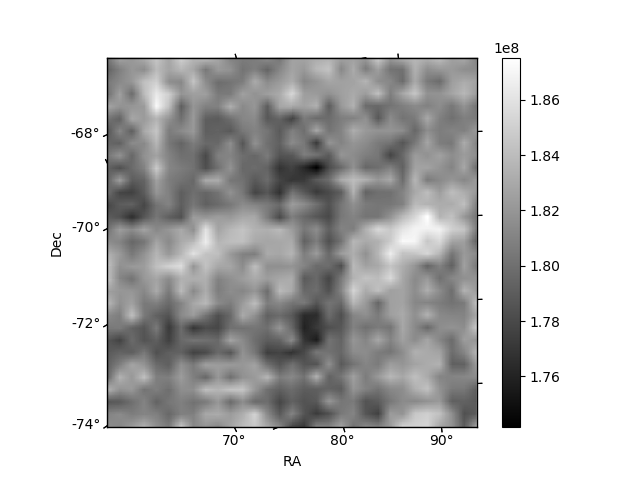
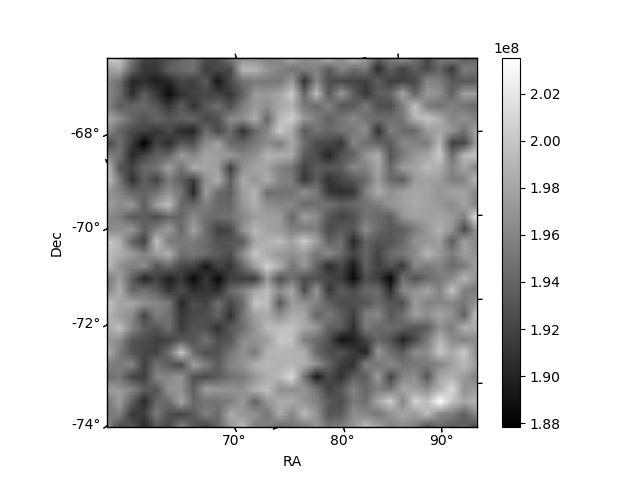
Histogram calculated using DETX and DETY for each event in the final _common_clean file
| Quadrant A | 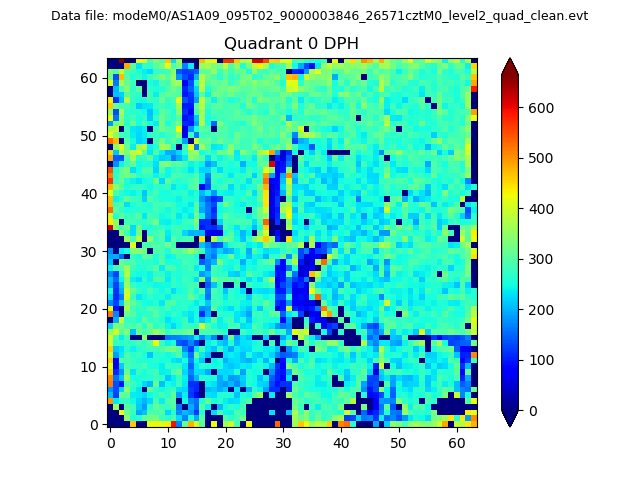 |
 |
Quadrant B |
|---|---|---|---|
| Quadrant D | 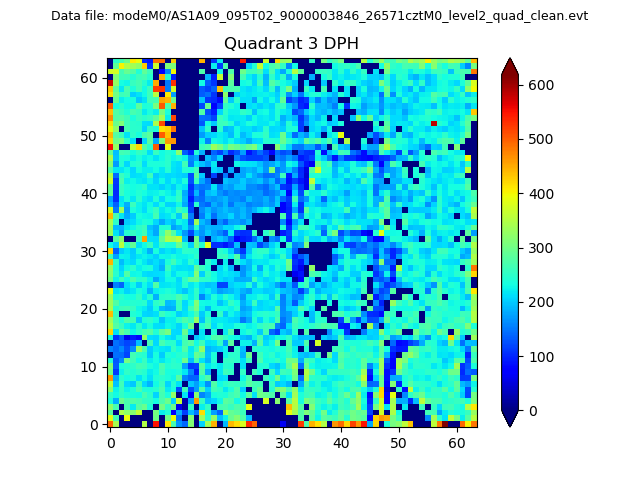 |
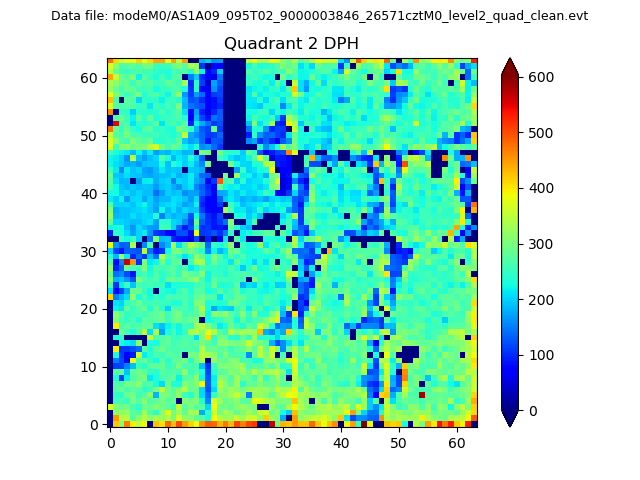 |
Quadrant C |
| Plot type | Count rate plots | Images |
|---|---|---|
| Comparison with Poisson distribution Blue bars denote a histogram of data divided into 1 sec bins. Red curve is a Poisson curve with rate = median count rate of data. |
 |
 |
| Quadrant-wise count rates Data is divided into 100 sec bins |
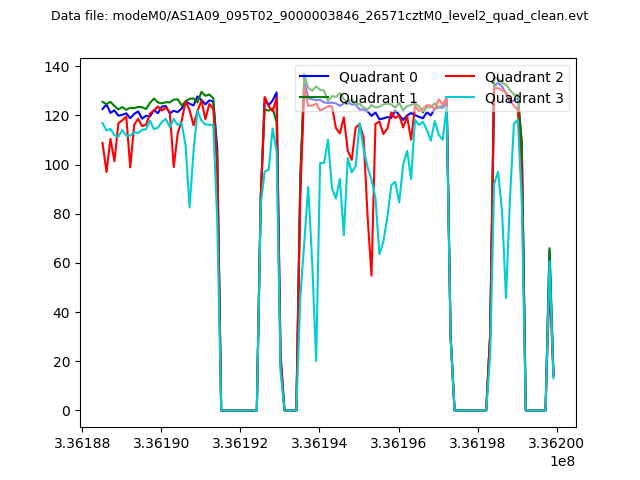 |
|
| Module-wise count rates for Quadrant A Data is divided into 100 sec bins |
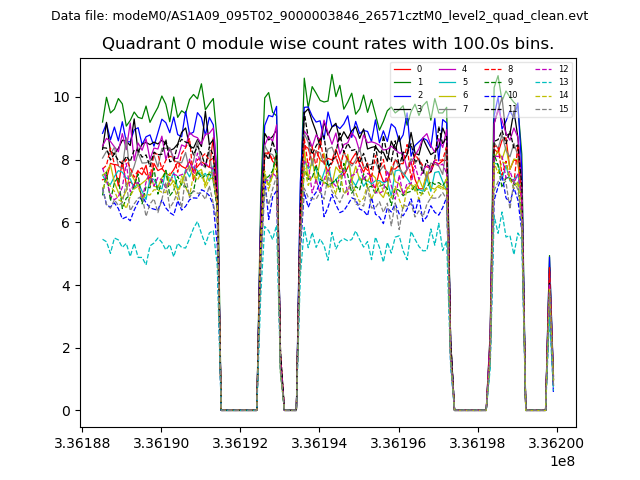 |
 |
| Module-wise count rates for Quadrant B Data is divided into 100 sec bins |
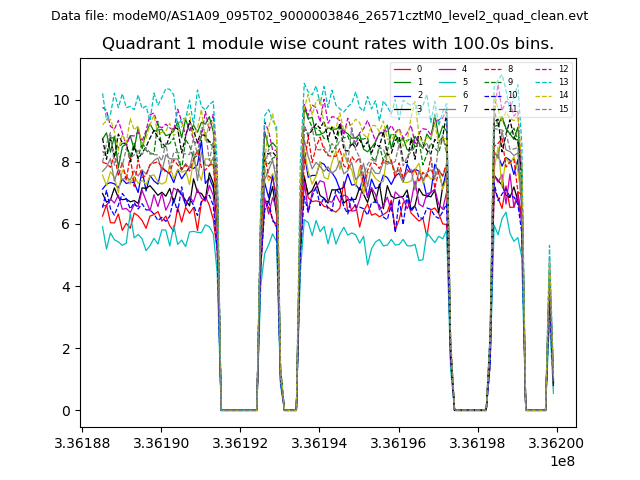 |
 |
| Module-wise count rates for Quadrant C Data is divided into 100 sec bins |
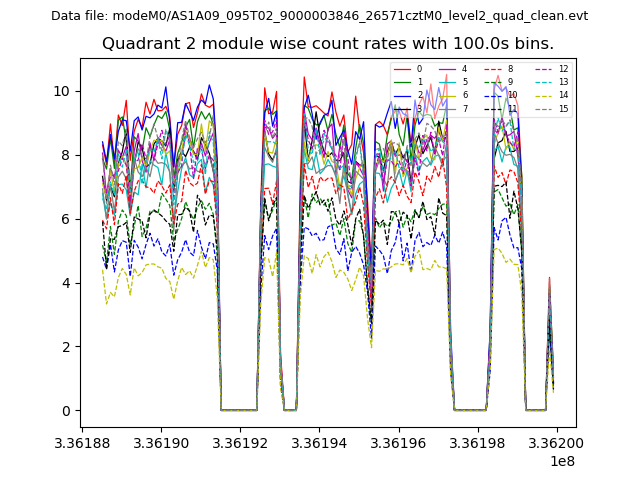 |
 |
| Module-wise count rates for Quadrant D Data is divided into 100 sec bins |
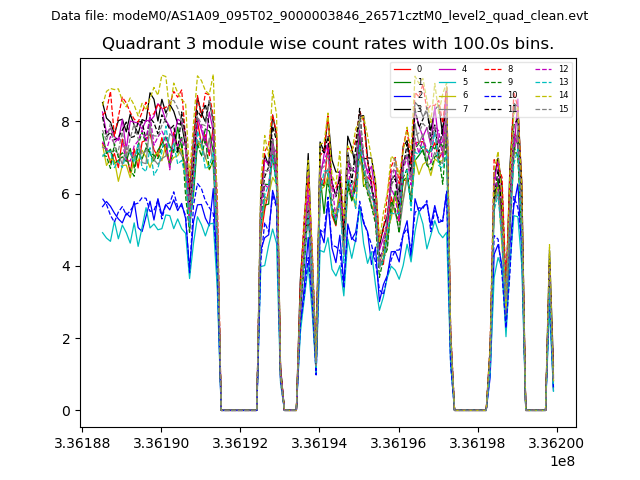 |
 |
| Parameter | Plot |
|---|---|
| CZT HV Monitor | 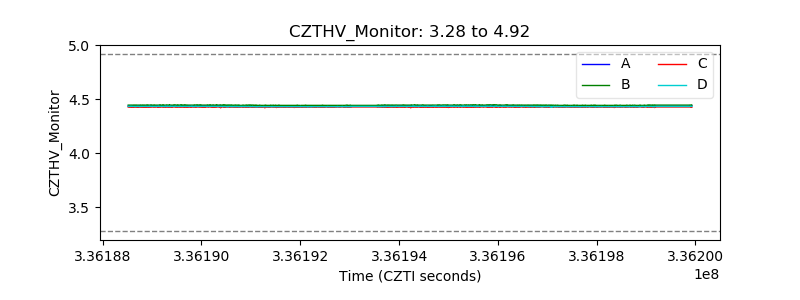 |
| D_VDD | 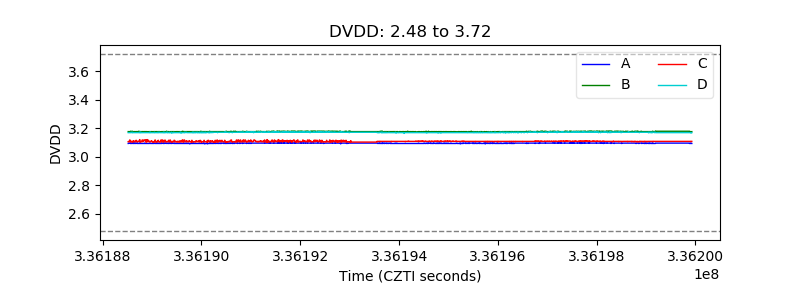 |
| Temperature 1 | 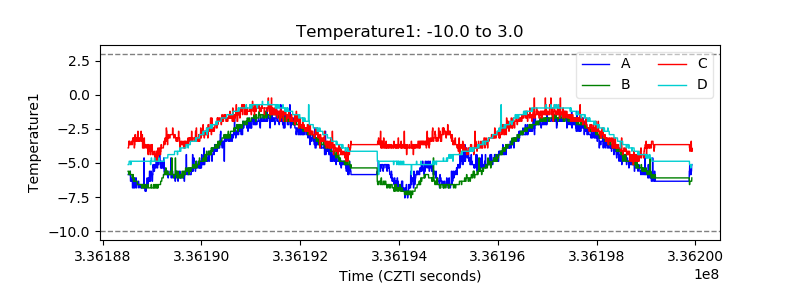 |
| Veto HV Monitor | 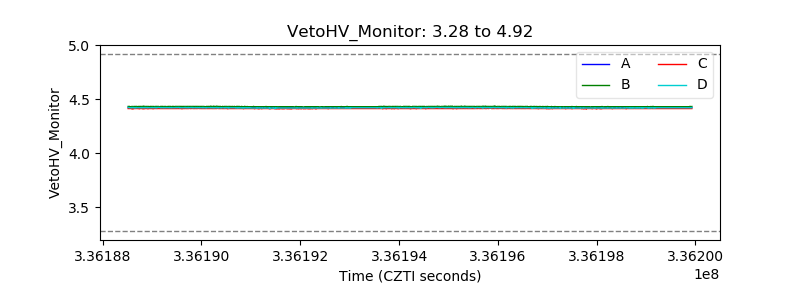 |
| Veto LLD | 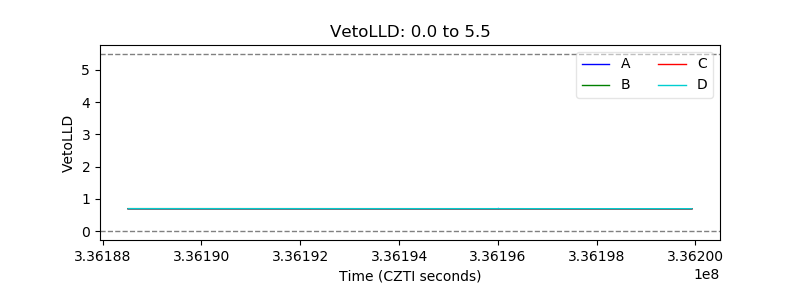 |
| Alpha Counter | 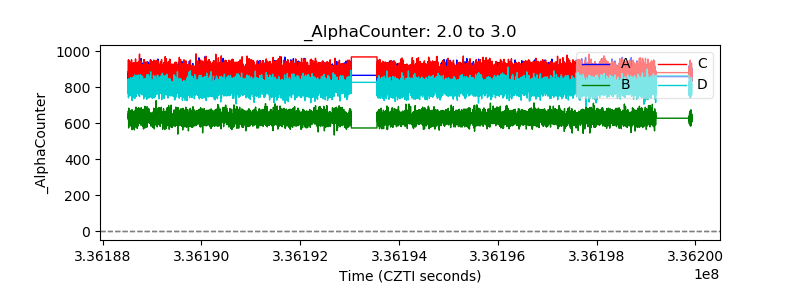 |
| _CPM_Rate | 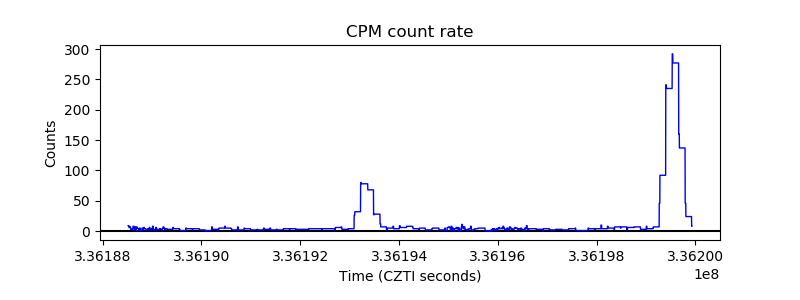 |
| CZT Counter | 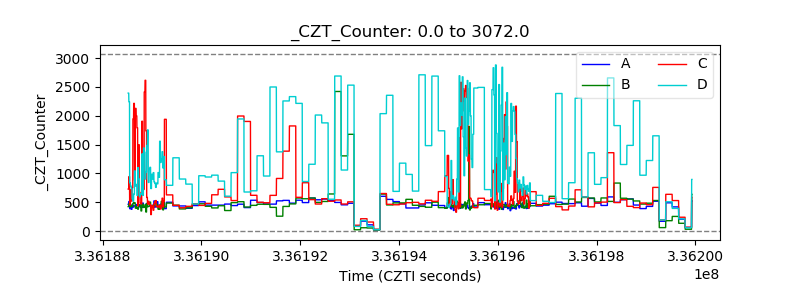 |
| +2.5 Volts monitor |  |
| +5 Volts monitor |  |
| _ROLL_ROT | 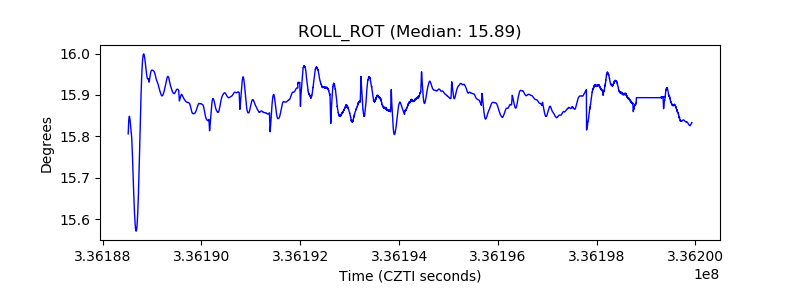 |
| _Roll_DEC | 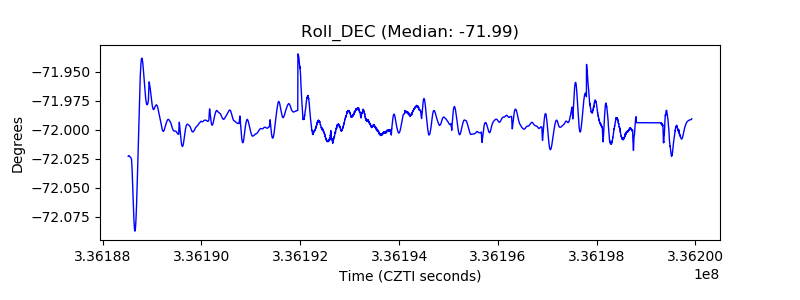 |
| _Roll_RA | 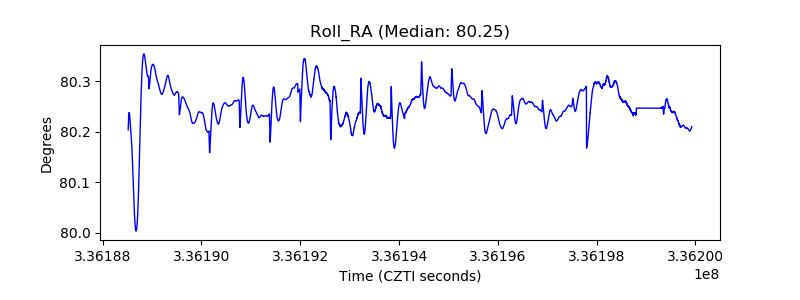 |
| Veto Counter | 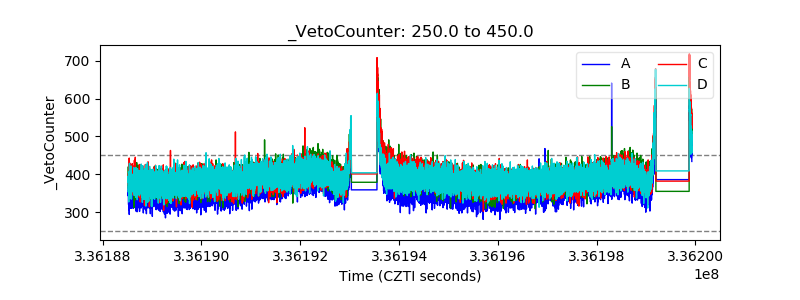 |