| Param | Original file | Final file |
|---|---|---|
| Filename | modeM0/AS1A09_095T02_9000003846_26573cztM0_level2.evt | modeM0/AS1A09_095T02_9000003846_26573cztM0_level2_quad_clean.evt |
| Size (bytes) | 1,978,064,640 | 292,570,560 |
| Size | 1.8 GB | 279.0 MB |
| Events in quadrant A | 8,984,713 | 2,040,490 |
| Events in quadrant B | 10,923,763 | 2,059,216 |
| Events in quadrant C | 12,241,040 | 1,975,145 |
| Events in quadrant D | 26,535,684 | 1,533,705 |
| Mode M9 | |||
|---|---|---|---|
| Quadrant | BADHDUFLAG | Total packets | Discarded packets |
| A | 0 | 37 | 0 |
| B | 0 | 37 | 0 |
| C | 0 | 37 | 0 |
| D | 0 | 37 | 0 |
| Mode M0 | |||
|---|---|---|---|
| Quadrant | BADHDUFLAG | Total packets | Discarded packets |
| A | 0 | 38320 | 0 |
| B | 0 | 44009 | 0 |
| C | 0 | 48113 | 0 |
| D | 0 | 91195 | 0 |
| Quadrant | Total seconds | Saturated seconds | Saturation percentage |
|---|---|---|---|
| A | 18140 | 171 | 0.942668% |
| B | 18141 | 506 | 2.789262% |
| C | 18140 | 1201 | 6.620728% |
| D | 18140 | 6641 | 36.609702% |
Noise dominated data is calculated using 1-second bins in cleaned event files. If a bin has >2000 counts, and if more than 50% of those come from <1% of pixels, then it is considered to be noise-dominated and hence unusable.
| Quadrant | # 1 sec bins | Bins with >0 counts | Bins with >2000 counts | High rate bins dominated by noise | Noise dominated (total time) | Noise dominated (detector-on time) | Marked lightcurve |
|---|---|---|---|---|---|---|---|
| A | 21850 | 18141 | 49 | 49 | 0.22% | 0.27% | 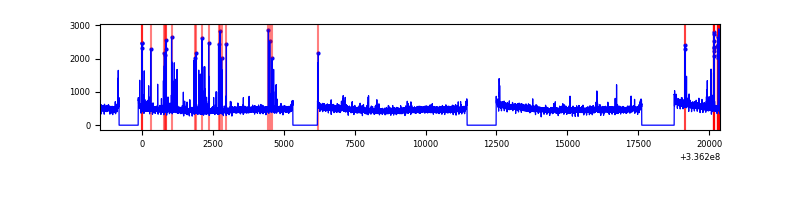 |
| B | 21851 | 18141 | 294 | 294 | 1.35% | 1.62% | 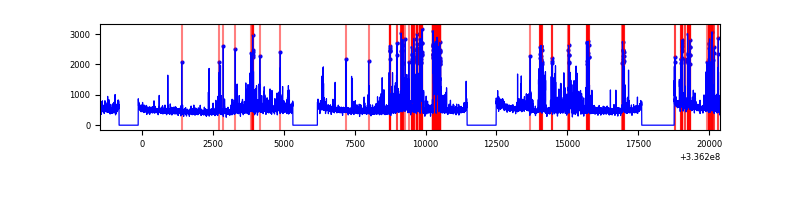 |
| C | 21850 | 18140 | 634 | 634 | 2.90% | 3.50% | 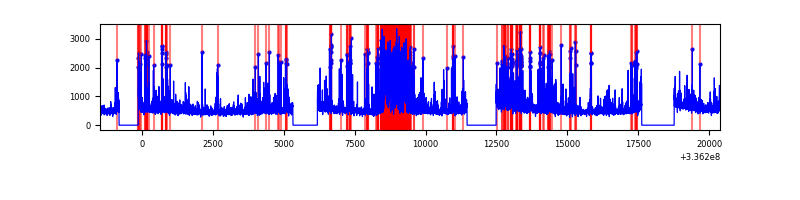 |
| D | 21850 | 18141 | 5868 | 5868 | 26.86% | 32.35% | 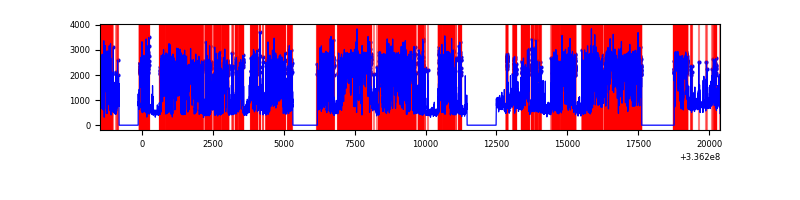 |
Top three noisy pixels from each quadrant. If the there are fewer than three noisy pixels in the level2.evt file, extra rows are filled as -1
| Pixel properties | Quadrant properties | ||||||
|---|---|---|---|---|---|---|---|
| Quadrant | DetID | PixID | Counts | Sigma | Mean | Median | Sigma |
| A | 6 | 16 | 180126 | 400.97 | 2239 | 2191 | 443.8 |
| A | 0 | 13 | 148790 | 330.36 | 2239 | 2191 | 443.8 |
| A | 13 | 254 | 28503 | 59.29 | 2239 | 2191 | 443.8 |
| B | 3 | 64 | 1582144 | 3842.9 | 2199 | 2146 | 411.1 |
| B | 3 | 112 | 473858 | 1147.31 | 2199 | 2146 | 411.1 |
| B | 0 | 245 | 107205 | 255.53 | 2199 | 2146 | 411.1 |
| C | 4 | 254 | 3152966 | 6492.81 | 2113 | 2126 | 485.3 |
| C | 3 | 233 | 446734 | 916.19 | 2113 | 2126 | 485.3 |
| C | 14 | 238 | 340402 | 697.07 | 2113 | 2126 | 485.3 |
| D | 7 | 80 | 13200131 | 30816.57 | 1790 | 1740 | 428.3 |
| D | 1 | 52 | 4534891 | 10584.33 | 1790 | 1740 | 428.3 |
| D | 12 | 233 | 1620479 | 3779.55 | 1790 | 1740 | 428.3 |
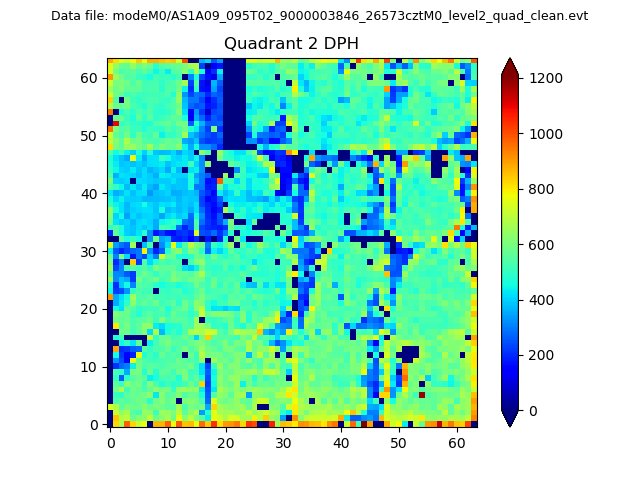
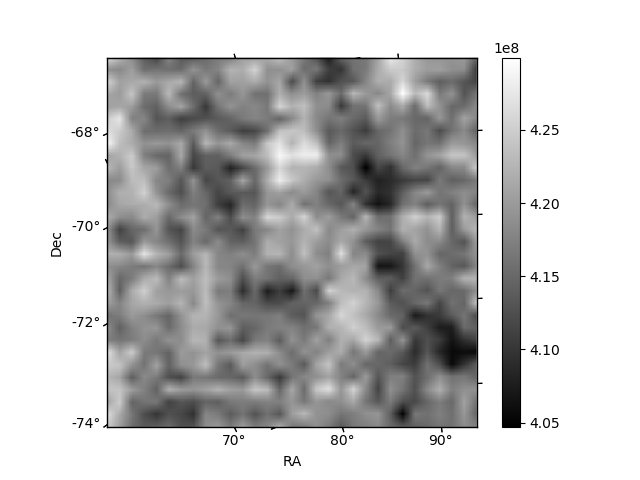
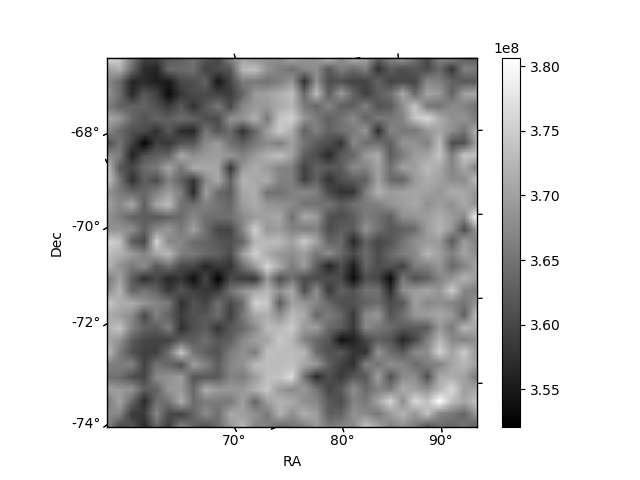
Histogram calculated using DETX and DETY for each event in the final _common_clean file
| Quadrant A | 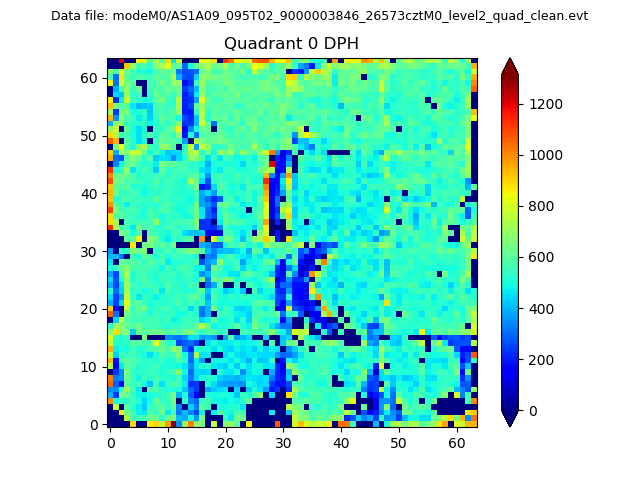 |
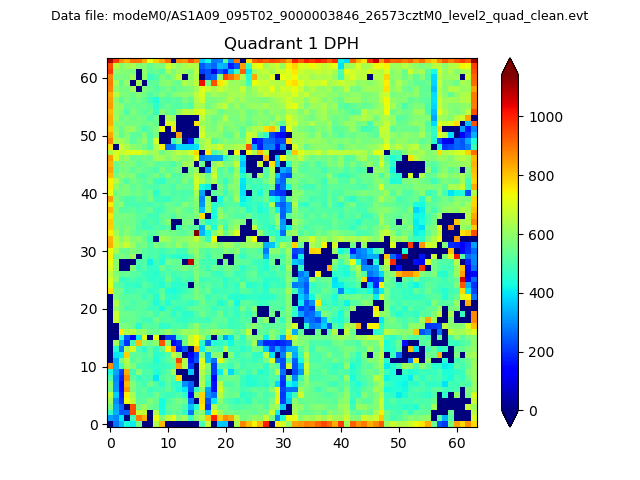 |
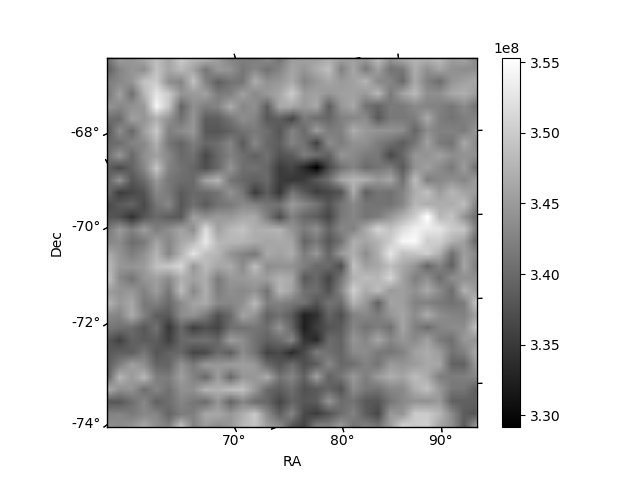
Quadrant B |
|---|---|---|---|
| Quadrant D | 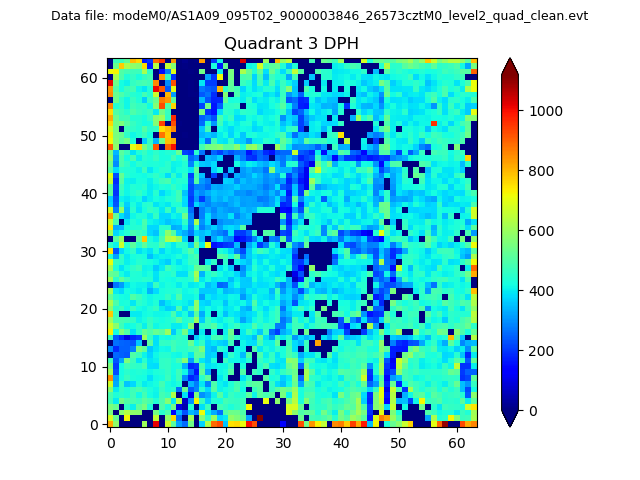 |
 |
Quadrant C |
| Plot type | Count rate plots | Images |
|---|---|---|
| Comparison with Poisson distribution Blue bars denote a histogram of data divided into 1 sec bins. Red curve is a Poisson curve with rate = median count rate of data. |
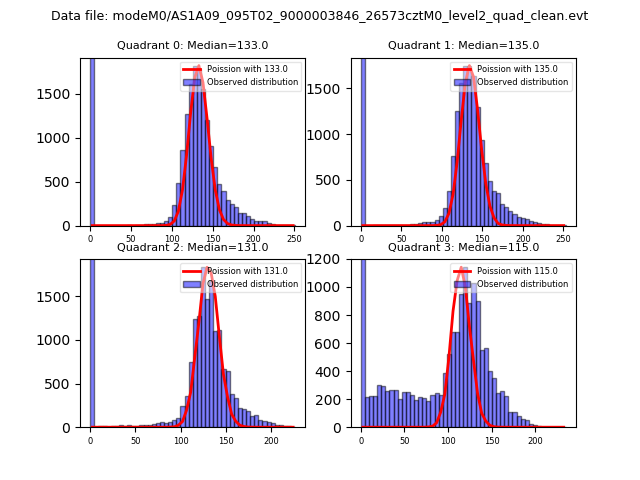 |
 |
| Quadrant-wise count rates Data is divided into 100 sec bins |
 |
|
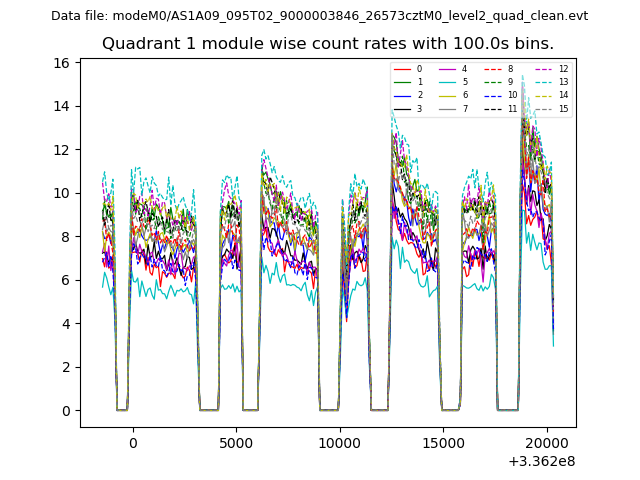
| Module-wise count rates for Quadrant A Data is divided into 100 sec bins |
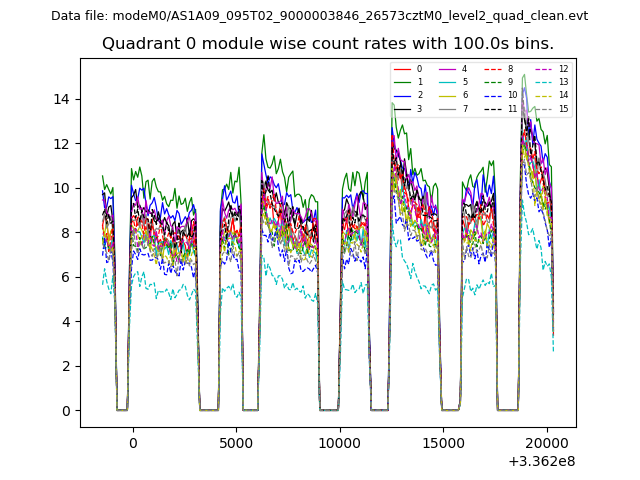 |
 |
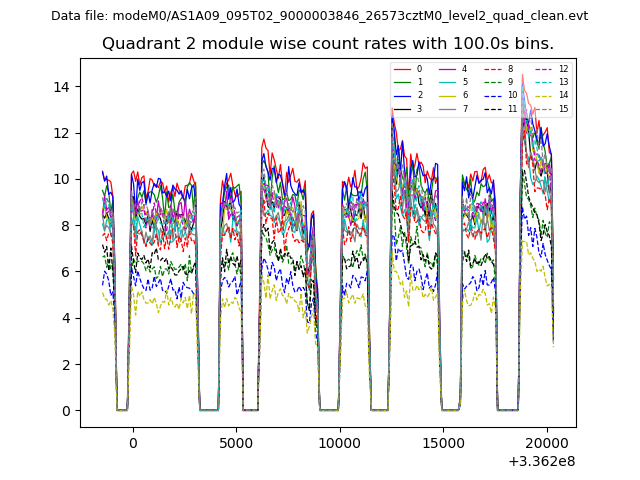
| Module-wise count rates for Quadrant B Data is divided into 100 sec bins |
 |
 |
| Module-wise count rates for Quadrant C Data is divided into 100 sec bins |
 |
 |
| Module-wise count rates for Quadrant D Data is divided into 100 sec bins |
 |
 |
| Parameter | Plot |
|---|---|
| CZT HV Monitor | 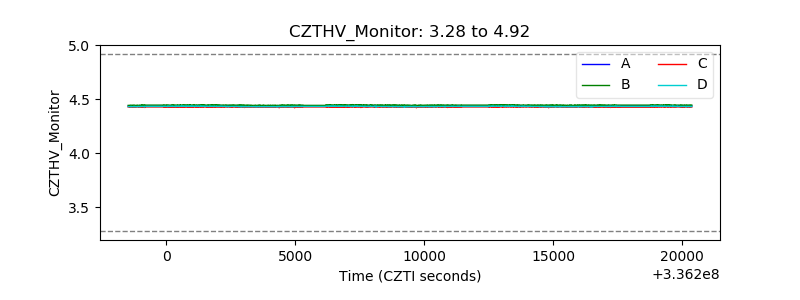 |
| D_VDD | 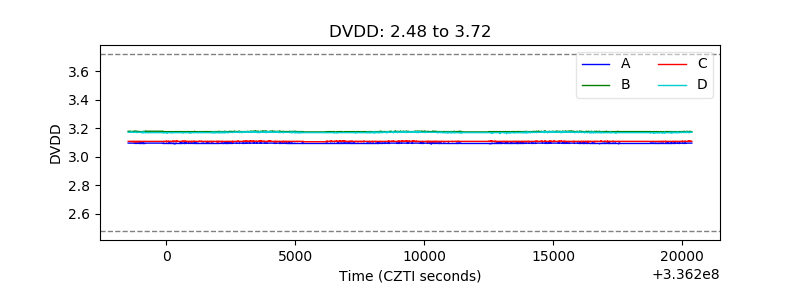 |
| Temperature 1 | 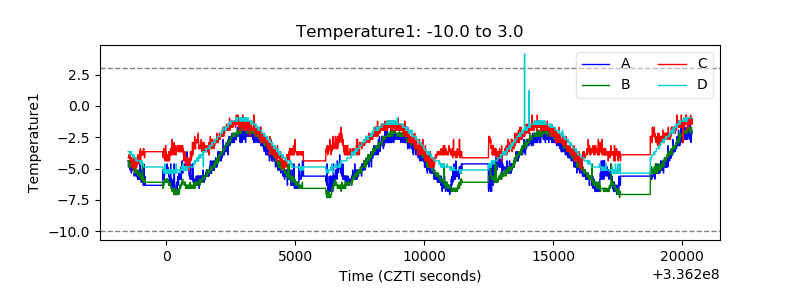 |
| Veto HV Monitor | 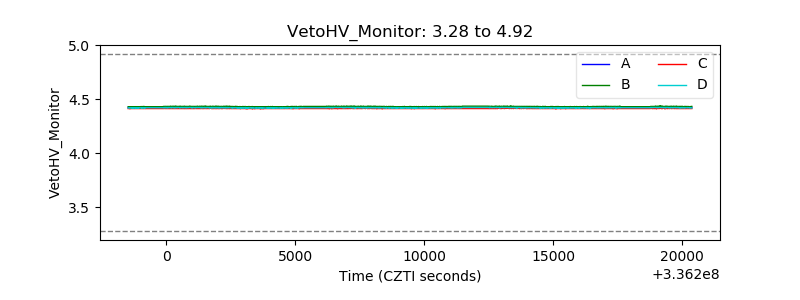 |
| Veto LLD | 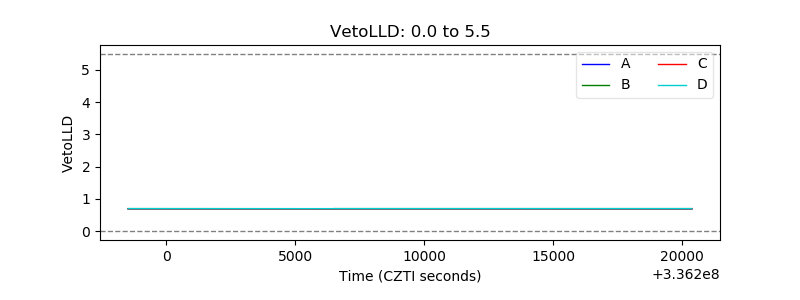 |
| Alpha Counter |  |
| _CPM_Rate | 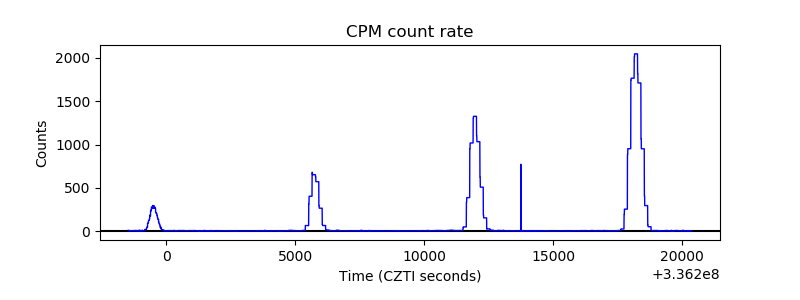 |
| CZT Counter | 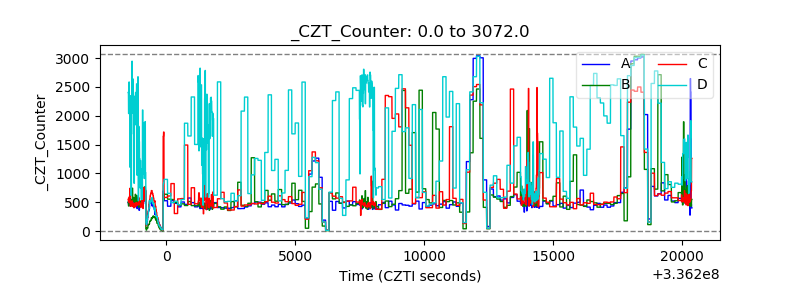 |
| +2.5 Volts monitor | 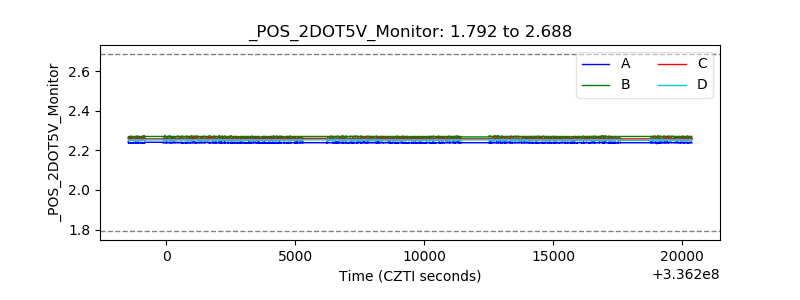 |
| +5 Volts monitor |  |
| _ROLL_ROT | 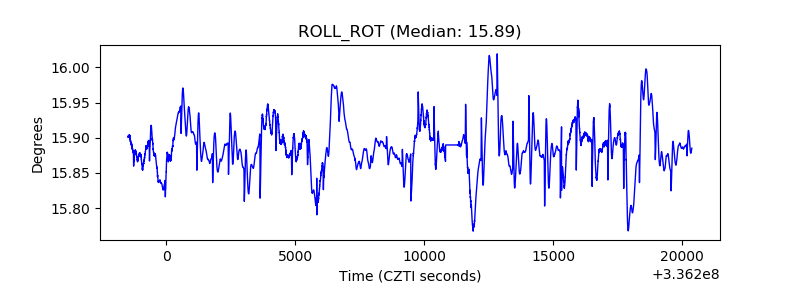 |
| _Roll_DEC |  |
| _Roll_RA | 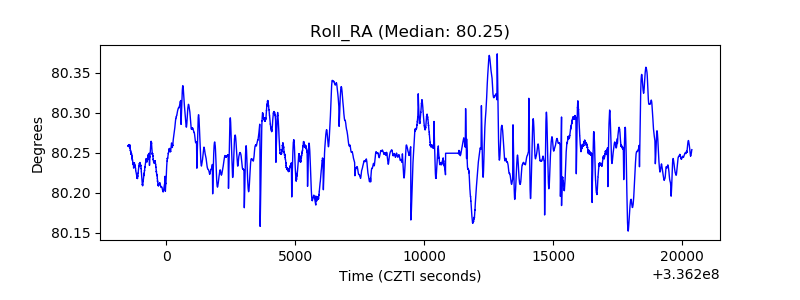 |
| Veto Counter | 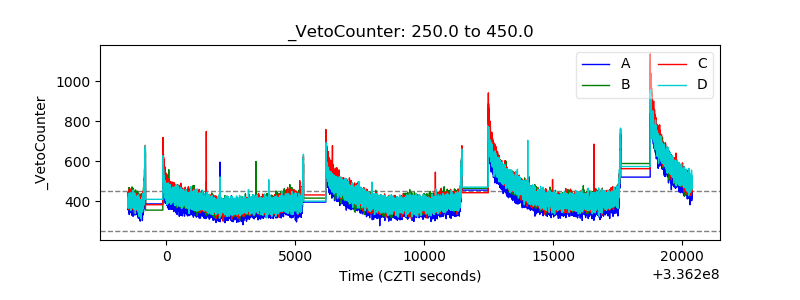 |