| Param | Original file | Final file |
|---|---|---|
| Filename | modeM0/AS1A09_095T02_9000003846_26574cztM0_level2.evt | modeM0/AS1A09_095T02_9000003846_26574cztM0_level2_quad_clean.evt |
| Size (bytes) | 667,442,880 | 105,877,440 |
| Size | 636.5 MB | 101.0 MB |
| Events in quadrant A | 3,173,262 | 757,224 |
| Events in quadrant B | 3,564,404 | 765,968 |
| Events in quadrant C | 3,591,617 | 720,906 |
| Events in quadrant D | 9,485,390 | 549,509 |
| Mode M9 | |||
|---|---|---|---|
| Quadrant | BADHDUFLAG | Total packets | Discarded packets |
| A | 0 | 12 | 0 |
| B | 0 | 12 | 0 |
| C | 0 | 12 | 0 |
| D | 0 | 12 | 0 |
| Mode M0 | |||
|---|---|---|---|
| Quadrant | BADHDUFLAG | Total packets | Discarded packets |
| A | 0 | 13149 | 0 |
| B | 0 | 14362 | 0 |
| C | 0 | 14363 | 0 |
| D | 0 | 32290 | 0 |
| Quadrant | Total seconds | Saturated seconds | Saturation percentage |
|---|---|---|---|
| A | 5896 | 97 | 1.645183% |
| B | 5897 | 148 | 2.509751% |
| C | 5897 | 207 | 3.510259% |
| D | 5896 | 2374 | 40.264586% |
Noise dominated data is calculated using 1-second bins in cleaned event files. If a bin has >2000 counts, and if more than 50% of those come from <1% of pixels, then it is considered to be noise-dominated and hence unusable.
| Quadrant | # 1 sec bins | Bins with >0 counts | Bins with >2000 counts | High rate bins dominated by noise | Noise dominated (total time) | Noise dominated (detector-on time) | Marked lightcurve |
|---|---|---|---|---|---|---|---|
| A | 7121 | 5896 | 27 | 27 | 0.38% | 0.46% | 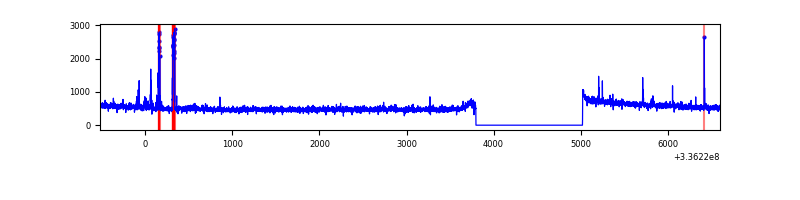 |
| B | 7122 | 5897 | 52 | 52 | 0.73% | 0.88% | 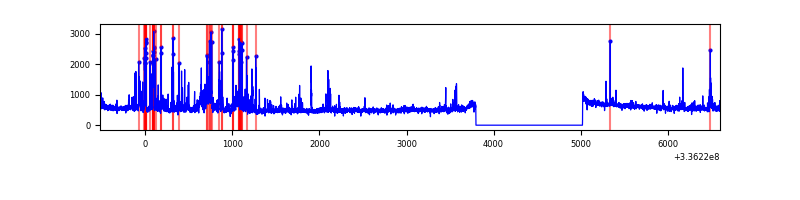 |
| C | 7122 | 5897 | 41 | 41 | 0.58% | 0.70% | 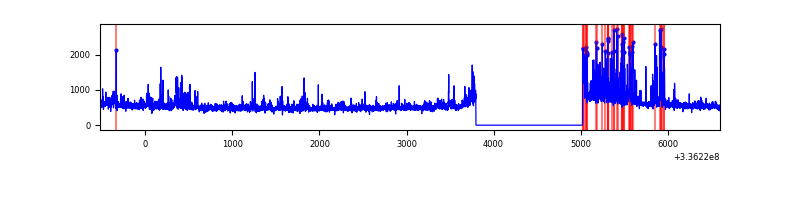 |
| D | 7120 | 5895 | 2149 | 2149 | 30.18% | 36.45% | 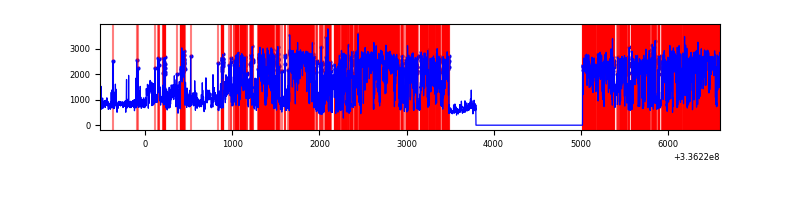 |
Top three noisy pixels from each quadrant. If the there are fewer than three noisy pixels in the level2.evt file, extra rows are filled as -1
| Pixel properties | Quadrant properties | ||||||
|---|---|---|---|---|---|---|---|
| Quadrant | DetID | PixID | Counts | Sigma | Mean | Median | Sigma |
| A | 0 | 13 | 108309 | 689.68 | 789 | 776 | 155.9 |
| A | 13 | 254 | 9112 | 53.46 | 789 | 776 | 155.9 |
| A | 12 | 96 | 8758 | 51.19 | 789 | 776 | 155.9 |
| B | 3 | 64 | 276265 | 1950.3 | 771 | 754 | 141.3 |
| B | 3 | 112 | 112312 | 789.7 | 771 | 754 | 141.3 |
| B | 15 | 33 | 97789 | 686.9 | 771 | 754 | 141.3 |
| C | 4 | 254 | 347618 | 2059.93 | 739 | 744 | 168.4 |
| C | 3 | 233 | 225244 | 1333.2 | 739 | 744 | 168.4 |
| C | 14 | 238 | 122109 | 720.73 | 739 | 744 | 168.4 |
| D | 7 | 80 | 4812639 | 32195.81 | 622 | 606 | 149.5 |
| D | 1 | 52 | 2040768 | 13650.09 | 622 | 606 | 149.5 |
| D | 2 | 250 | 157489 | 1049.66 | 622 | 606 | 149.5 |
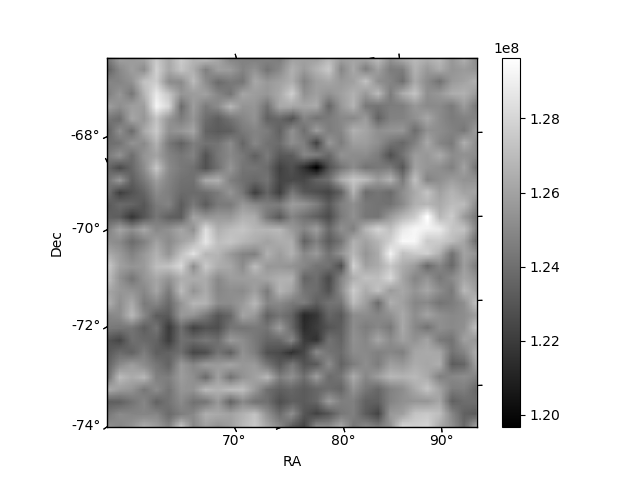
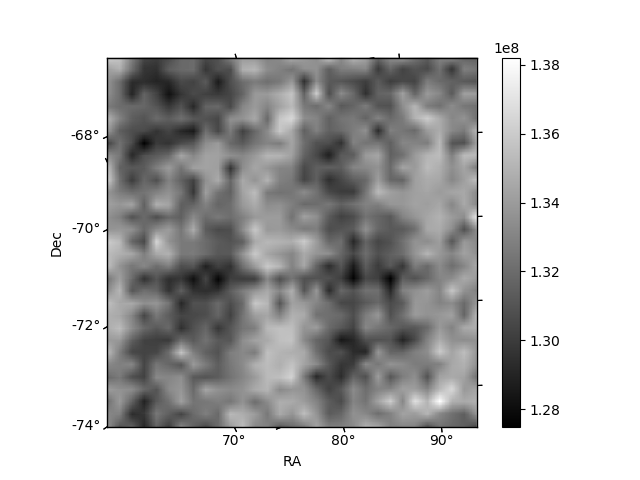
Histogram calculated using DETX and DETY for each event in the final _common_clean file
| Quadrant A | 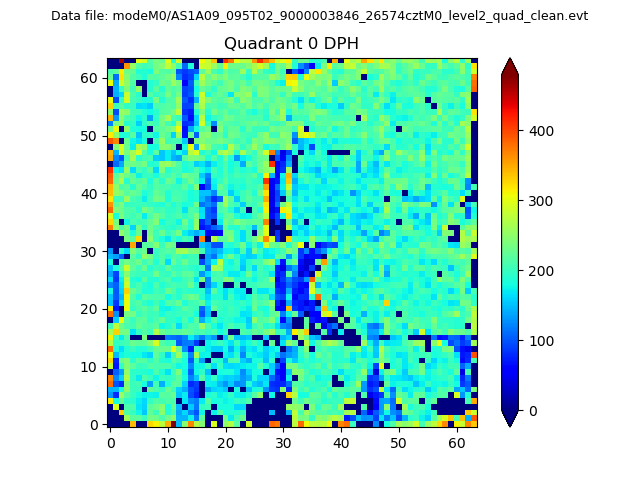 |
 |
Quadrant B |
|---|---|---|---|
| Quadrant D | 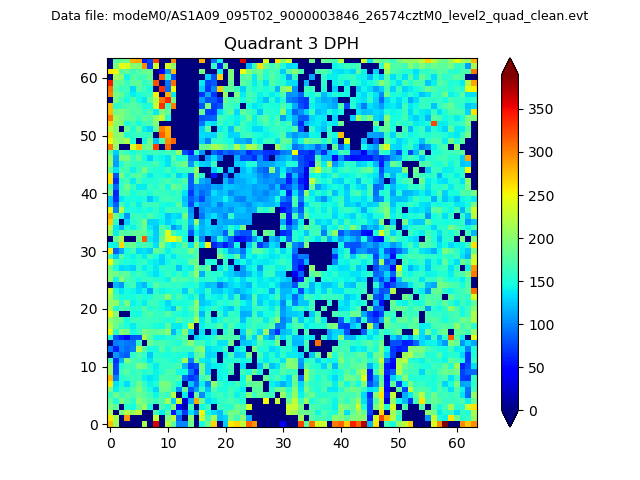 |
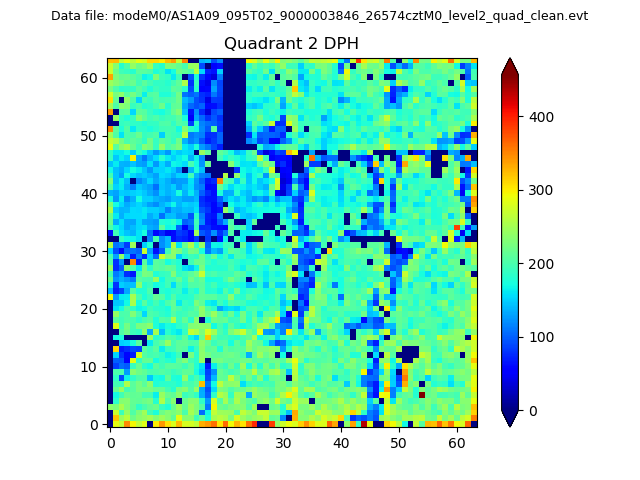 |
Quadrant C |
| Plot type | Count rate plots | Images |
|---|---|---|
| Comparison with Poisson distribution Blue bars denote a histogram of data divided into 1 sec bins. Red curve is a Poisson curve with rate = median count rate of data. |
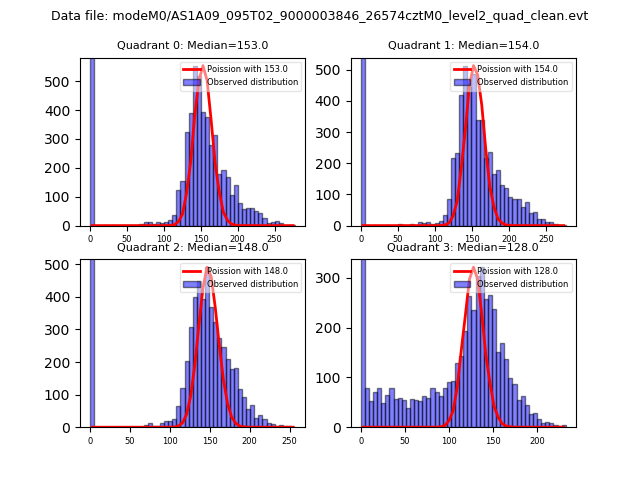 |
 |
| Quadrant-wise count rates Data is divided into 100 sec bins |
 |
|
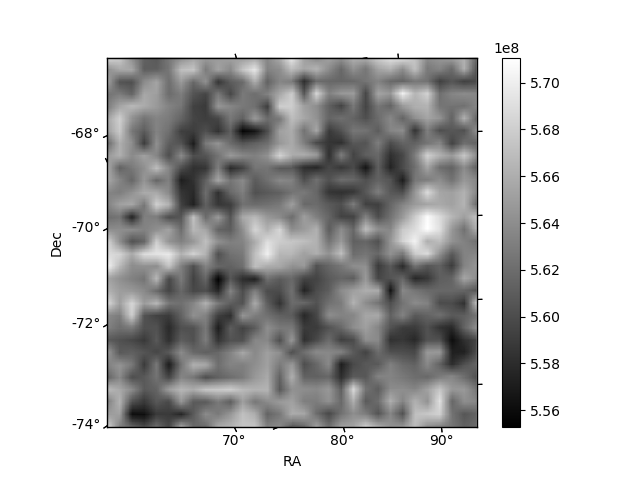
| Module-wise count rates for Quadrant A Data is divided into 100 sec bins |
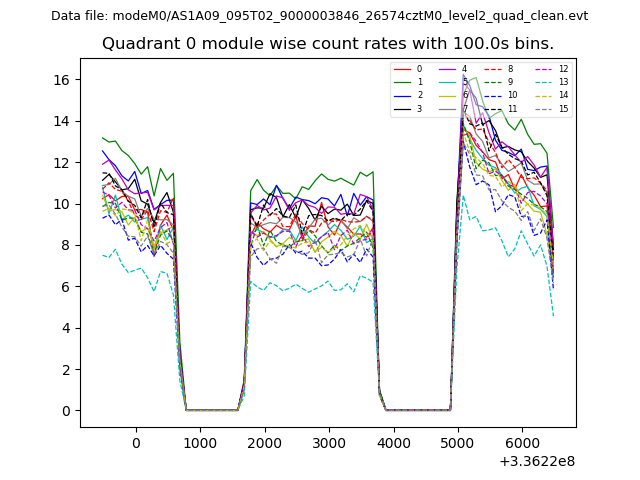 |
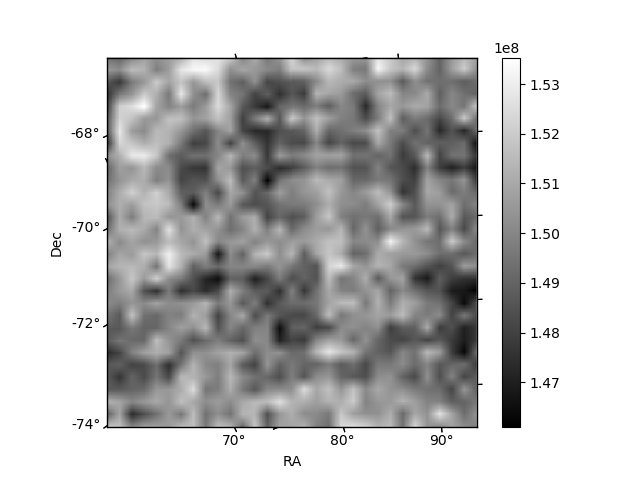 |
| Module-wise count rates for Quadrant B Data is divided into 100 sec bins |
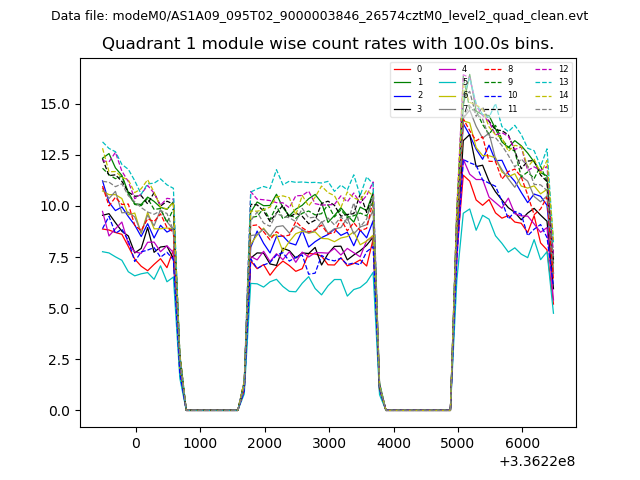 |
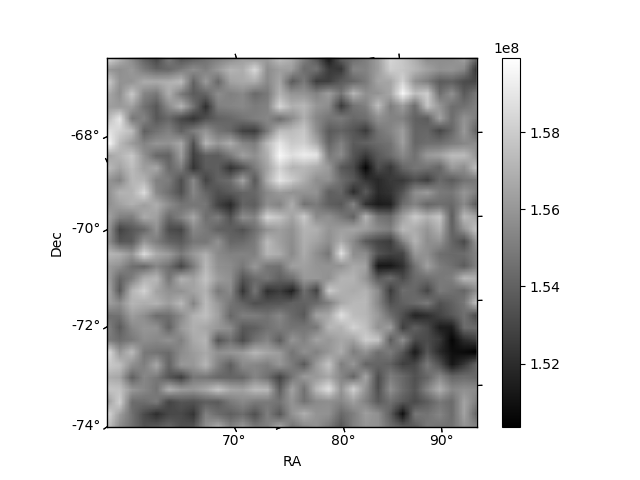 |
| Module-wise count rates for Quadrant C Data is divided into 100 sec bins |
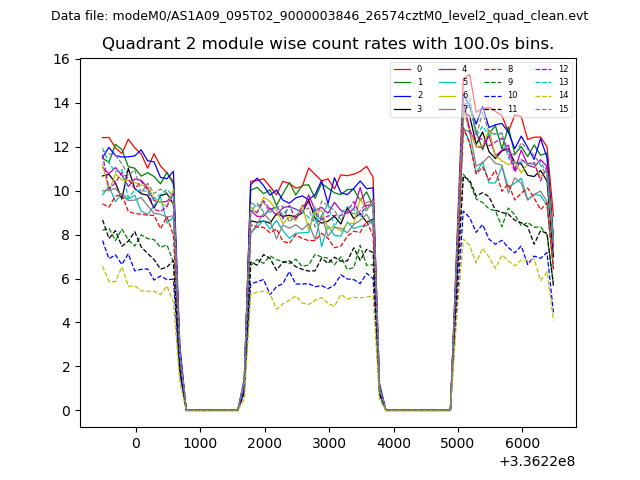 |
 |
| Module-wise count rates for Quadrant D Data is divided into 100 sec bins |
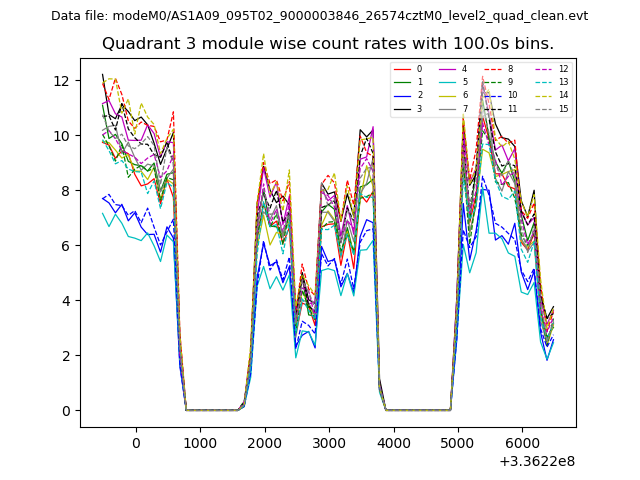 |
 |
| Parameter | Plot |
|---|---|
| CZT HV Monitor | 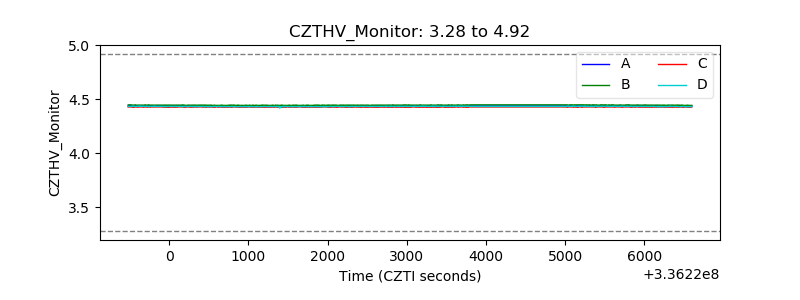 |
| D_VDD | 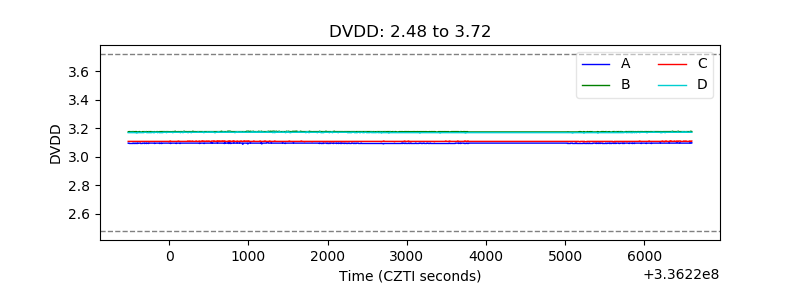 |
| Temperature 1 | 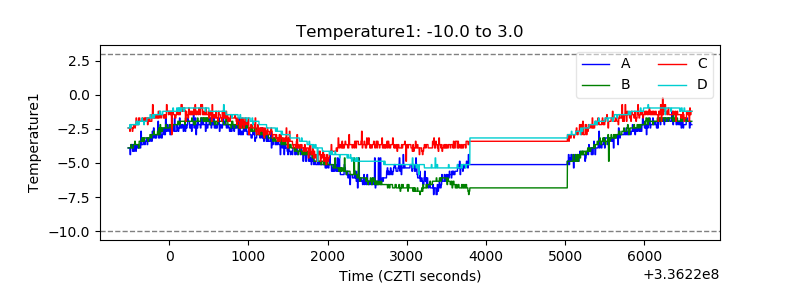 |
| Veto HV Monitor | 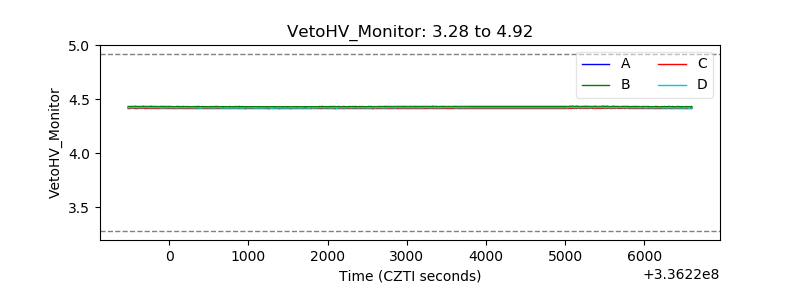 |
| Veto LLD | 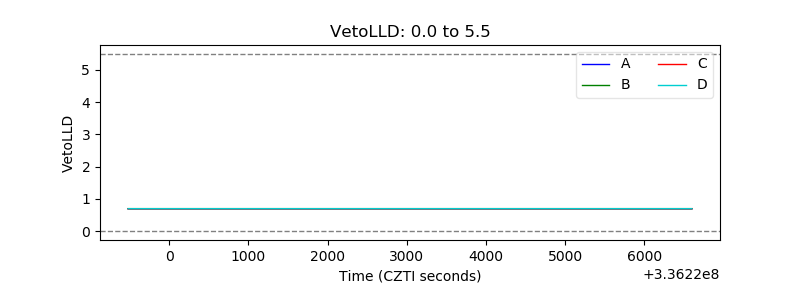 |
| Alpha Counter |  |
| _CPM_Rate |  |
| CZT Counter | 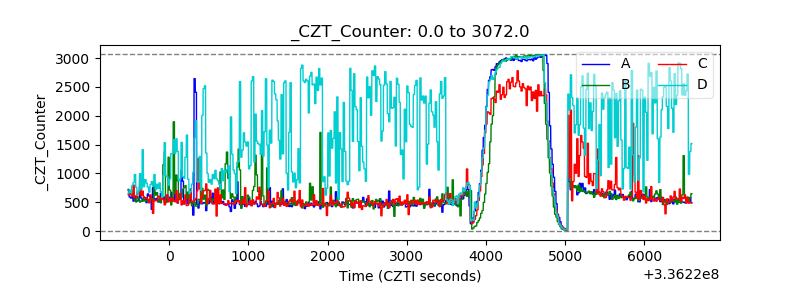 |
| +2.5 Volts monitor |  |
| +5 Volts monitor |  |
| _ROLL_ROT |  |
| _Roll_DEC | 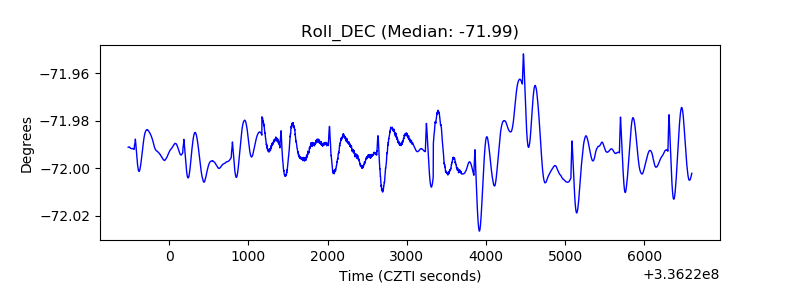 |
| _Roll_RA | 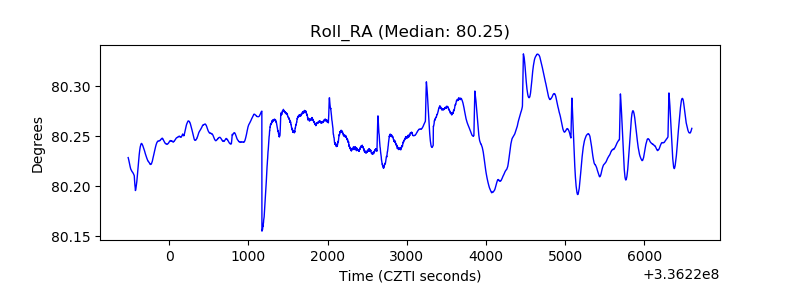 |
| Veto Counter | 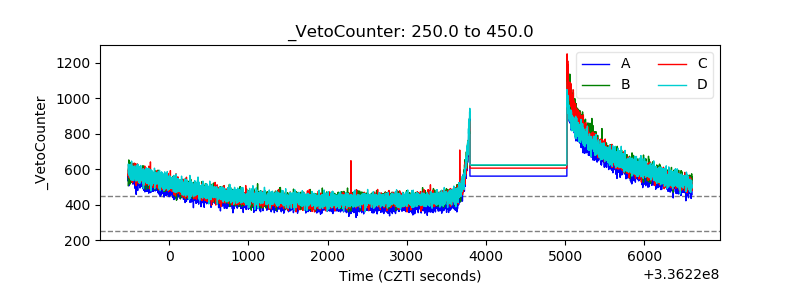 |