| Param | Original file | Final file |
|---|---|---|
| Filename | modeM0/AS1A09_095T02_9000003846_26575cztM0_level2.evt | modeM0/AS1A09_095T02_9000003846_26575cztM0_level2_quad_clean.evt |
| Size (bytes) | 678,600,000 | 98,982,720 |
| Size | 647.2 MB | 94.4 MB |
| Events in quadrant A | 3,162,408 | 713,545 |
| Events in quadrant B | 3,379,467 | 717,436 |
| Events in quadrant C | 3,279,604 | 677,806 |
| Events in quadrant D | 10,334,712 | 479,564 |
| Mode M9 | |||
|---|---|---|---|
| Quadrant | BADHDUFLAG | Total packets | Discarded packets |
| A | 0 | 13 | 0 |
| B | 0 | 13 | 0 |
| C | 0 | 13 | 0 |
| D | 0 | 13 | 0 |
| Mode M0 | |||
|---|---|---|---|
| Quadrant | BADHDUFLAG | Total packets | Discarded packets |
| A | 0 | 12998 | 0 |
| B | 0 | 13722 | 0 |
| C | 0 | 13489 | 0 |
| D | 0 | 34730 | 0 |
| Quadrant | Total seconds | Saturated seconds | Saturation percentage |
|---|---|---|---|
| A | 5845 | 64 | 1.094953% |
| B | 5846 | 89 | 1.522408% |
| C | 5846 | 106 | 1.813206% |
| D | 5845 | 2973 | 50.863986% |
Noise dominated data is calculated using 1-second bins in cleaned event files. If a bin has >2000 counts, and if more than 50% of those come from <1% of pixels, then it is considered to be noise-dominated and hence unusable.
| Quadrant | # 1 sec bins | Bins with >0 counts | Bins with >2000 counts | High rate bins dominated by noise | Noise dominated (total time) | Noise dominated (detector-on time) | Marked lightcurve |
|---|---|---|---|---|---|---|---|
| A | 7155 | 5845 | 1 | 1 | 0.01% | 0.02% | 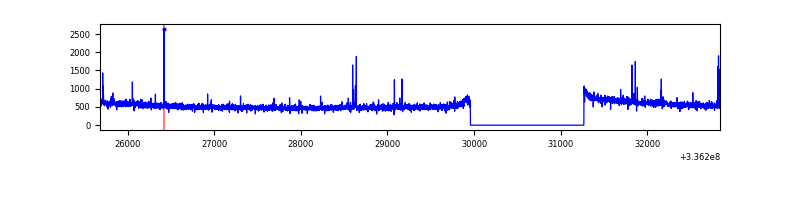 |
| B | 7156 | 5846 | 16 | 16 | 0.22% | 0.27% | 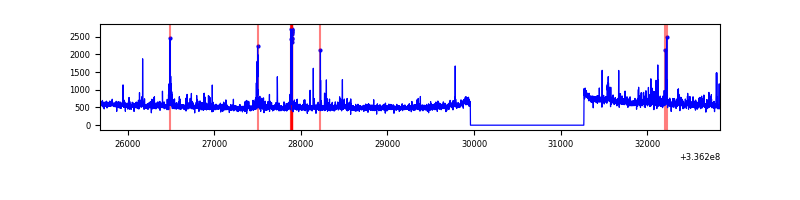 |
| C | 7156 | 5846 | 7 | 7 | 0.10% | 0.12% | 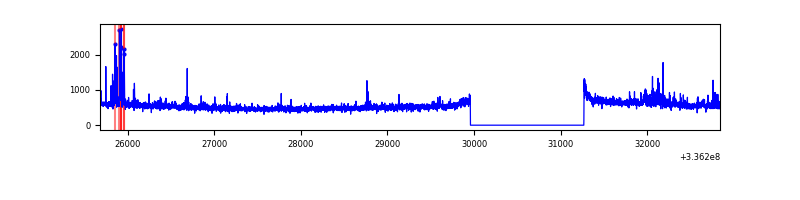 |
| D | 7154 | 5844 | 2616 | 2616 | 36.57% | 44.76% | 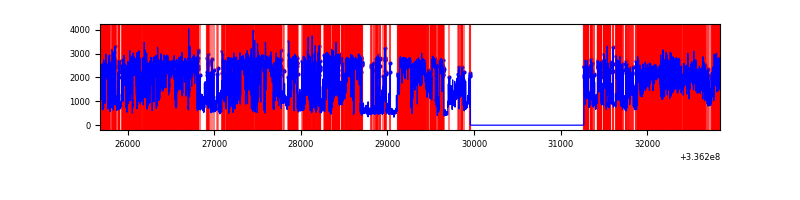 |
Top three noisy pixels from each quadrant. If the there are fewer than three noisy pixels in the level2.evt file, extra rows are filled as -1
| Pixel properties | Quadrant properties | ||||||
|---|---|---|---|---|---|---|---|
| Quadrant | DetID | PixID | Counts | Sigma | Mean | Median | Sigma |
| A | 0 | 13 | 35744 | 224.43 | 805 | 793 | 155.7 |
| A | 12 | 96 | 10362 | 61.45 | 805 | 793 | 155.7 |
| A | 13 | 254 | 9002 | 52.71 | 805 | 793 | 155.7 |
| B | 3 | 112 | 155533 | 1073.38 | 790 | 774 | 144.2 |
| B | 3 | 64 | 82099 | 564.05 | 790 | 774 | 144.2 |
| B | 0 | 245 | 18915 | 125.82 | 790 | 774 | 144.2 |
| C | 3 | 233 | 149920 | 865.8 | 753 | 760 | 172.3 |
| C | 14 | 238 | 125316 | 722.98 | 753 | 760 | 172.3 |
| C | 4 | 254 | 65152 | 373.76 | 753 | 760 | 172.3 |
| D | 7 | 80 | 6285483 | 44969.63 | 585 | 571 | 139.8 |
| D | 1 | 52 | 1488032 | 10643.04 | 585 | 571 | 139.8 |
| D | 12 | 233 | 178741 | 1274.84 | 585 | 571 | 139.8 |
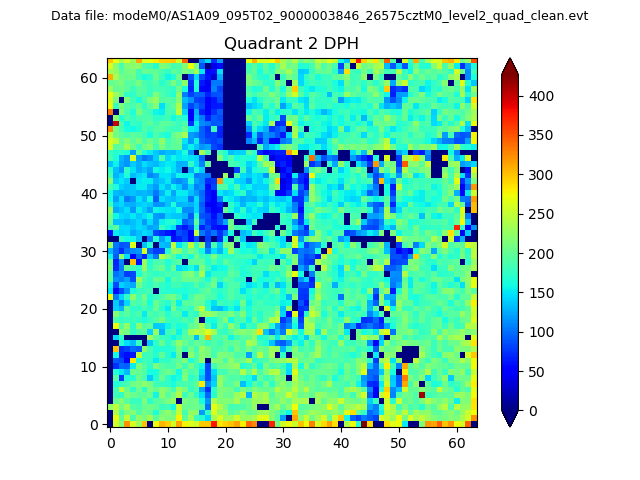
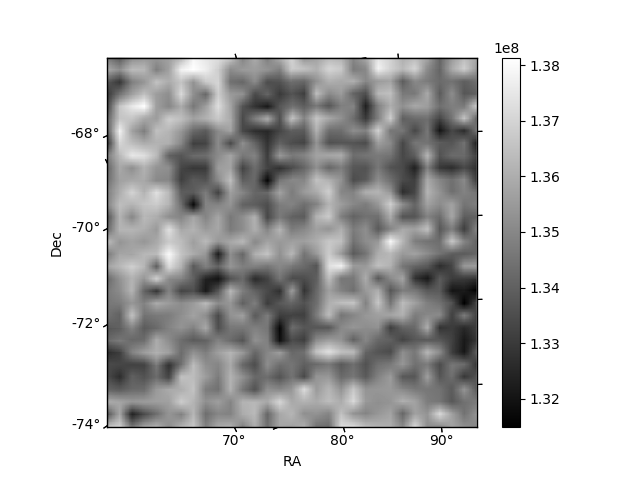
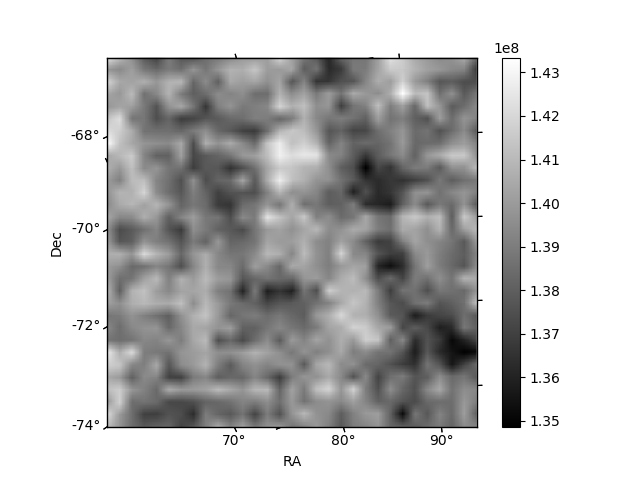
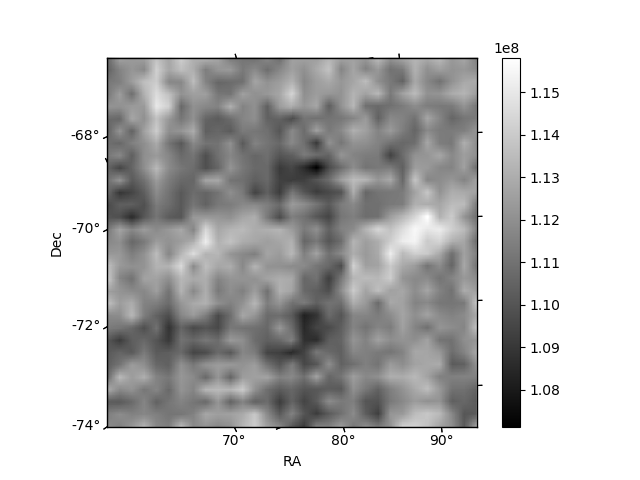
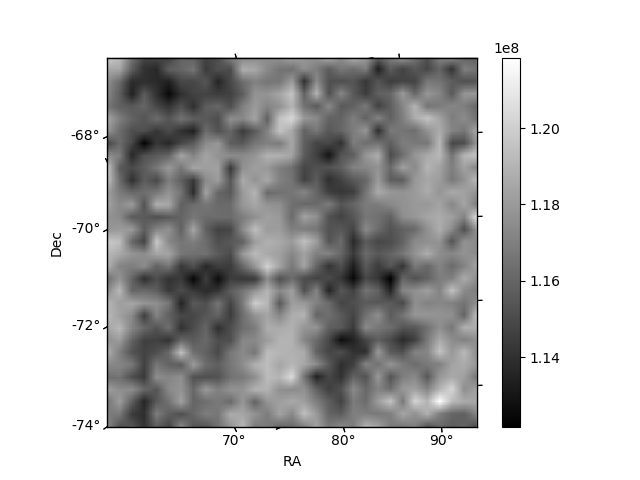
Histogram calculated using DETX and DETY for each event in the final _common_clean file
| Quadrant A | 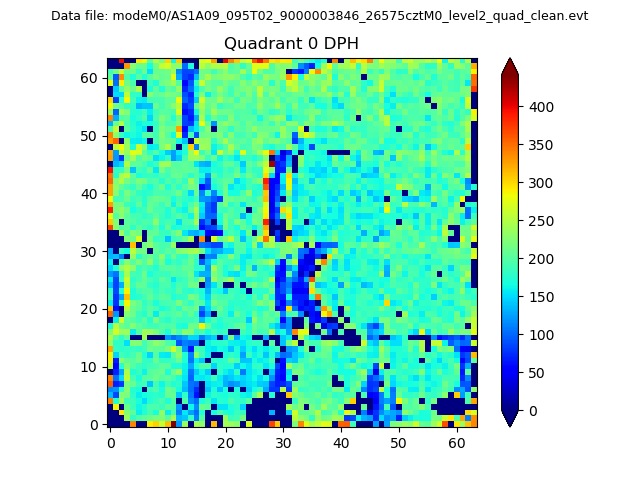 |
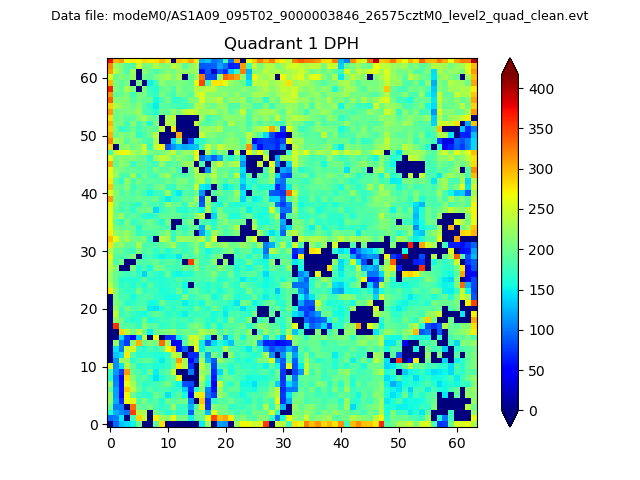 |
Quadrant B |
|---|---|---|---|
| Quadrant D | 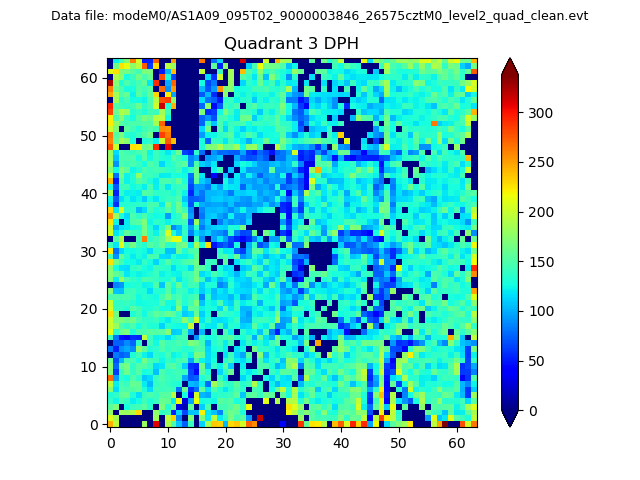 |
 |
Quadrant C |
| Plot type | Count rate plots | Images |
|---|---|---|
| Comparison with Poisson distribution Blue bars denote a histogram of data divided into 1 sec bins. Red curve is a Poisson curve with rate = median count rate of data. |
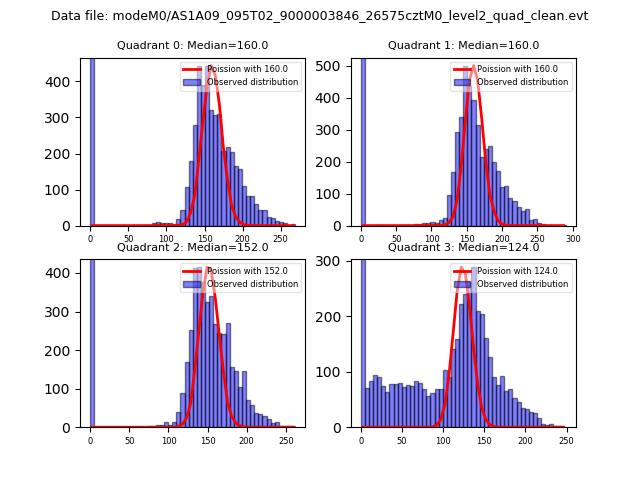 |
 |
| Quadrant-wise count rates Data is divided into 100 sec bins |
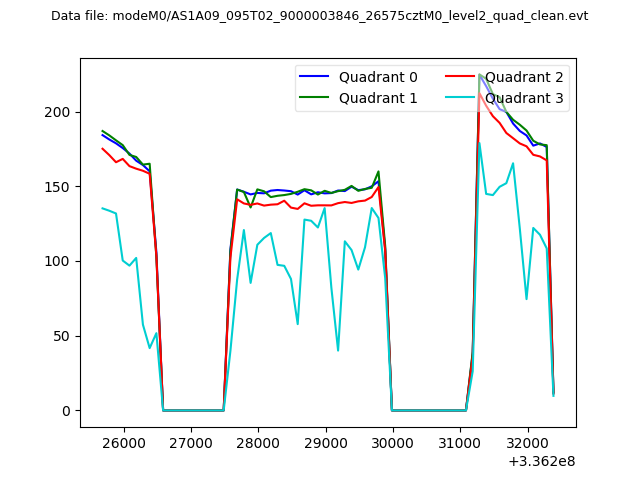 |
|
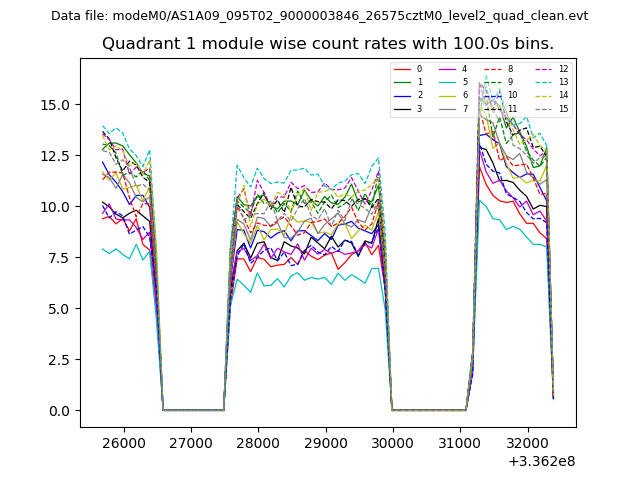
| Module-wise count rates for Quadrant A Data is divided into 100 sec bins |
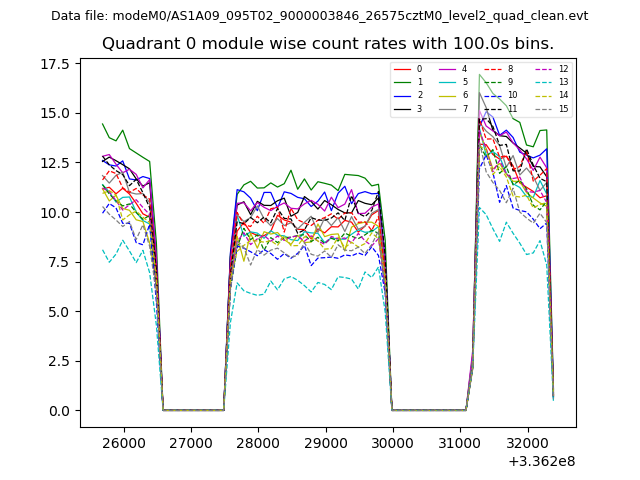 |
 |
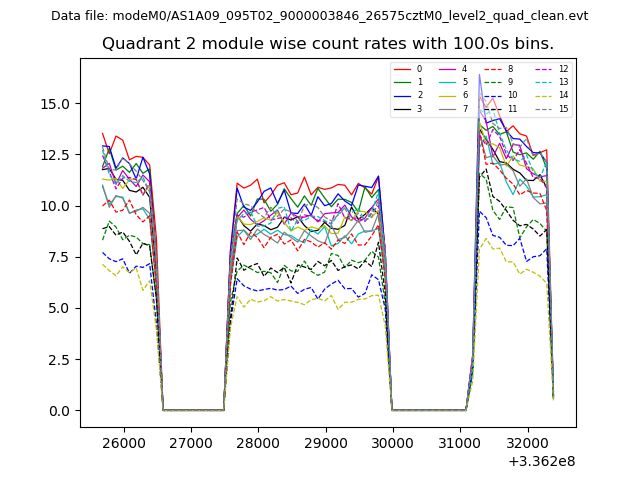
| Module-wise count rates for Quadrant B Data is divided into 100 sec bins |
 |
 |
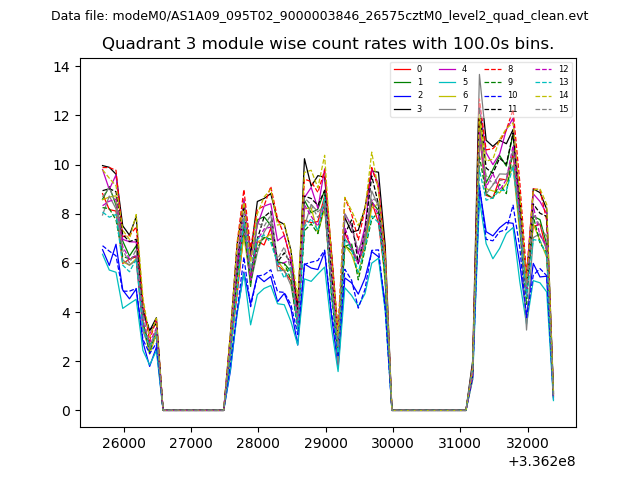
| Module-wise count rates for Quadrant C Data is divided into 100 sec bins |
 |
 |
| Module-wise count rates for Quadrant D Data is divided into 100 sec bins |
 |
 |
| Parameter | Plot |
|---|---|
| CZT HV Monitor | 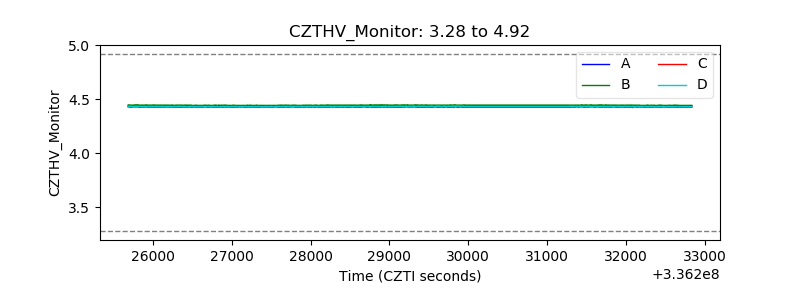 |
| D_VDD | 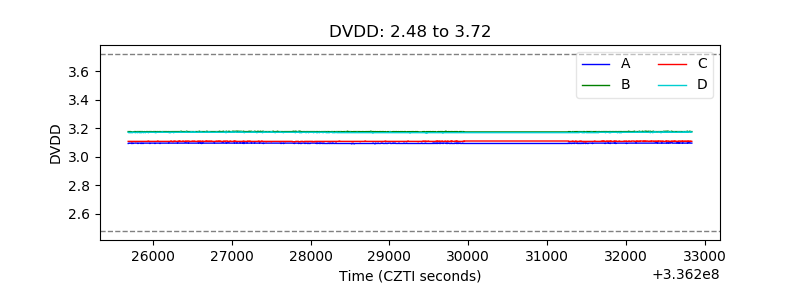 |
| Temperature 1 | 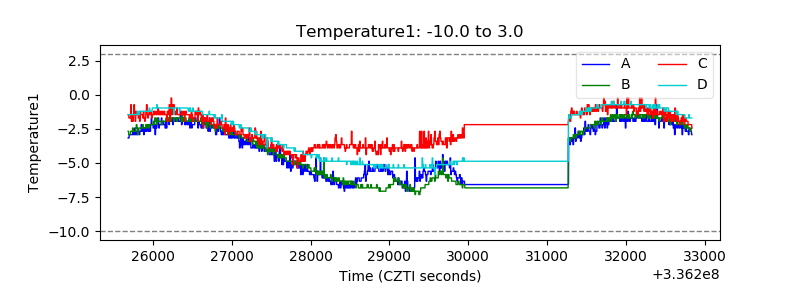 |
| Veto HV Monitor | 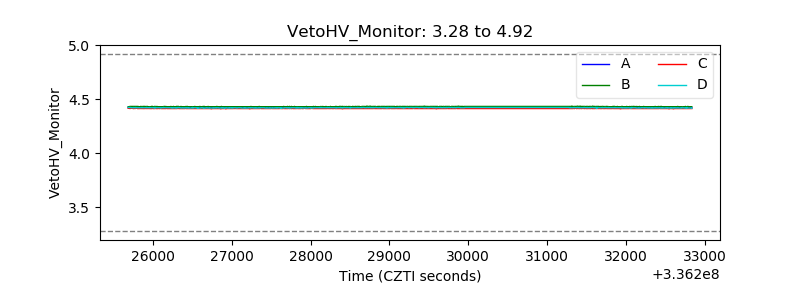 |
| Veto LLD | 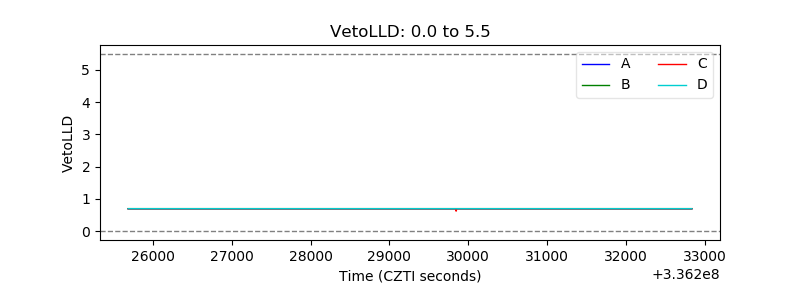 |
| Alpha Counter | 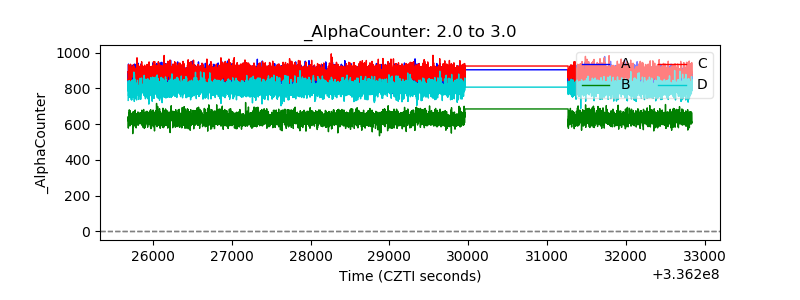 |
| _CPM_Rate |  |
| CZT Counter | 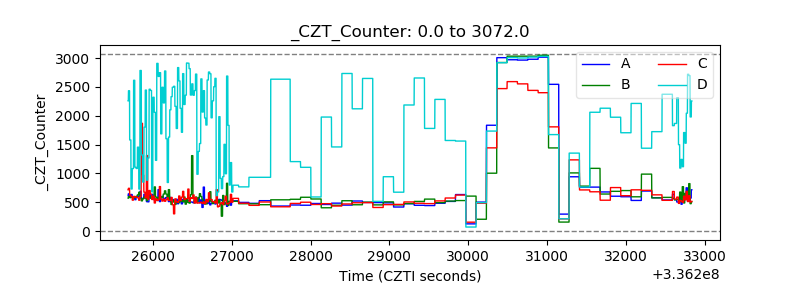 |
| +2.5 Volts monitor |  |
| +5 Volts monitor |  |
| _ROLL_ROT | 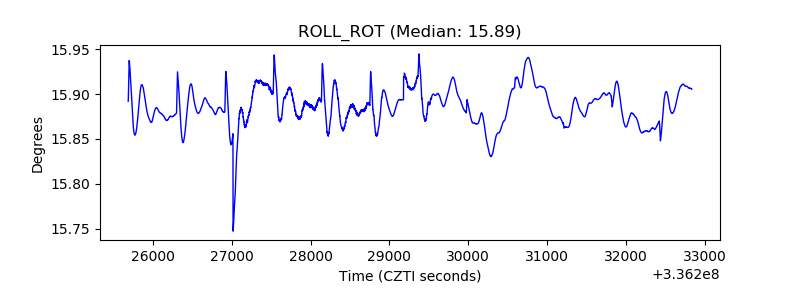 |
| _Roll_DEC | 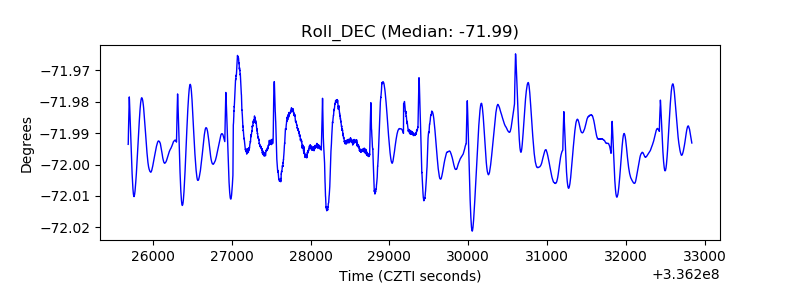 |
| _Roll_RA | 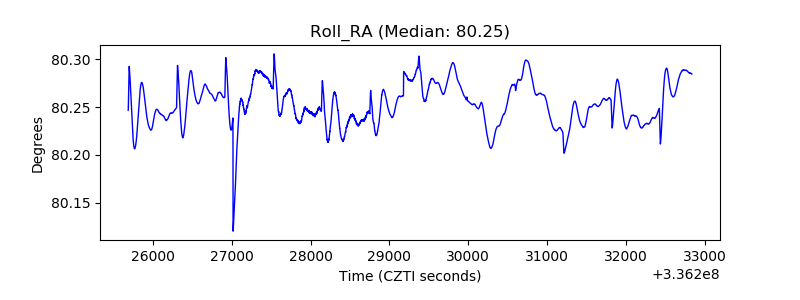 |
| Veto Counter | 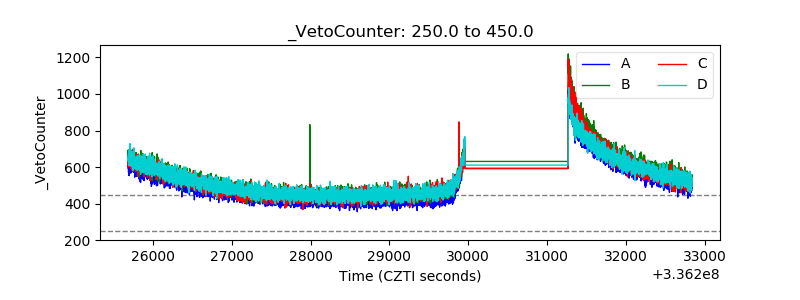 |