| Param | Original file | Final file |
|---|---|---|
| Filename | modeM0/AS1A09_095T02_9000003846_26576cztM0_level2.evt | modeM0/AS1A09_095T02_9000003846_26576cztM0_level2_quad_clean.evt |
| Size (bytes) | 666,558,720 | 86,019,840 |
| Size | 635.7 MB | 82.0 MB |
| Events in quadrant A | 3,162,576 | 627,521 |
| Events in quadrant B | 3,966,411 | 623,577 |
| Events in quadrant C | 3,125,675 | 595,169 |
| Events in quadrant D | 9,543,139 | 355,707 |
| Mode M9 | |||
|---|---|---|---|
| Quadrant | BADHDUFLAG | Total packets | Discarded packets |
| A | 0 | 13 | 0 |
| B | 0 | 13 | 0 |
| C | 0 | 13 | 0 |
| D | 0 | 13 | 0 |
| Mode M0 | |||
|---|---|---|---|
| Quadrant | BADHDUFLAG | Total packets | Discarded packets |
| A | 0 | 12892 | 0 |
| B | 0 | 15592 | 0 |
| C | 0 | 12875 | 0 |
| D | 0 | 32408 | 0 |
| Quadrant | Total seconds | Saturated seconds | Saturation percentage |
|---|---|---|---|
| A | 5744 | 105 | 1.827994% |
| B | 5745 | 287 | 4.995648% |
| C | 5745 | 103 | 1.792863% |
| D | 5745 | 2750 | 47.867711% |
Noise dominated data is calculated using 1-second bins in cleaned event files. If a bin has >2000 counts, and if more than 50% of those come from <1% of pixels, then it is considered to be noise-dominated and hence unusable.
| Quadrant | # 1 sec bins | Bins with >0 counts | Bins with >2000 counts | High rate bins dominated by noise | Noise dominated (total time) | Noise dominated (detector-on time) | Marked lightcurve |
|---|---|---|---|---|---|---|---|
| A | 7084 | 5744 | 11 | 11 | 0.16% | 0.19% | 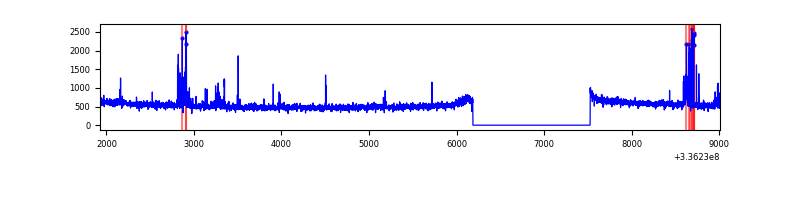 |
| B | 7085 | 5745 | 152 | 152 | 2.15% | 2.65% | 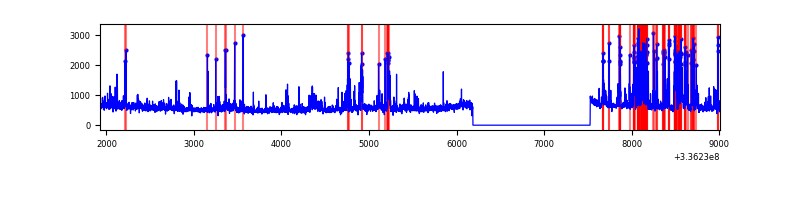 |
| C | 7085 | 5745 | 1 | 1 | 0.01% | 0.02% | 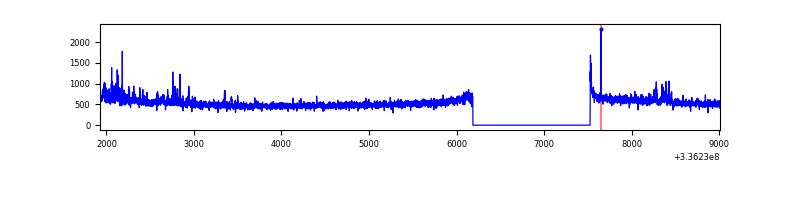 |
| D | 7085 | 5745 | 2401 | 2401 | 33.89% | 41.79% | 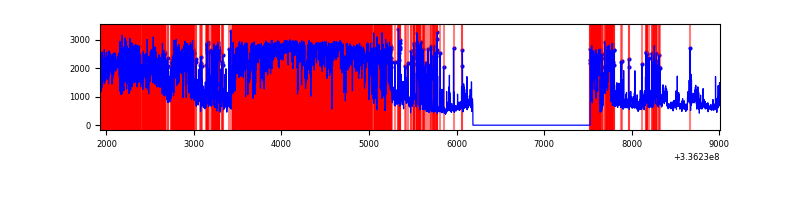 |
Top three noisy pixels from each quadrant. If the there are fewer than three noisy pixels in the level2.evt file, extra rows are filled as -1
| Pixel properties | Quadrant properties | ||||||
|---|---|---|---|---|---|---|---|
| Quadrant | DetID | PixID | Counts | Sigma | Mean | Median | Sigma |
| A | 8 | 144 | 65506 | 422.7 | 783 | 771 | 153.1 |
| A | 0 | 13 | 46030 | 295.53 | 783 | 771 | 153.1 |
| A | 12 | 96 | 26608 | 168.71 | 783 | 771 | 153.1 |
| B | 3 | 64 | 721077 | 5186.67 | 762 | 747 | 138.9 |
| B | 3 | 112 | 162786 | 1166.75 | 762 | 747 | 138.9 |
| B | 0 | 189 | 37140 | 262.04 | 762 | 747 | 138.9 |
| C | 3 | 233 | 135220 | 804.25 | 733 | 739 | 167.2 |
| C | 14 | 238 | 122171 | 726.21 | 733 | 739 | 167.2 |
| C | 14 | 176 | 10480 | 58.25 | 733 | 739 | 167.2 |
| D | 7 | 80 | 6096414 | 45923.32 | 554 | 537 | 132.7 |
| D | 1 | 52 | 930853 | 7008.54 | 554 | 537 | 132.7 |
| D | 12 | 233 | 234345 | 1761.39 | 554 | 537 | 132.7 |
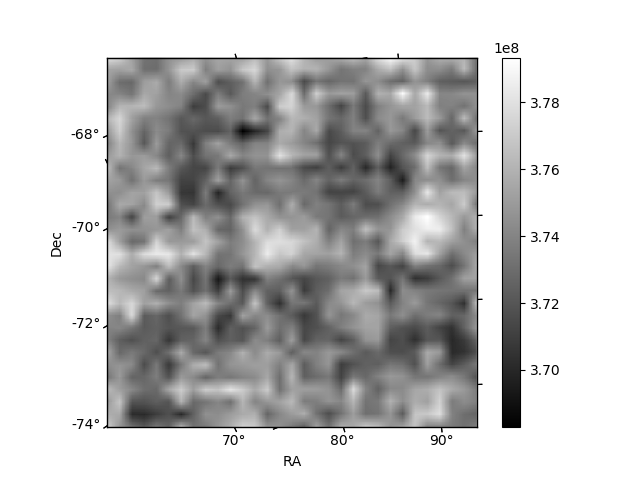
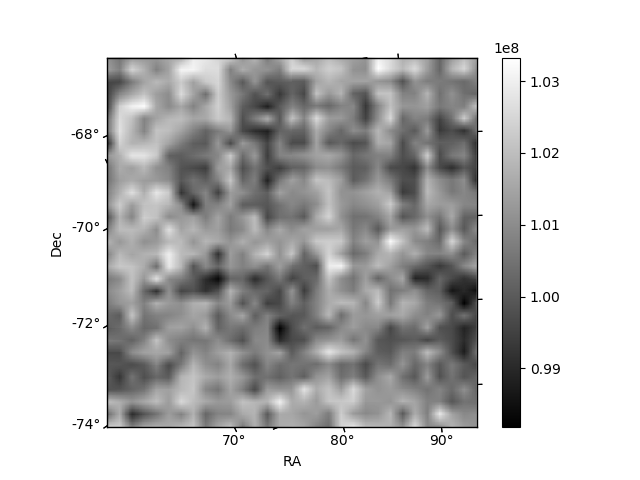
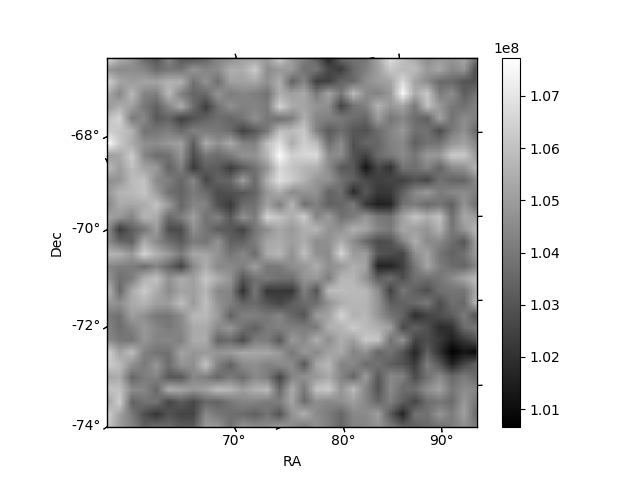
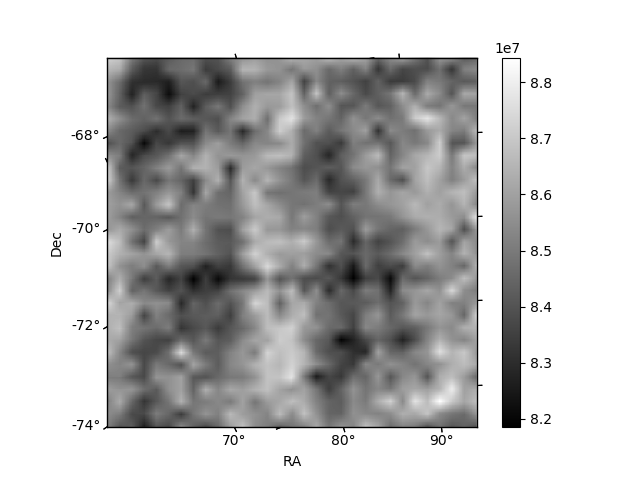
Histogram calculated using DETX and DETY for each event in the final _common_clean file
| Quadrant A | 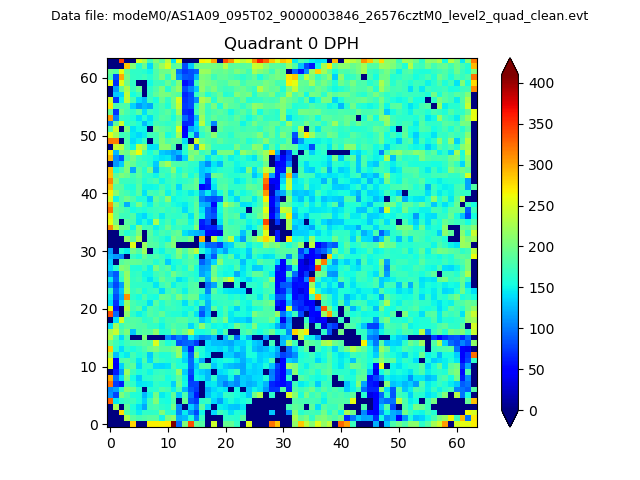 |
 |
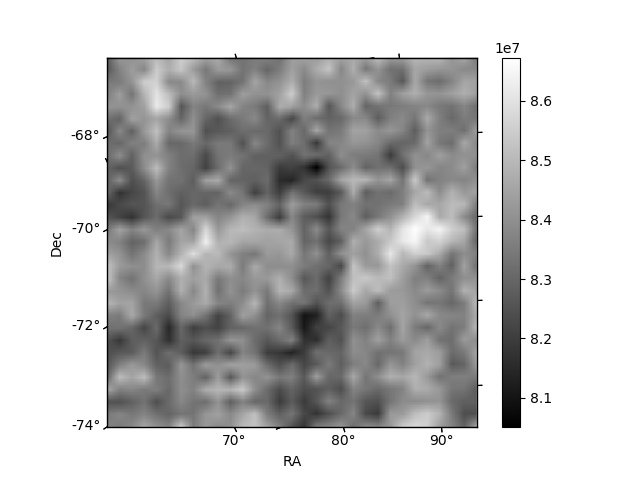
Quadrant B |
|---|---|---|---|
| Quadrant D | 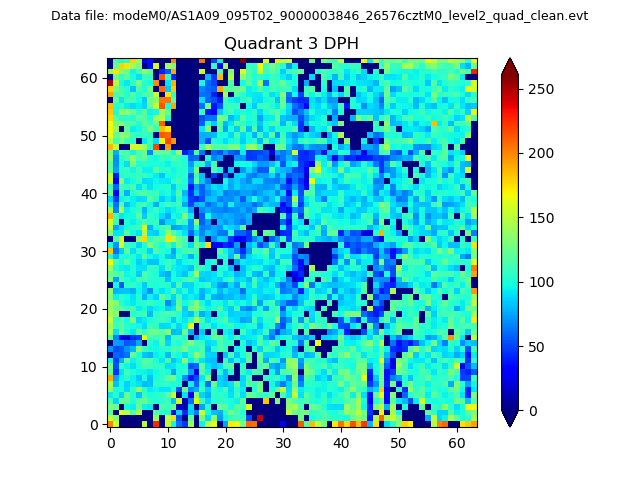 |
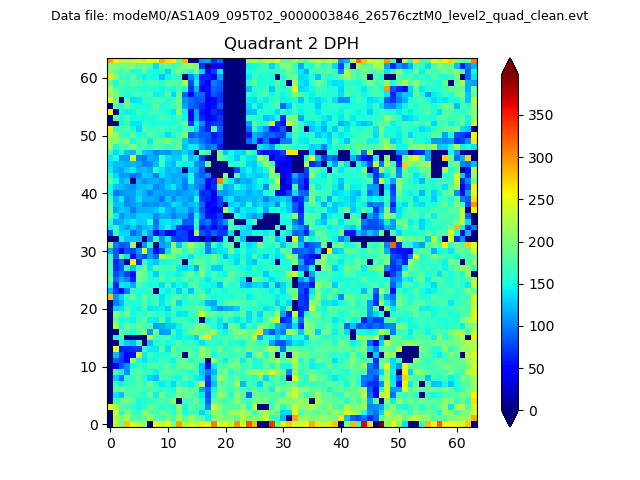 |
Quadrant C |
| Plot type | Count rate plots | Images |
|---|---|---|
| Comparison with Poisson distribution Blue bars denote a histogram of data divided into 1 sec bins. Red curve is a Poisson curve with rate = median count rate of data. |
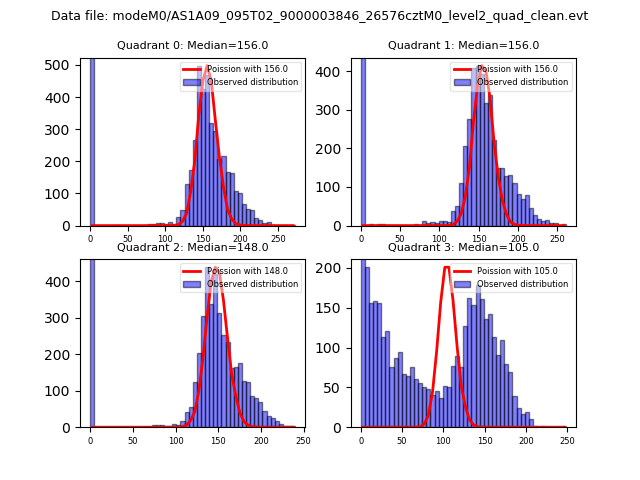 |
 |
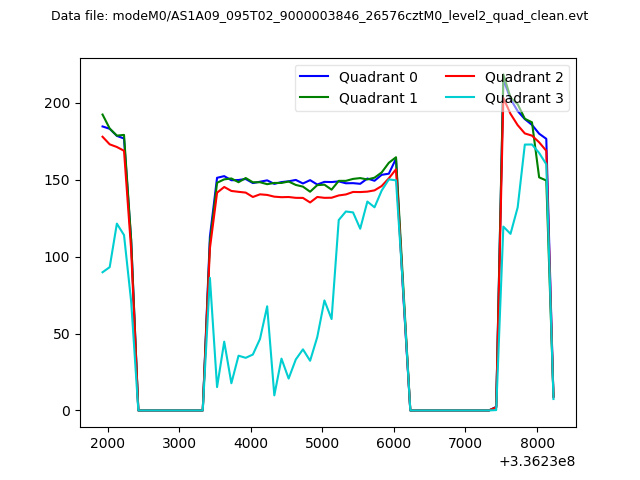
| Quadrant-wise count rates Data is divided into 100 sec bins |
 |
|
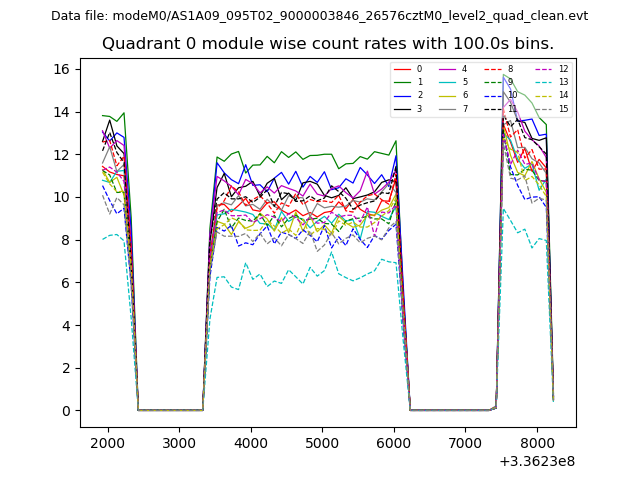
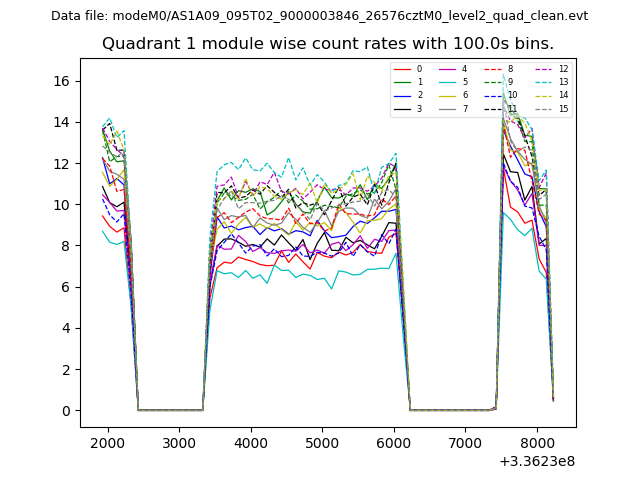
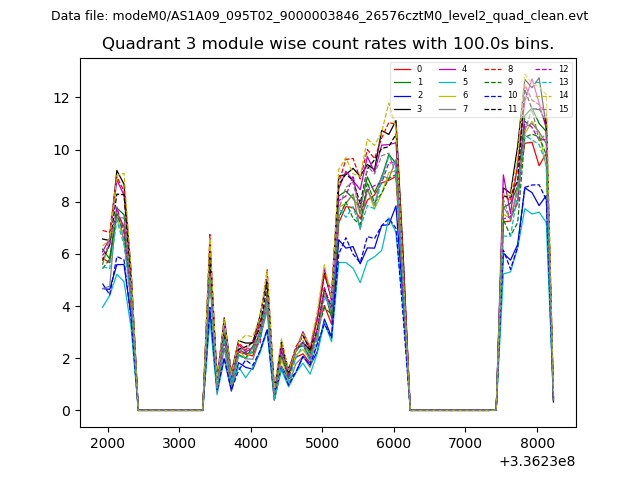
| Module-wise count rates for Quadrant A Data is divided into 100 sec bins |
 |
 |
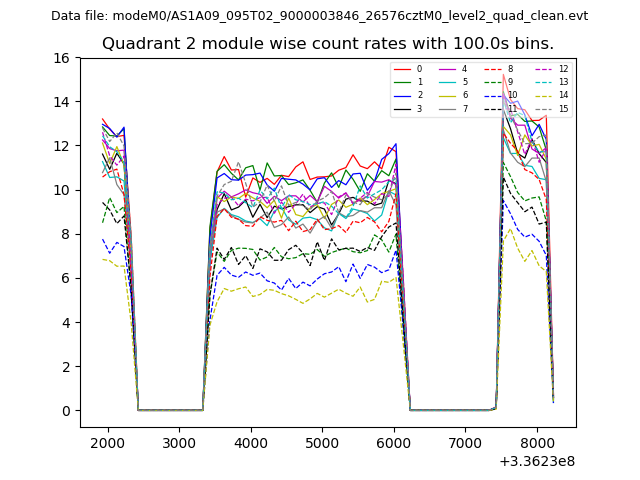
| Module-wise count rates for Quadrant B Data is divided into 100 sec bins |
 |
 |
| Module-wise count rates for Quadrant C Data is divided into 100 sec bins |
 |
 |
| Module-wise count rates for Quadrant D Data is divided into 100 sec bins |
 |
 |
| Parameter | Plot |
|---|---|
| CZT HV Monitor | 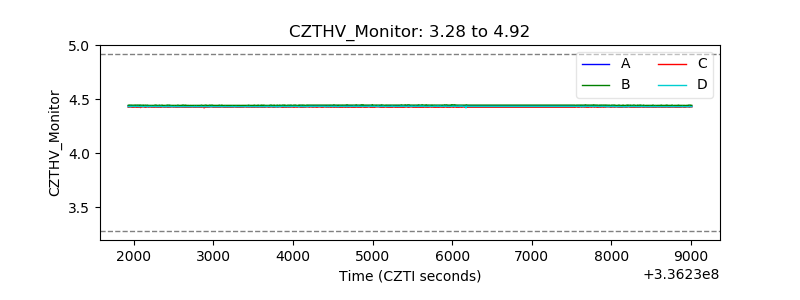 |
| D_VDD | 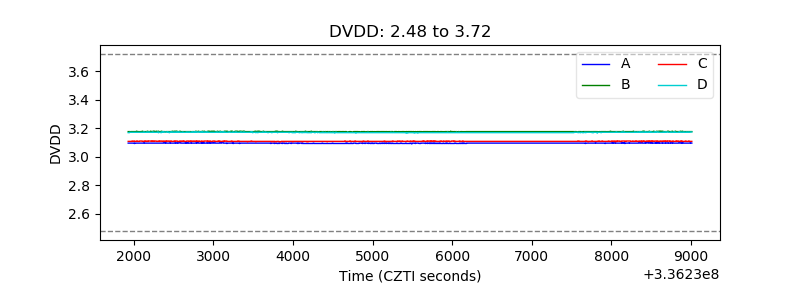 |
| Temperature 1 | 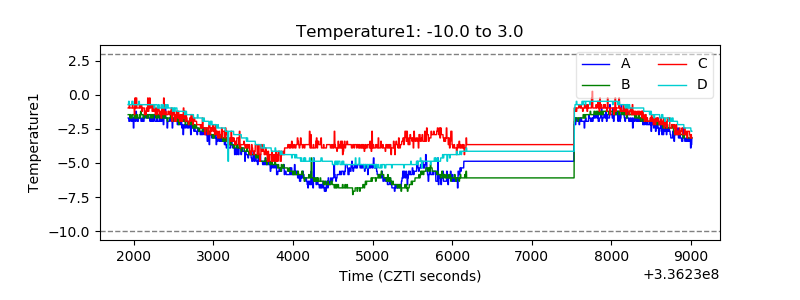 |
| Veto HV Monitor | 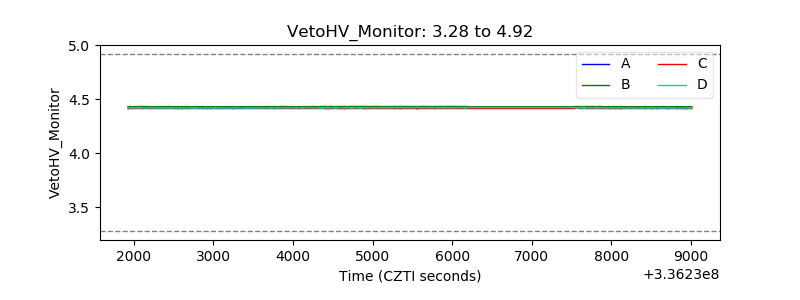 |
| Veto LLD | 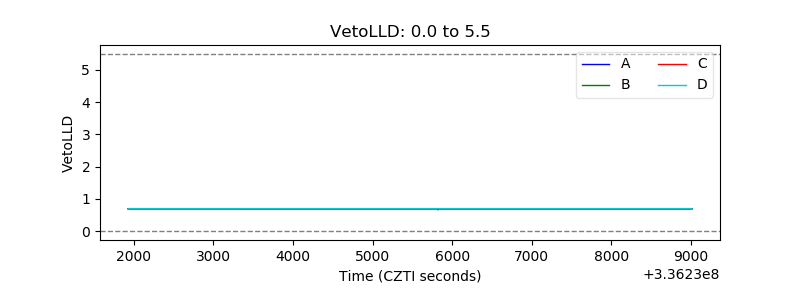 |
| Alpha Counter | 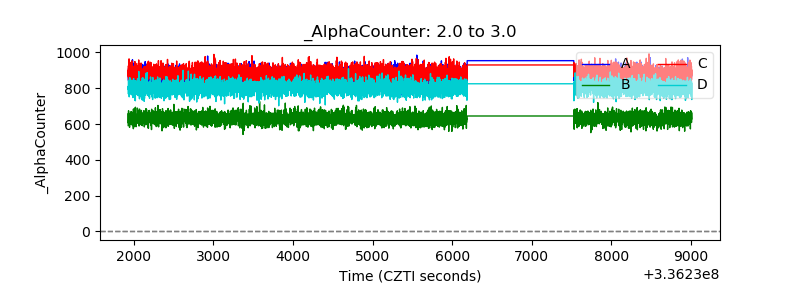 |
| _CPM_Rate |  |
| CZT Counter | 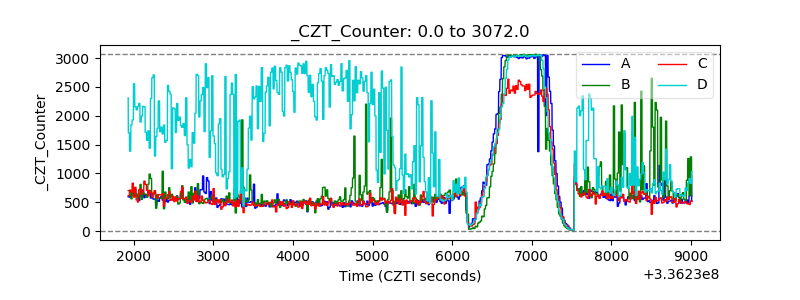 |
| +2.5 Volts monitor | 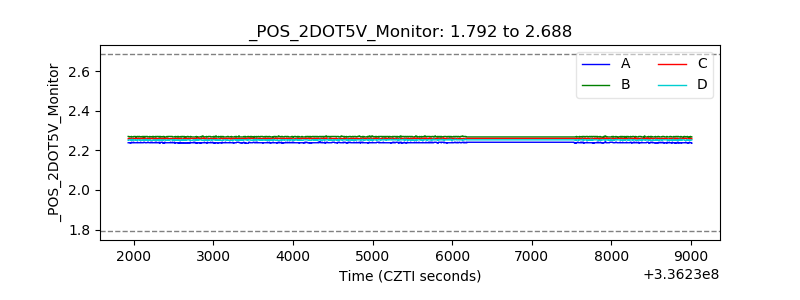 |
| +5 Volts monitor |  |
| _ROLL_ROT | 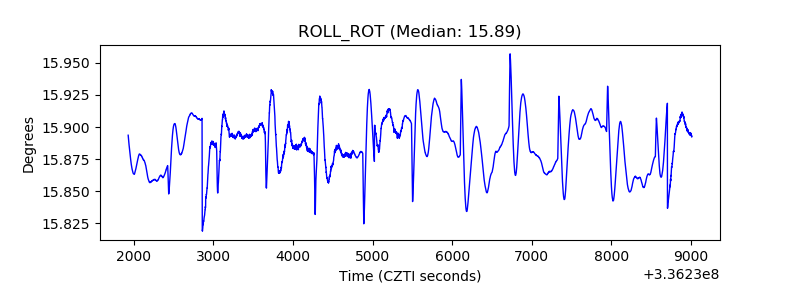 |
| _Roll_DEC | 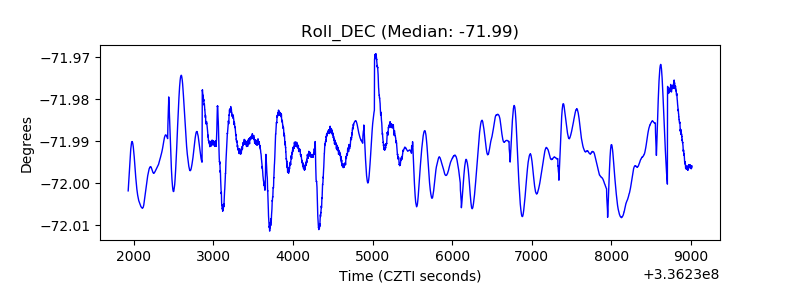 |
| _Roll_RA | 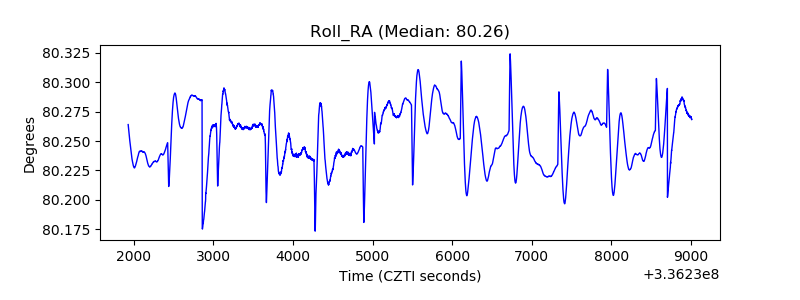 |
| Veto Counter |  |