| Param | Original file | Final file |
|---|---|---|
| Filename | modeM0/AS1A09_095T02_9000003846_26577cztM0_level2.evt | modeM0/AS1A09_095T02_9000003846_26577cztM0_level2_quad_clean.evt |
| Size (bytes) | 615,196,800 | 77,754,240 |
| Size | 586.7 MB | 74.2 MB |
| Events in quadrant A | 3,032,866 | 532,439 |
| Events in quadrant B | 3,851,390 | 535,352 |
| Events in quadrant C | 3,029,061 | 504,430 |
| Events in quadrant D | 8,334,675 | 385,348 |
| Mode M9 | |||
|---|---|---|---|
| Quadrant | BADHDUFLAG | Total packets | Discarded packets |
| A | 0 | 12 | 0 |
| B | 0 | 12 | 0 |
| C | 0 | 12 | 0 |
| D | 0 | 12 | 0 |
| Mode M0 | |||
|---|---|---|---|
| Quadrant | BADHDUFLAG | Total packets | Discarded packets |
| A | 0 | 12449 | 0 |
| B | 0 | 15002 | 0 |
| C | 0 | 12439 | 0 |
| D | 0 | 28754 | 0 |
| Quadrant | Total seconds | Saturated seconds | Saturation percentage |
|---|---|---|---|
| A | 5663 | 95 | 1.677556% |
| B | 5664 | 305 | 5.384887% |
| C | 5664 | 111 | 1.959746% |
| D | 5664 | 1725 | 30.455508% |
Noise dominated data is calculated using 1-second bins in cleaned event files. If a bin has >2000 counts, and if more than 50% of those come from <1% of pixels, then it is considered to be noise-dominated and hence unusable.
| Quadrant | # 1 sec bins | Bins with >0 counts | Bins with >2000 counts | High rate bins dominated by noise | Noise dominated (total time) | Noise dominated (detector-on time) | Marked lightcurve |
|---|---|---|---|---|---|---|---|
| A | 6943 | 5663 | 13 | 13 | 0.19% | 0.23% | 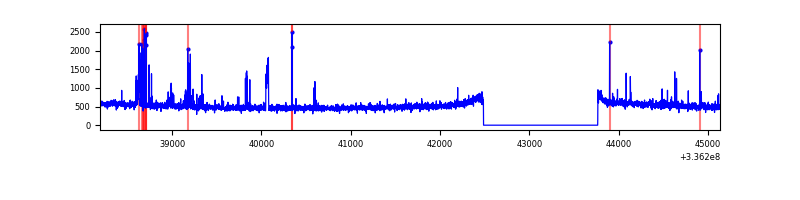 |
| B | 6944 | 5664 | 119 | 119 | 1.71% | 2.10% | 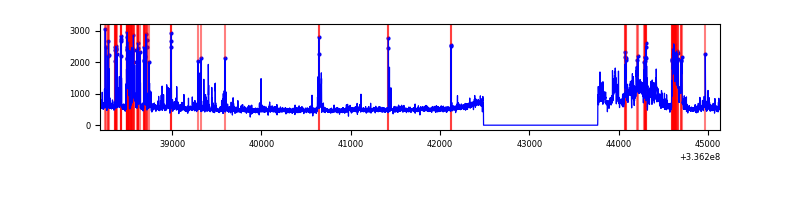 |
| C | 6944 | 5664 | 3 | 3 | 0.04% | 0.05% | 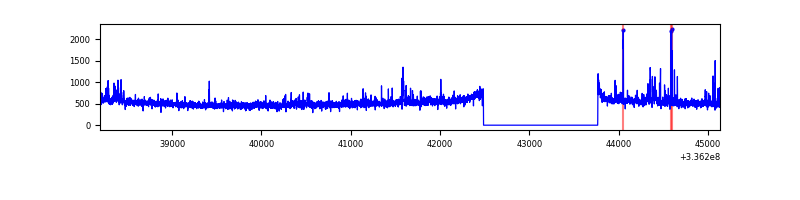 |
| D | 6944 | 5664 | 1493 | 1493 | 21.50% | 26.36% | 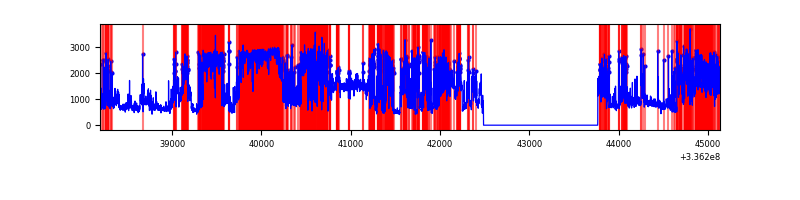 |
Top three noisy pixels from each quadrant. If the there are fewer than three noisy pixels in the level2.evt file, extra rows are filled as -1
| Pixel properties | Quadrant properties | ||||||
|---|---|---|---|---|---|---|---|
| Quadrant | DetID | PixID | Counts | Sigma | Mean | Median | Sigma |
| A | 8 | 144 | 135831 | 915.0 | 743 | 731 | 147.7 |
| A | 12 | 96 | 26528 | 174.72 | 743 | 731 | 147.7 |
| A | 13 | 254 | 8970 | 55.8 | 743 | 731 | 147.7 |
| B | 3 | 64 | 815874 | 6136.15 | 730 | 715 | 132.8 |
| B | 3 | 112 | 73928 | 551.11 | 730 | 715 | 132.8 |
| B | 0 | 189 | 62572 | 465.63 | 730 | 715 | 132.8 |
| C | 3 | 233 | 128993 | 800.45 | 701 | 707 | 160.3 |
| C | 14 | 238 | 116568 | 722.92 | 701 | 707 | 160.3 |
| C | 14 | 176 | 47554 | 292.31 | 701 | 707 | 160.3 |
| D | 7 | 80 | 4273892 | 28323.59 | 625 | 608 | 150.9 |
| D | 1 | 52 | 1269204 | 8408.33 | 625 | 608 | 150.9 |
| D | 2 | 250 | 288649 | 1909.15 | 625 | 608 | 150.9 |
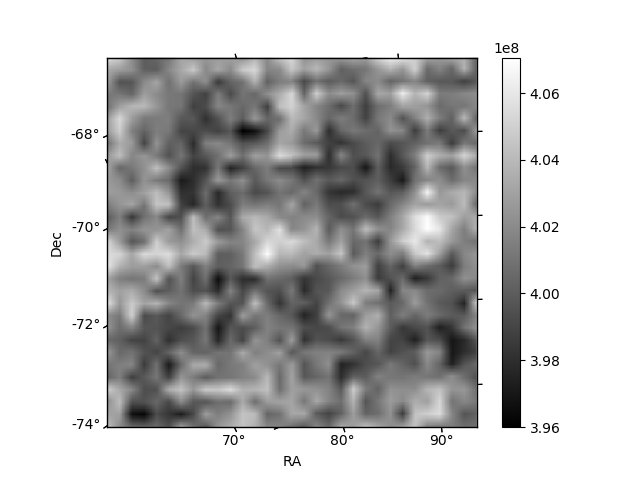
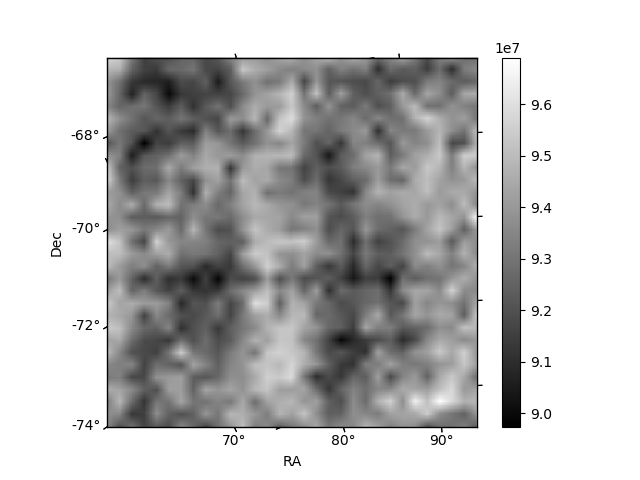
Histogram calculated using DETX and DETY for each event in the final _common_clean file
| Quadrant A | 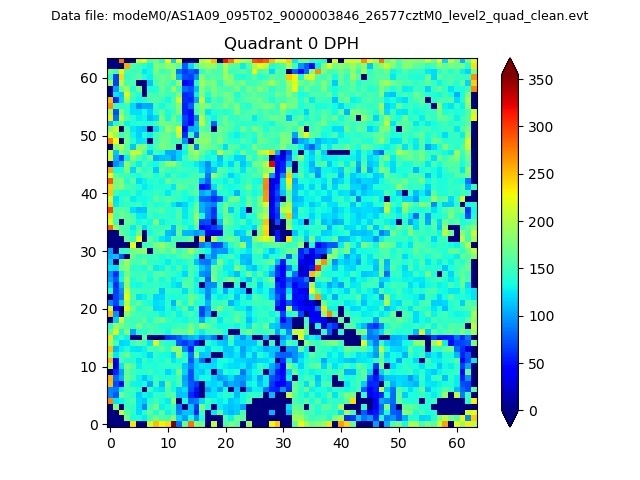 |
 |
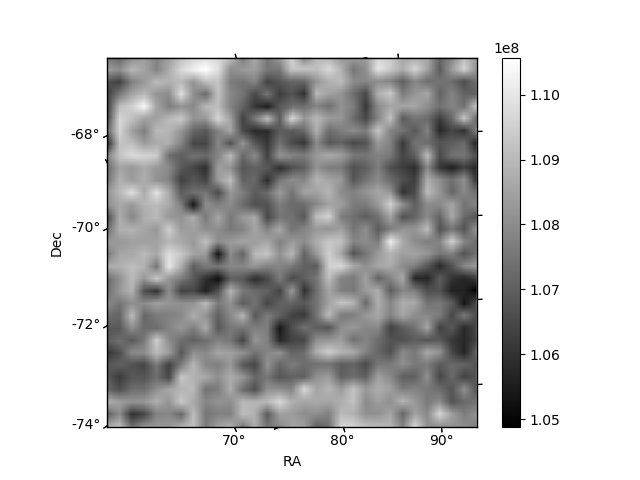
Quadrant B |
|---|---|---|---|
| Quadrant D | 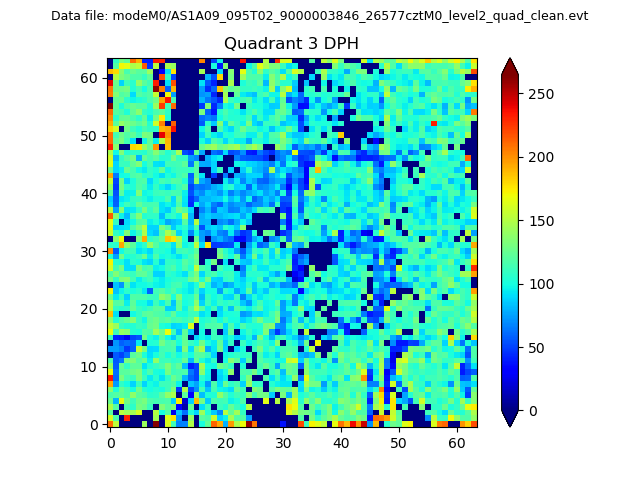 |
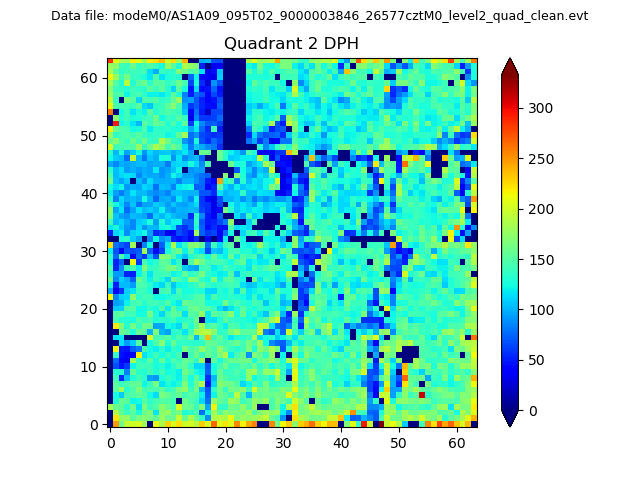 |
Quadrant C |
| Plot type | Count rate plots | Images |
|---|---|---|
| Comparison with Poisson distribution Blue bars denote a histogram of data divided into 1 sec bins. Red curve is a Poisson curve with rate = median count rate of data. |
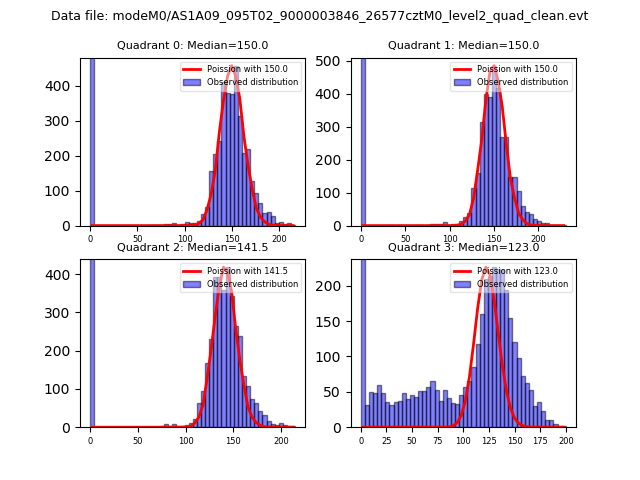 |
 |
| Quadrant-wise count rates Data is divided into 100 sec bins |
 |
|
| Module-wise count rates for Quadrant A Data is divided into 100 sec bins |
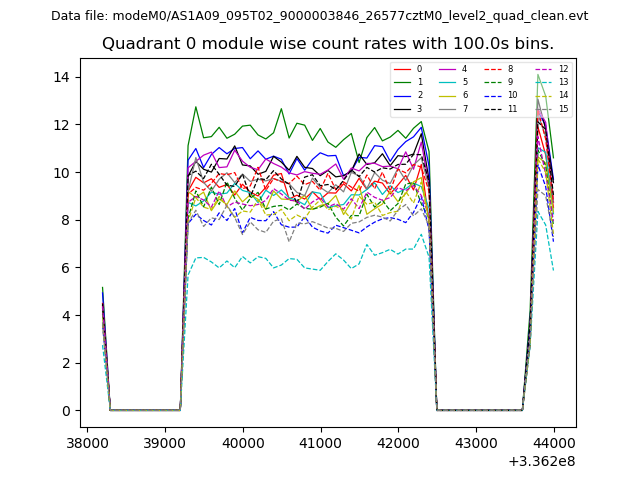 |
 |
| Module-wise count rates for Quadrant B Data is divided into 100 sec bins |
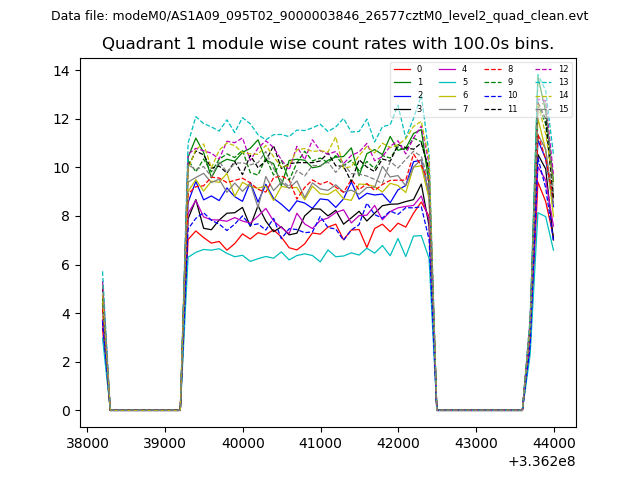 |
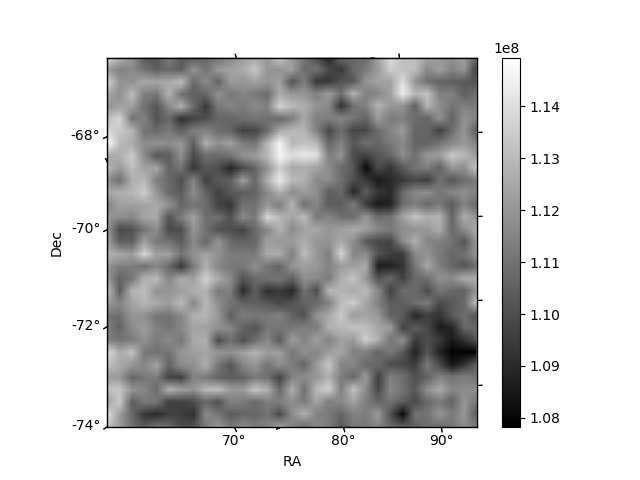 |
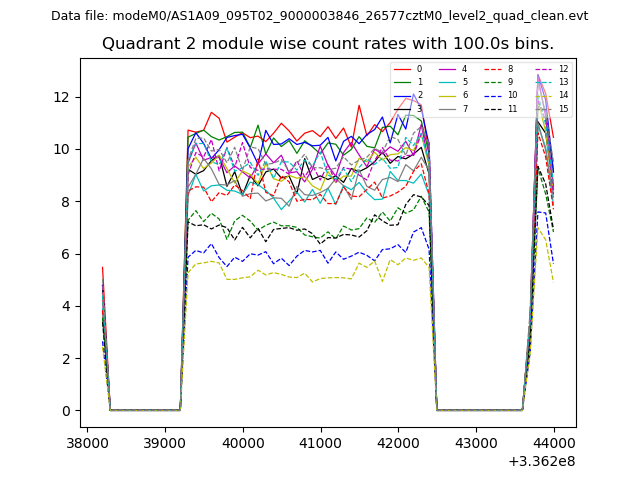
| Module-wise count rates for Quadrant C Data is divided into 100 sec bins |
 |
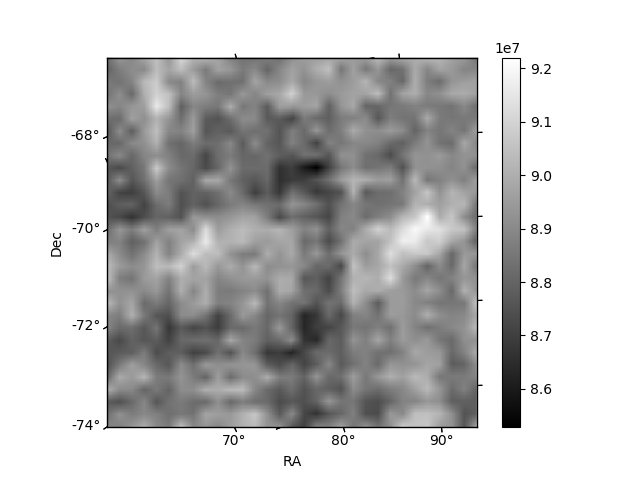 |
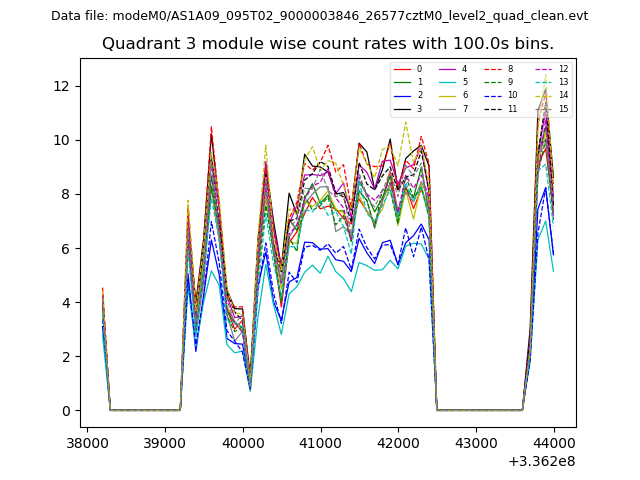
| Module-wise count rates for Quadrant D Data is divided into 100 sec bins |
 |
 |
| Parameter | Plot |
|---|---|
| CZT HV Monitor | 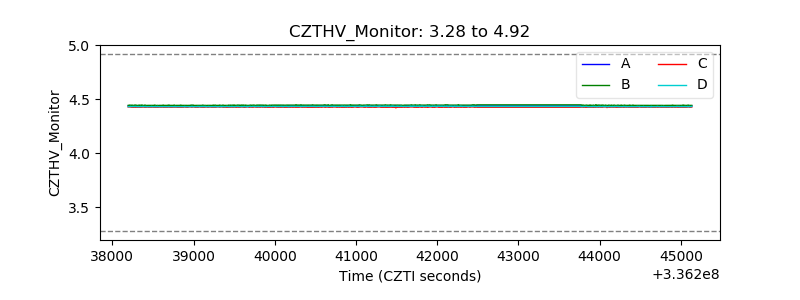 |
| D_VDD | 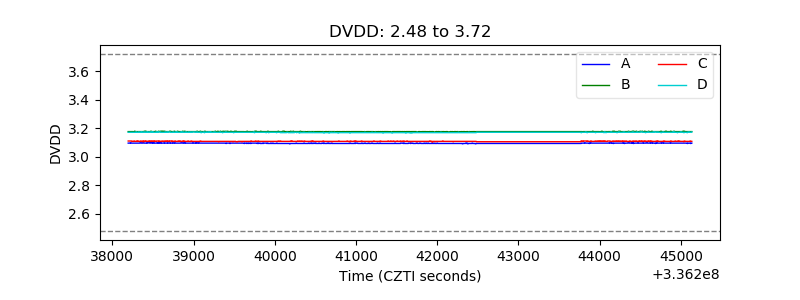 |
| Temperature 1 | 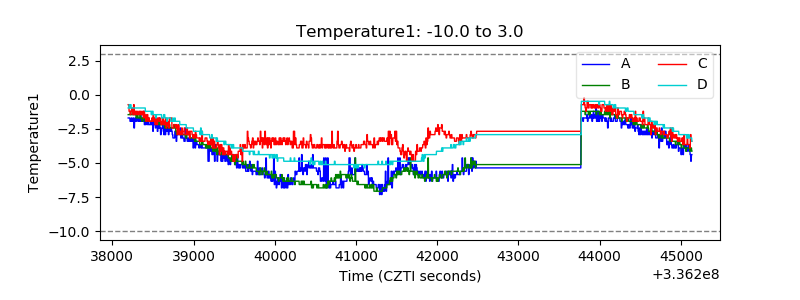 |
| Veto HV Monitor | 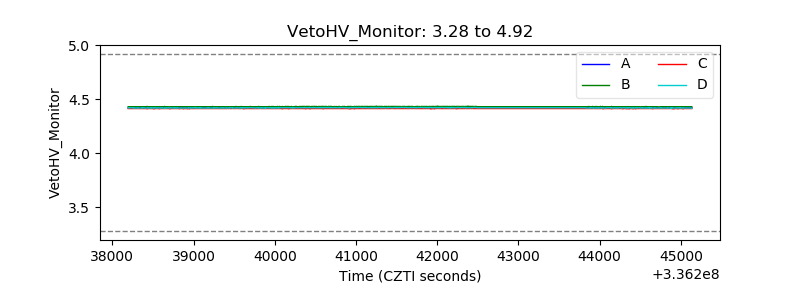 |
| Veto LLD | 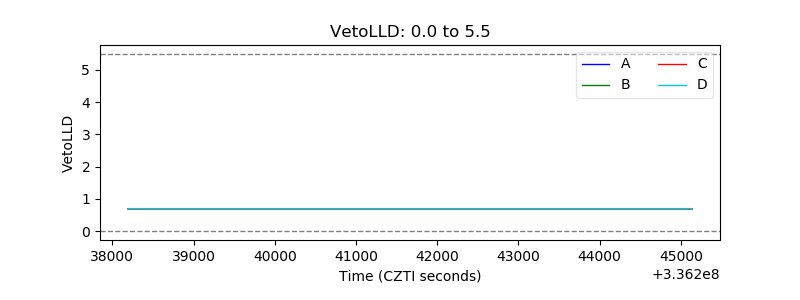 |
| Alpha Counter |  |
| _CPM_Rate |  |
| CZT Counter | 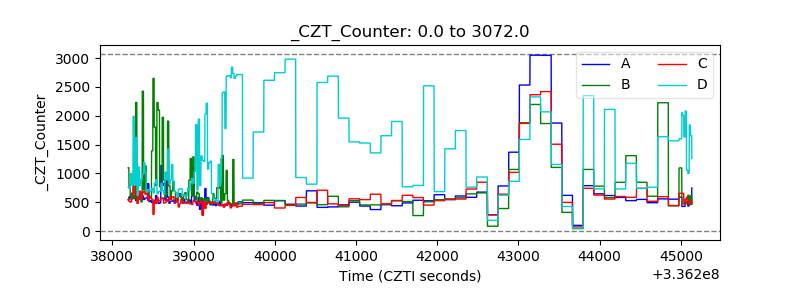 |
| +2.5 Volts monitor |  |
| +5 Volts monitor |  |
| _ROLL_ROT |  |
| _Roll_DEC | 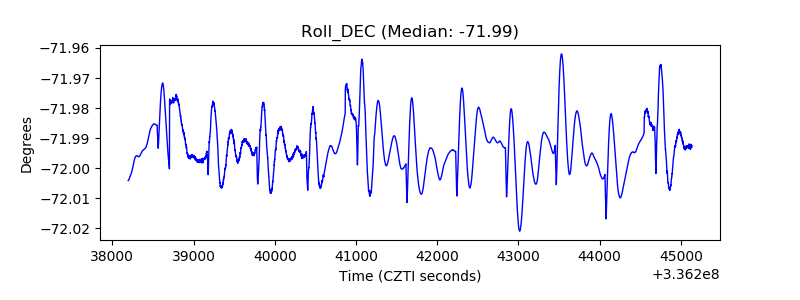 |
| _Roll_RA | 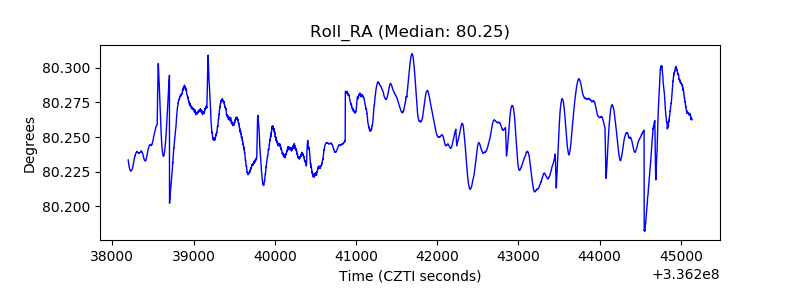 |
| Veto Counter | 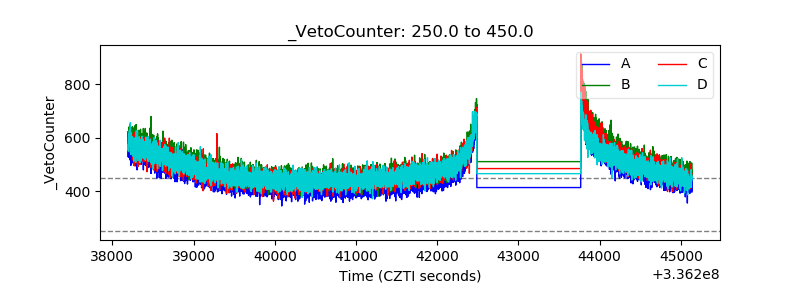 |