| Param | Original file | Final file |
|---|---|---|
| Filename | modeM0/AS1A09_095T02_9000003846_26579cztM0_level2.evt | modeM0/AS1A09_095T02_9000003846_26579cztM0_level2_quad_clean.evt |
| Size (bytes) | 555,148,800 | 107,933,760 |
| Size | 529.4 MB | 102.9 MB |
| Events in quadrant A | 3,386,798 | 716,350 |
| Events in quadrant B | 3,858,360 | 723,582 |
| Events in quadrant C | 3,865,533 | 688,560 |
| Events in quadrant D | 5,237,478 | 662,821 |
| Mode M9 | |||
|---|---|---|---|
| Quadrant | BADHDUFLAG | Total packets | Discarded packets |
| A | 0 | 7 | 0 |
| B | 0 | 7 | 0 |
| C | 0 | 7 | 0 |
| D | 0 | 7 | 0 |
| Mode M0 | |||
|---|---|---|---|
| Quadrant | BADHDUFLAG | Total packets | Discarded packets |
| A | 0 | 14471 | 0 |
| B | 0 | 15907 | 0 |
| C | 0 | 15962 | 0 |
| D | 0 | 20106 | 0 |
| Quadrant | Total seconds | Saturated seconds | Saturation percentage |
|---|---|---|---|
| A | 6854 | 76 | 1.108842% |
| B | 6855 | 131 | 1.911014% |
| C | 6855 | 193 | 2.815463% |
| D | 6855 | 385 | 5.616338% |
Noise dominated data is calculated using 1-second bins in cleaned event files. If a bin has >2000 counts, and if more than 50% of those come from <1% of pixels, then it is considered to be noise-dominated and hence unusable.
| Quadrant | # 1 sec bins | Bins with >0 counts | Bins with >2000 counts | High rate bins dominated by noise | Noise dominated (total time) | Noise dominated (detector-on time) | Marked lightcurve |
|---|---|---|---|---|---|---|---|
| A | 7509 | 6854 | 19 | 19 | 0.25% | 0.28% | 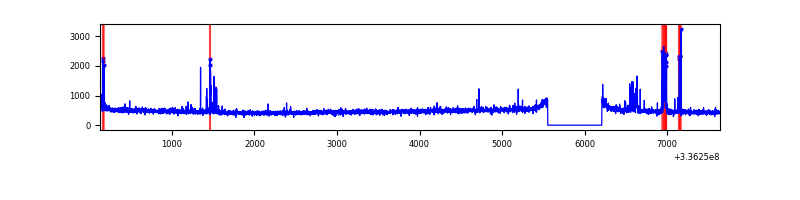 |
| B | 7510 | 6855 | 40 | 40 | 0.53% | 0.58% | 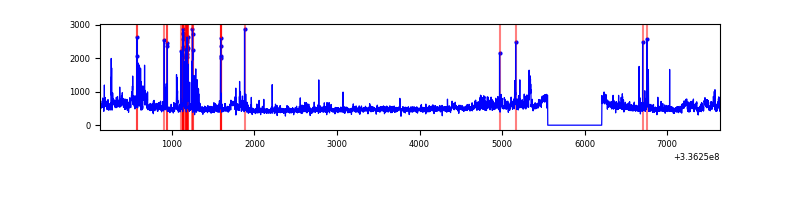 |
| C | 7510 | 6855 | 65 | 65 | 0.87% | 0.95% | 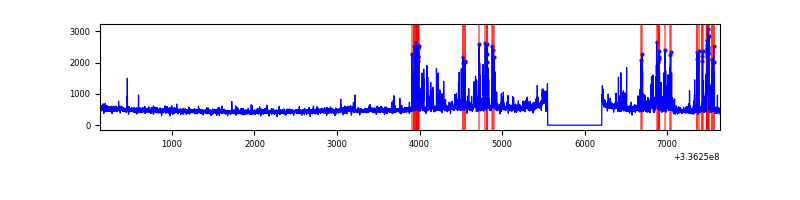 |
| D | 7510 | 6856 | 307 | 307 | 4.09% | 4.48% | 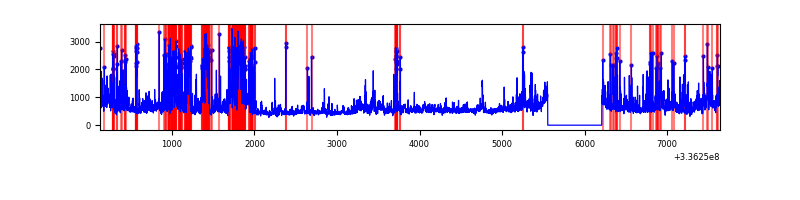 |
Top three noisy pixels from each quadrant. If the there are fewer than three noisy pixels in the level2.evt file, extra rows are filled as -1
| Pixel properties | Quadrant properties | ||||||
|---|---|---|---|---|---|---|---|
| Quadrant | DetID | PixID | Counts | Sigma | Mean | Median | Sigma |
| A | 0 | 13 | 169641 | 1017.94 | 832 | 815 | 165.9 |
| A | 13 | 254 | 11150 | 62.31 | 832 | 815 | 165.9 |
| A | 3 | 137 | 7728 | 41.68 | 832 | 815 | 165.9 |
| B | 0 | 189 | 210932 | 1356.34 | 825 | 806 | 154.9 |
| B | 5 | 172 | 206569 | 1328.18 | 825 | 806 | 154.9 |
| B | 3 | 112 | 73986 | 472.37 | 825 | 806 | 154.9 |
| C | 4 | 254 | 521453 | 2835.71 | 790 | 795 | 183.6 |
| C | 14 | 238 | 127567 | 690.45 | 790 | 795 | 183.6 |
| C | 3 | 233 | 118025 | 638.48 | 790 | 795 | 183.6 |
| D | 1 | 52 | 1013439 | 5304.46 | 788 | 764 | 190.9 |
| D | 7 | 80 | 720407 | 3769.54 | 788 | 764 | 190.9 |
| D | 2 | 250 | 312686 | 1633.87 | 788 | 764 | 190.9 |
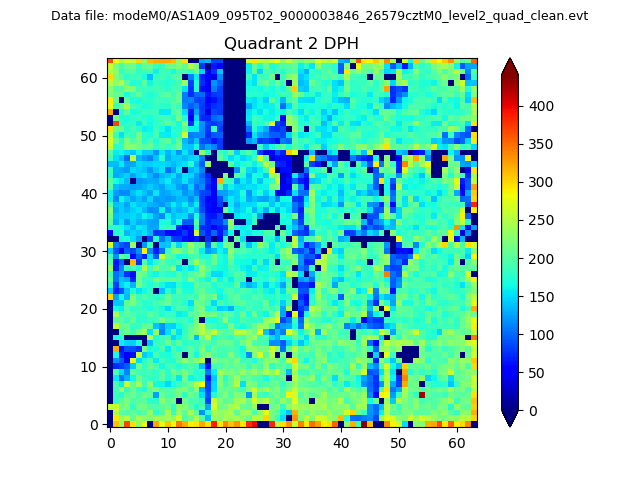
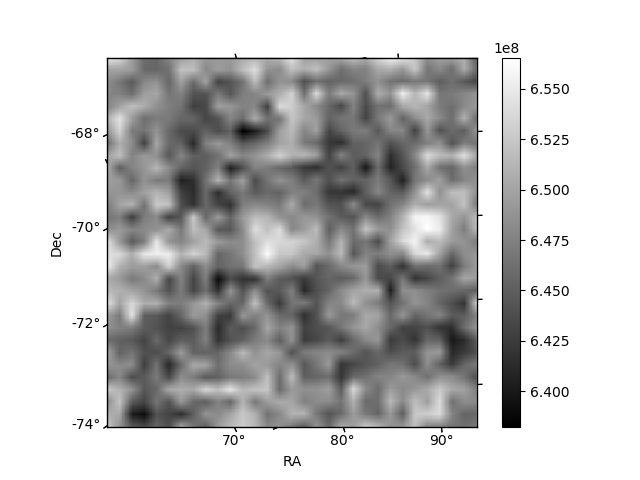
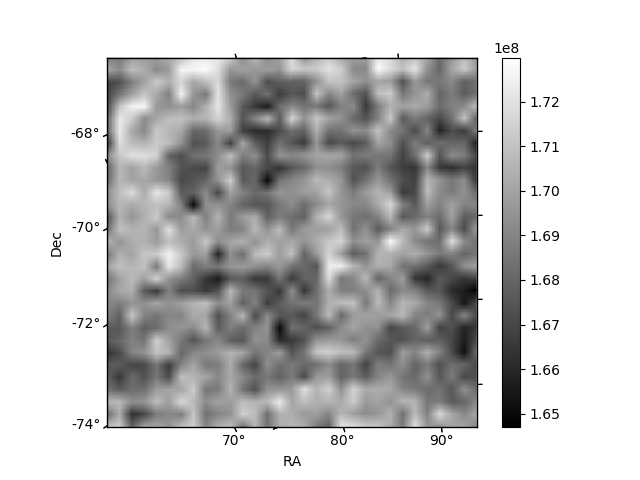
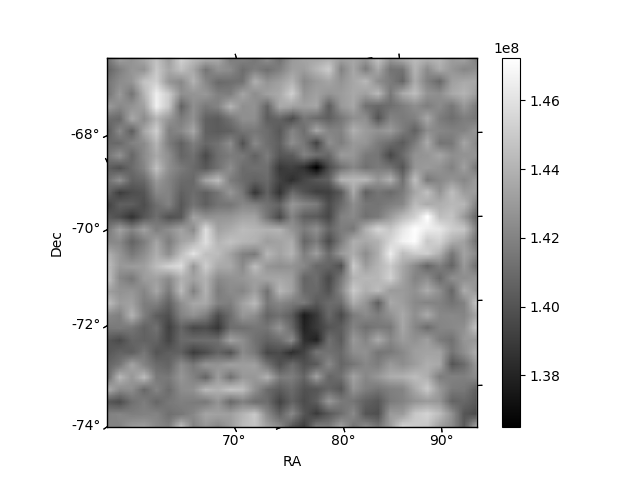
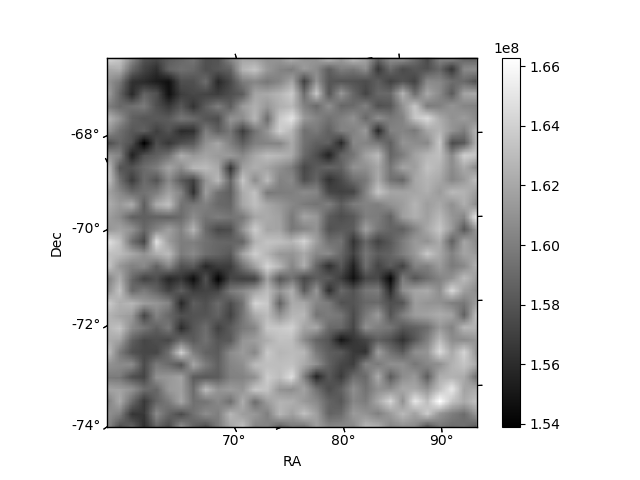
Histogram calculated using DETX and DETY for each event in the final _common_clean file
| Quadrant A | 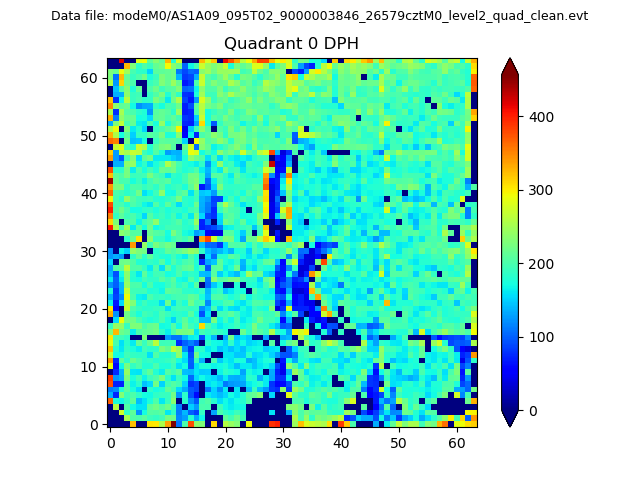 |
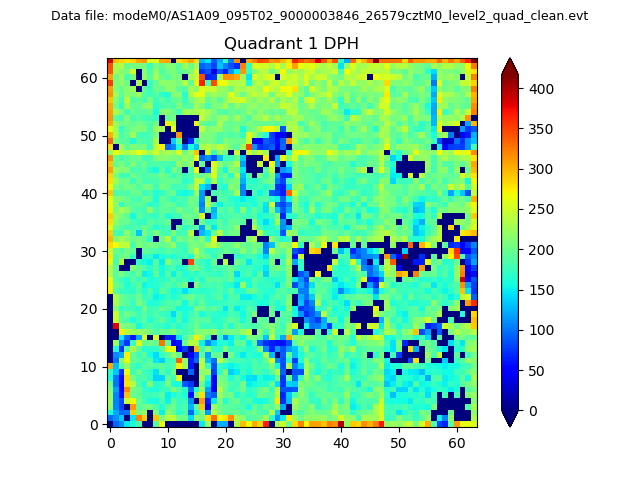 |
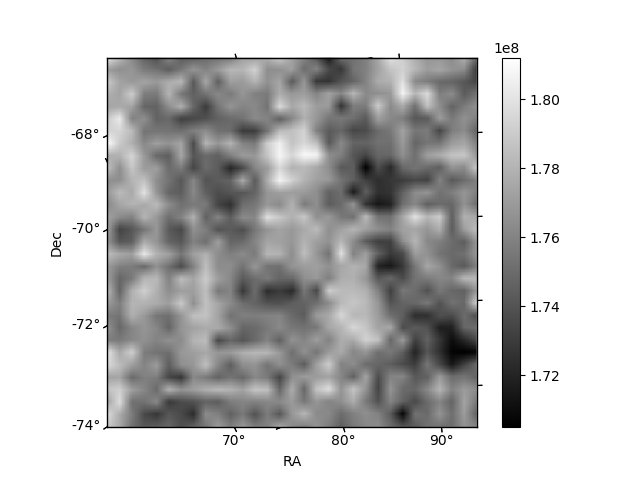
Quadrant B |
|---|---|---|---|
| Quadrant D | 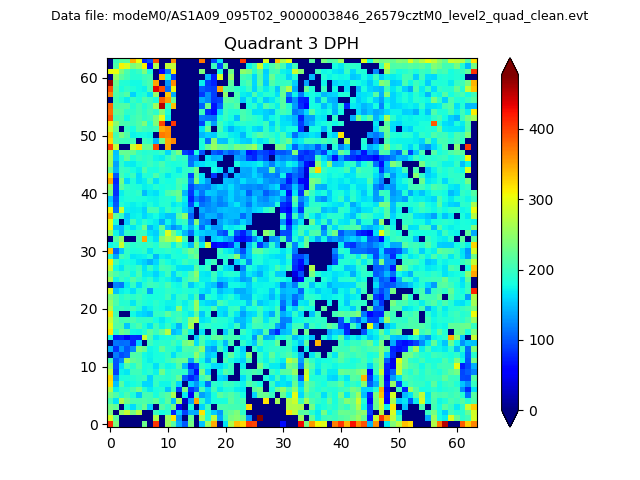 |
 |
Quadrant C |
| Plot type | Count rate plots | Images |
|---|---|---|
| Comparison with Poisson distribution Blue bars denote a histogram of data divided into 1 sec bins. Red curve is a Poisson curve with rate = median count rate of data. |
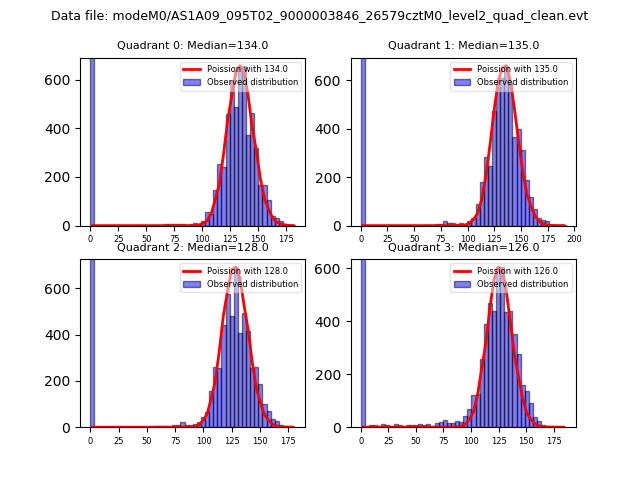 |
 |
| Quadrant-wise count rates Data is divided into 100 sec bins |
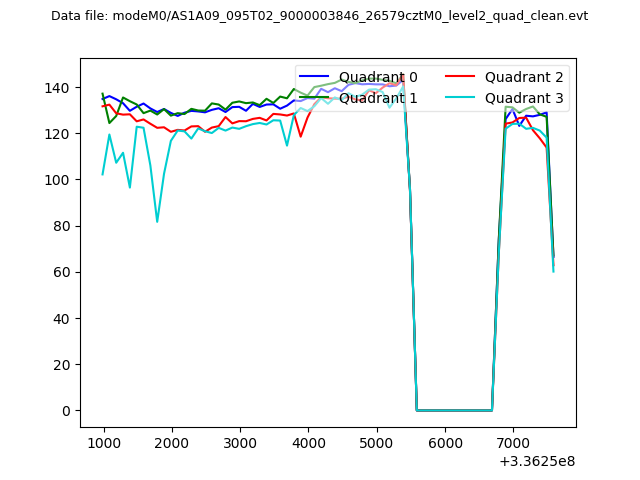 |
|
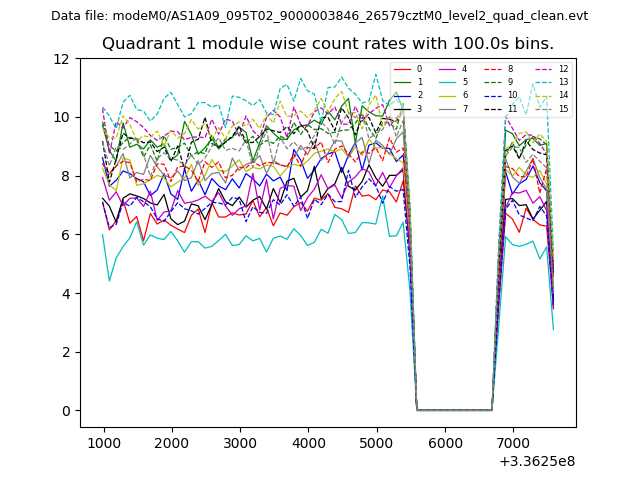
| Module-wise count rates for Quadrant A Data is divided into 100 sec bins |
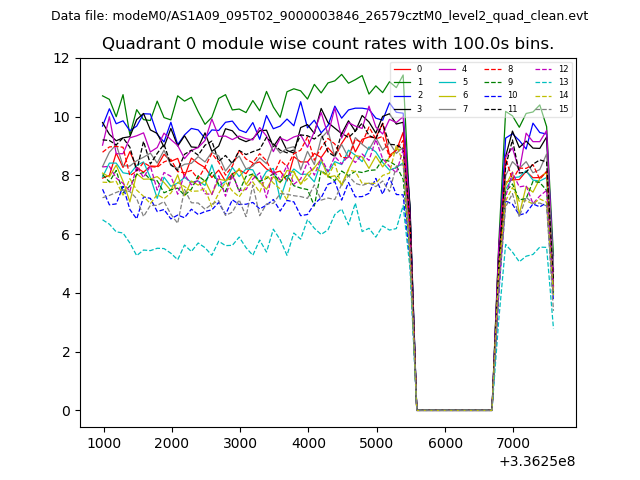 |
 |
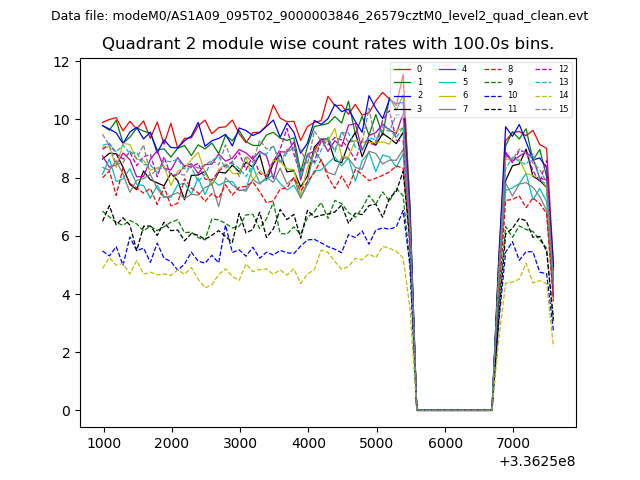
| Module-wise count rates for Quadrant B Data is divided into 100 sec bins |
 |
 |
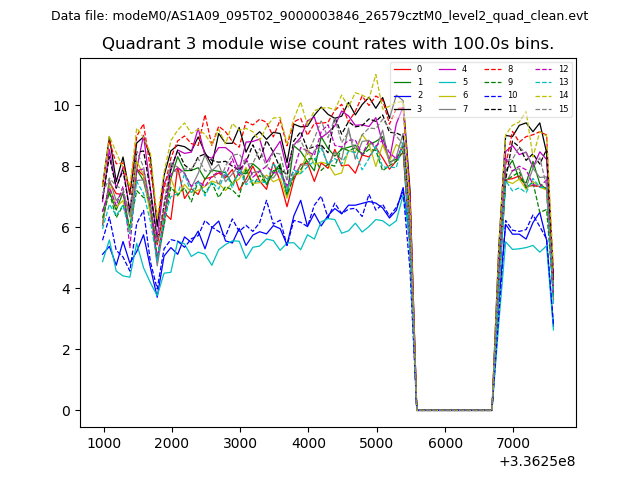
| Module-wise count rates for Quadrant C Data is divided into 100 sec bins |
 |
 |
| Module-wise count rates for Quadrant D Data is divided into 100 sec bins |
 |
 |
| Parameter | Plot |
|---|---|
| CZT HV Monitor | 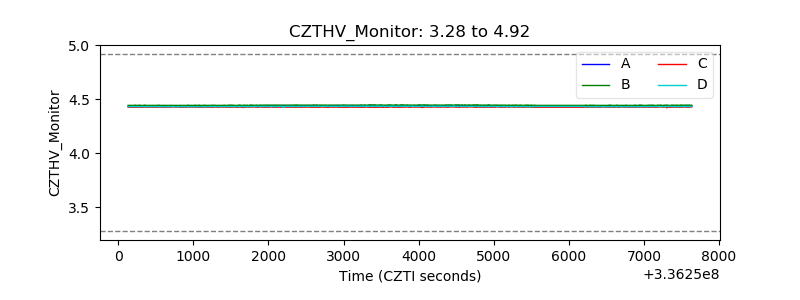 |
| D_VDD | 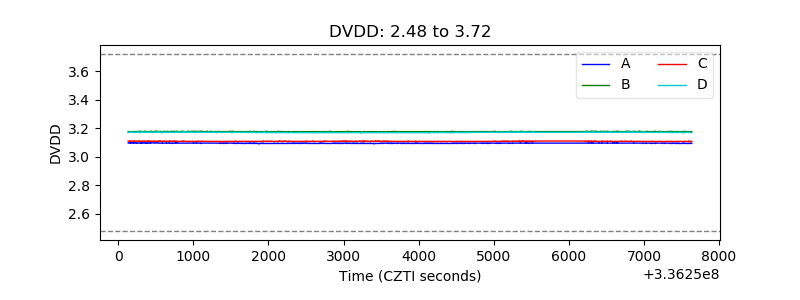 |
| Temperature 1 | 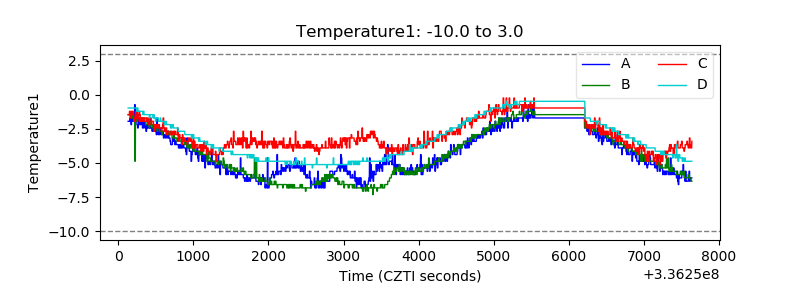 |
| Veto HV Monitor | 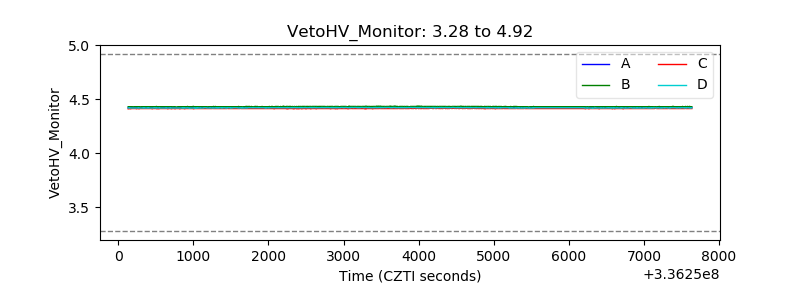 |
| Veto LLD | 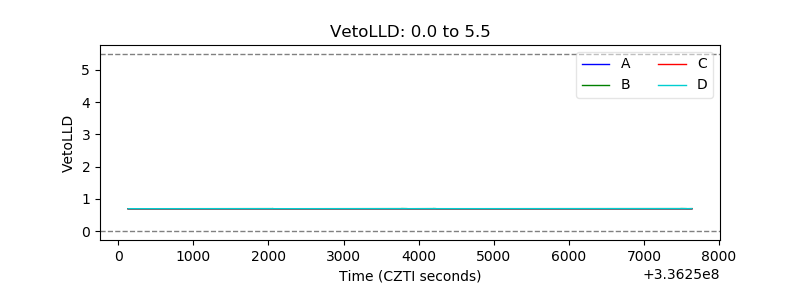 |
| Alpha Counter | 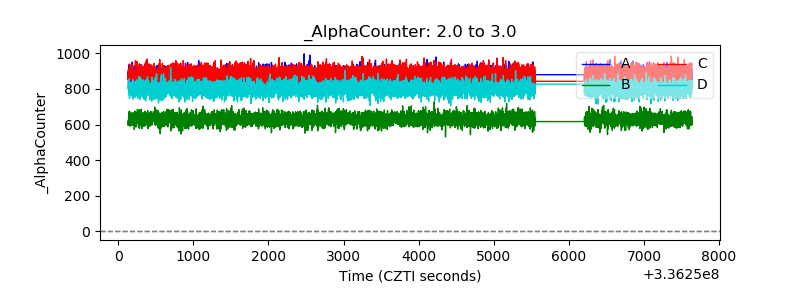 |
| _CPM_Rate | 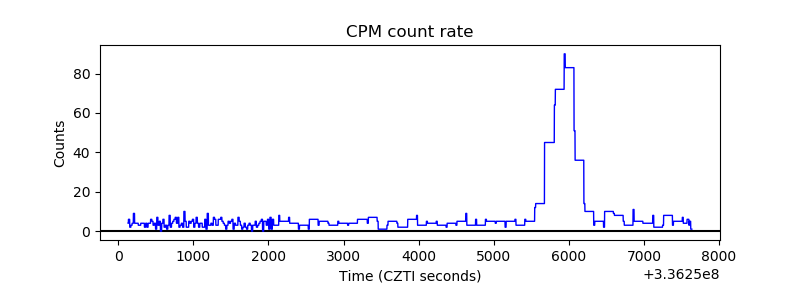 |
| CZT Counter | 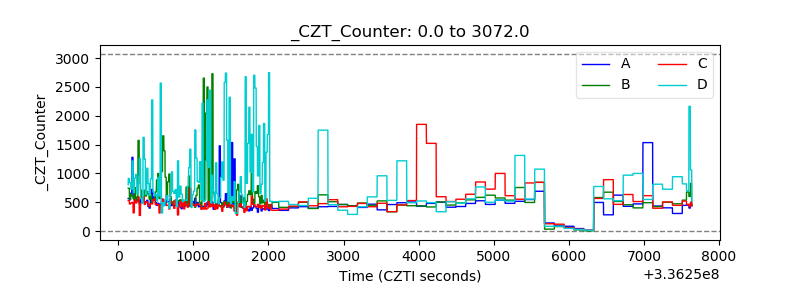 |
| +2.5 Volts monitor |  |
| +5 Volts monitor |  |
| _ROLL_ROT | 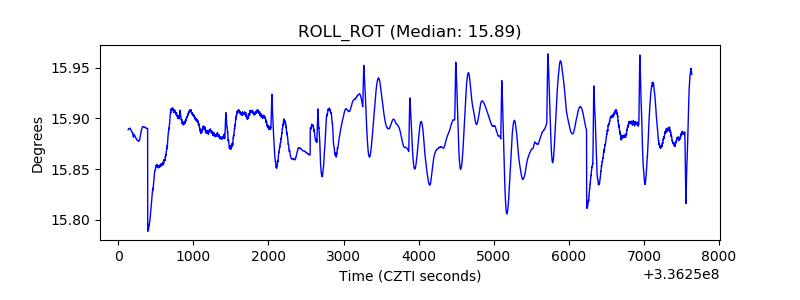 |
| _Roll_DEC | 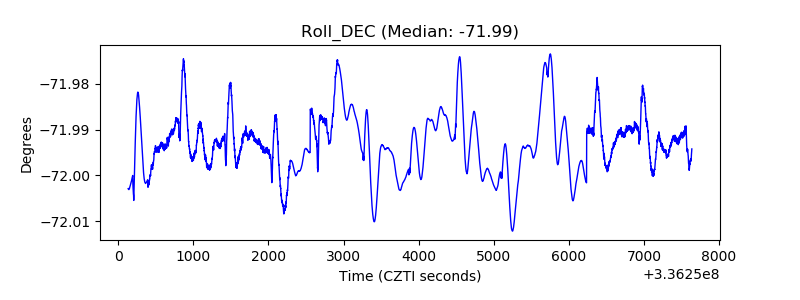 |
| _Roll_RA | 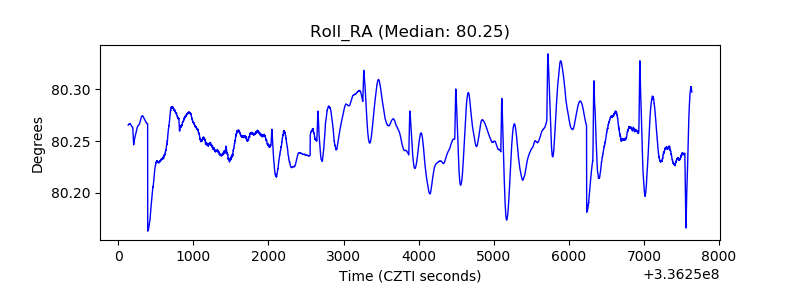 |
| Veto Counter | 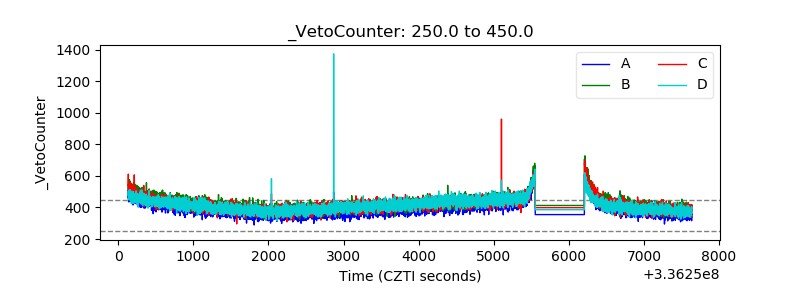 |