| Param | Original file | Final file |
|---|---|---|
| Filename | modeM0/AS1A09_095T02_9000003846_26580cztM0_level2.evt | modeM0/AS1A09_095T02_9000003846_26580cztM0_level2_quad_clean.evt |
| Size (bytes) | 595,742,400 | 117,380,160 |
| Size | 568.1 MB | 111.9 MB |
| Events in quadrant A | 3,716,970 | 778,875 |
| Events in quadrant B | 3,963,048 | 789,562 |
| Events in quadrant C | 4,362,995 | 753,270 |
| Events in quadrant D | 5,495,066 | 715,693 |
| Mode M9 | |||
|---|---|---|---|
| Quadrant | BADHDUFLAG | Total packets | Discarded packets |
| A | 0 | 10 | 0 |
| B | 0 | 10 | 0 |
| C | 0 | 10 | 0 |
| D | 0 | 10 | 0 |
| Mode M0 | |||
|---|---|---|---|
| Quadrant | BADHDUFLAG | Total packets | Discarded packets |
| A | 0 | 15969 | 0 |
| B | 0 | 16562 | 0 |
| C | 0 | 17721 | 0 |
| D | 0 | 21333 | 0 |
| Quadrant | Total seconds | Saturated seconds | Saturation percentage |
|---|---|---|---|
| A | 7438 | 109 | 1.465448% |
| B | 7439 | 140 | 1.881973% |
| C | 7439 | 260 | 3.495093% |
| D | 7439 | 428 | 5.753461% |
Noise dominated data is calculated using 1-second bins in cleaned event files. If a bin has >2000 counts, and if more than 50% of those come from <1% of pixels, then it is considered to be noise-dominated and hence unusable.
| Quadrant | # 1 sec bins | Bins with >0 counts | Bins with >2000 counts | High rate bins dominated by noise | Noise dominated (total time) | Noise dominated (detector-on time) | Marked lightcurve |
|---|---|---|---|---|---|---|---|
| A | 8403 | 7439 | 19 | 19 | 0.23% | 0.26% | 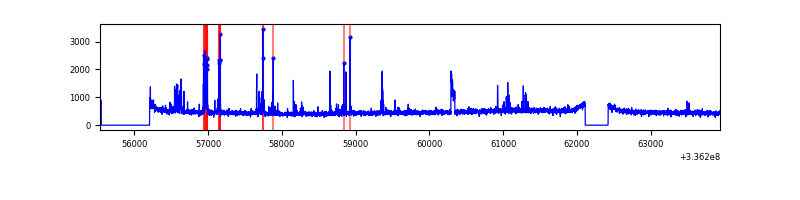 |
| B | 8404 | 7440 | 15 | 15 | 0.18% | 0.20% | 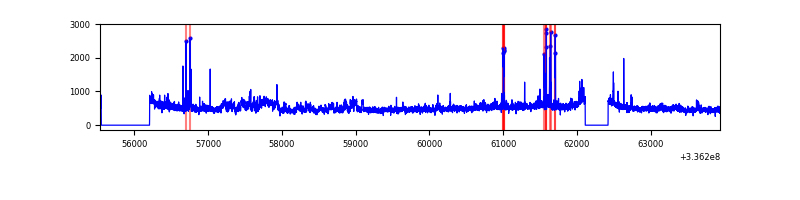 |
| C | 8404 | 7440 | 79 | 79 | 0.94% | 1.06% | 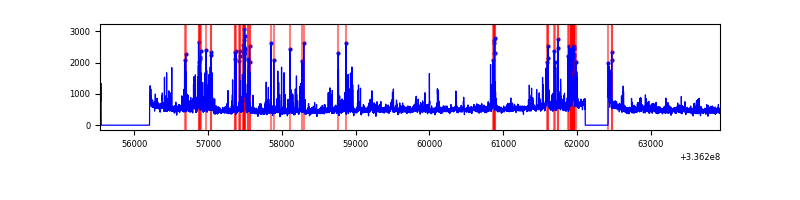 |
| D | 8404 | 7441 | 205 | 205 | 2.44% | 2.76% | 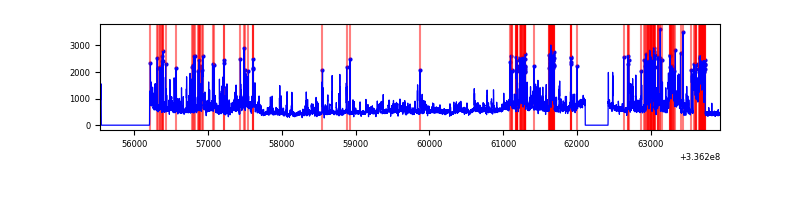 |
Top three noisy pixels from each quadrant. If the there are fewer than three noisy pixels in the level2.evt file, extra rows are filled as -1
| Pixel properties | Quadrant properties | ||||||
|---|---|---|---|---|---|---|---|
| Quadrant | DetID | PixID | Counts | Sigma | Mean | Median | Sigma |
| A | 0 | 13 | 262582 | 1455.35 | 893 | 874 | 179.8 |
| A | 13 | 254 | 11803 | 60.78 | 893 | 874 | 179.8 |
| A | 3 | 137 | 8446 | 42.11 | 893 | 874 | 179.8 |
| B | 0 | 189 | 250089 | 1497.45 | 889 | 868 | 166.4 |
| B | 5 | 172 | 75658 | 449.38 | 889 | 868 | 166.4 |
| B | 3 | 112 | 70528 | 418.55 | 889 | 868 | 166.4 |
| C | 4 | 254 | 623187 | 3162.01 | 851 | 854 | 196.8 |
| C | 3 | 233 | 240438 | 1217.3 | 851 | 854 | 196.8 |
| C | 14 | 238 | 136461 | 689.0 | 851 | 854 | 196.8 |
| D | 1 | 52 | 1463642 | 7141.02 | 843 | 817 | 204.8 |
| D | 2 | 250 | 506212 | 2467.17 | 843 | 817 | 204.8 |
| D | 7 | 80 | 271030 | 1319.09 | 843 | 817 | 204.8 |
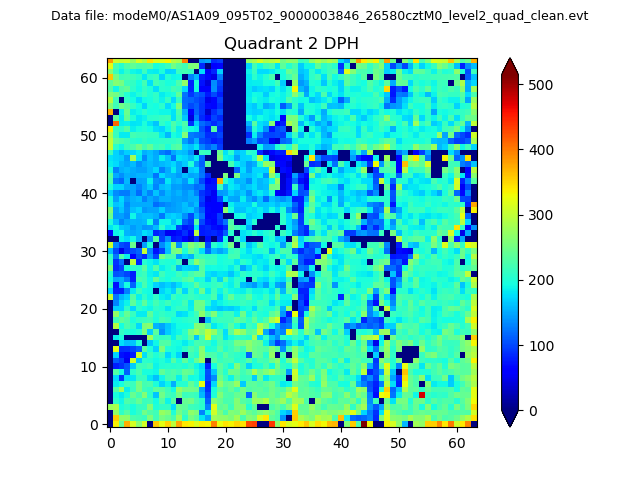
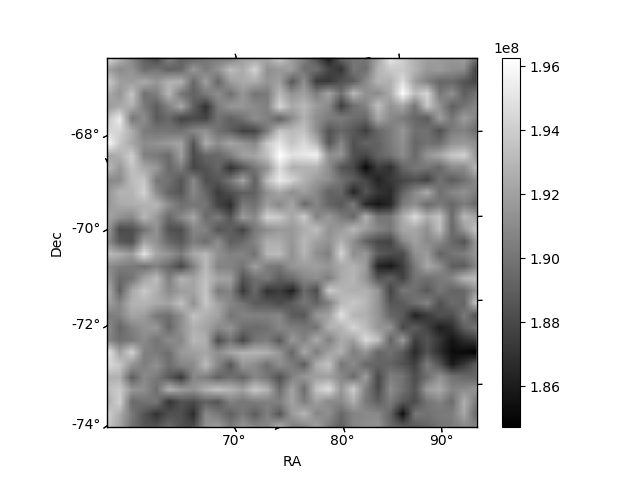
Histogram calculated using DETX and DETY for each event in the final _common_clean file
| Quadrant A | 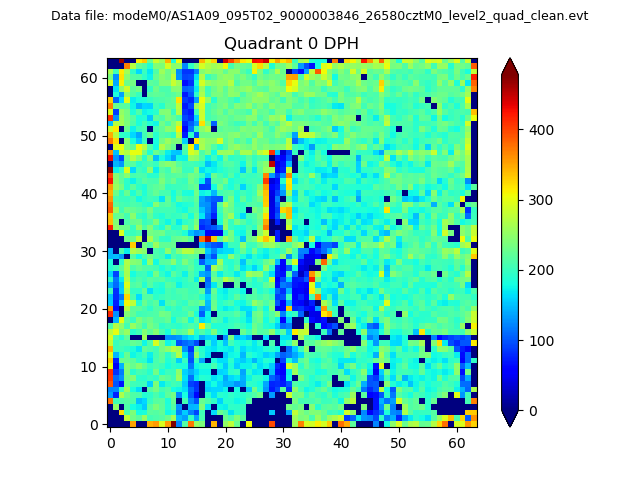 |
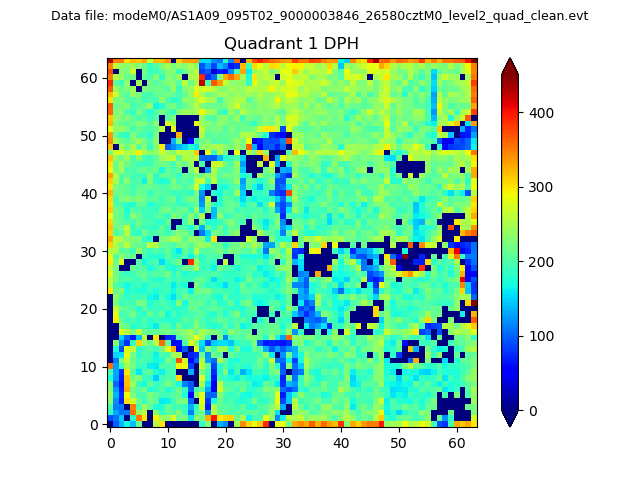 |
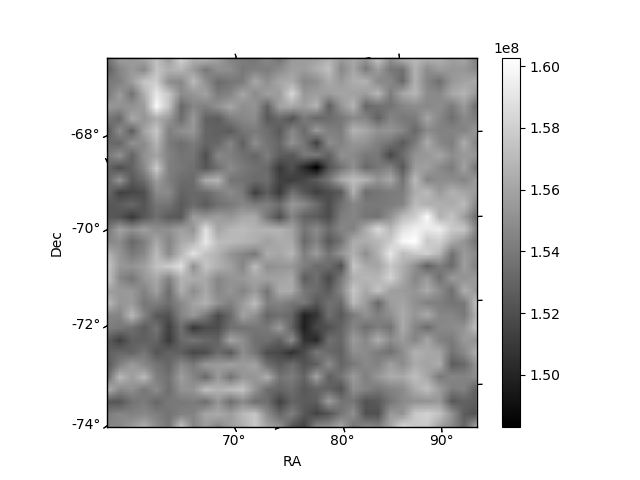
Quadrant B |
|---|---|---|---|
| Quadrant D | 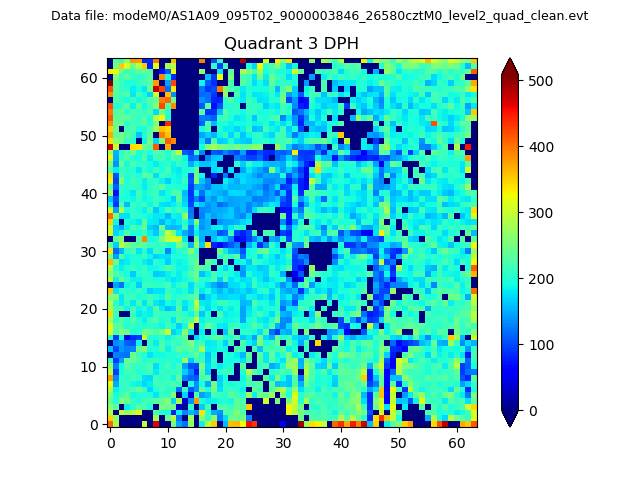 |
 |
Quadrant C |
| Plot type | Count rate plots | Images |
|---|---|---|
| Comparison with Poisson distribution Blue bars denote a histogram of data divided into 1 sec bins. Red curve is a Poisson curve with rate = median count rate of data. |
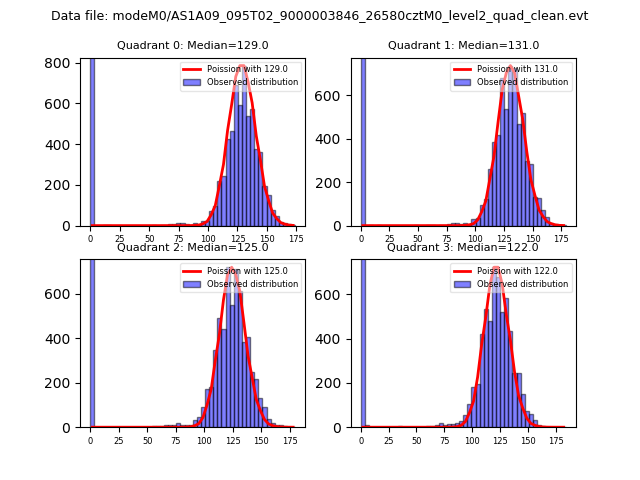 |
 |
| Quadrant-wise count rates Data is divided into 100 sec bins |
 |
|
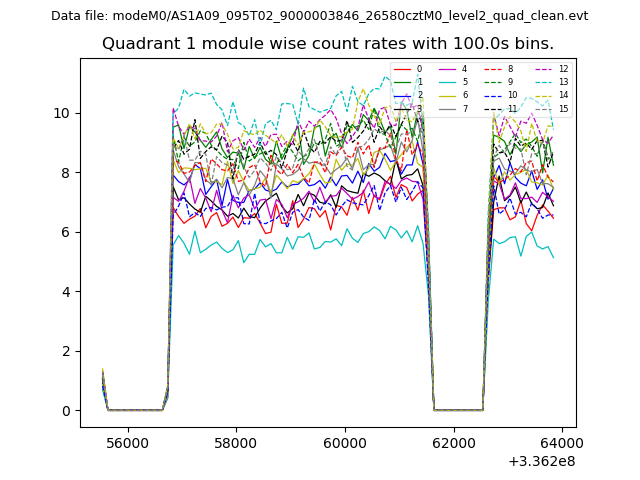
| Module-wise count rates for Quadrant A Data is divided into 100 sec bins |
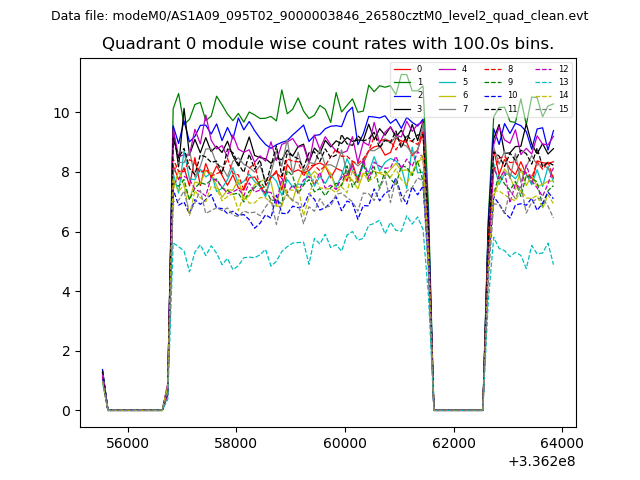 |
 |
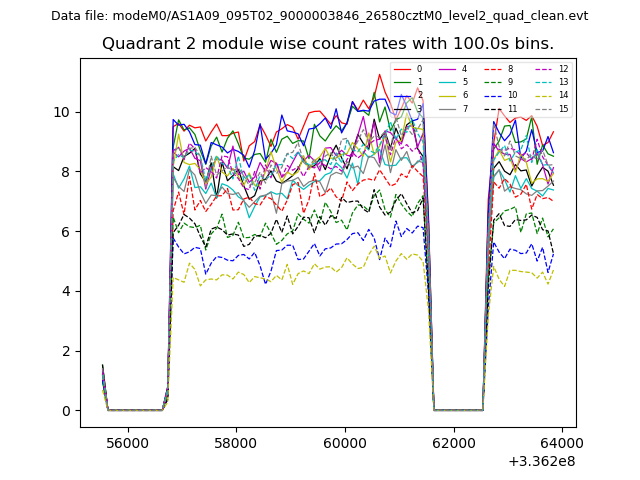
| Module-wise count rates for Quadrant B Data is divided into 100 sec bins |
 |
 |
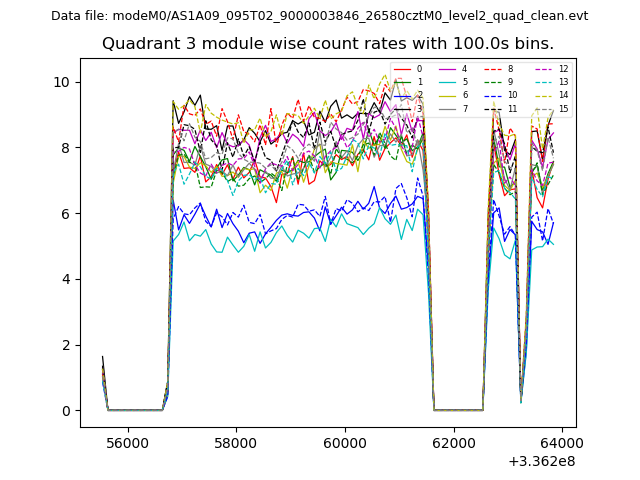
| Module-wise count rates for Quadrant C Data is divided into 100 sec bins |
 |
 |
| Module-wise count rates for Quadrant D Data is divided into 100 sec bins |
 |
 |
| Parameter | Plot |
|---|---|
| CZT HV Monitor | 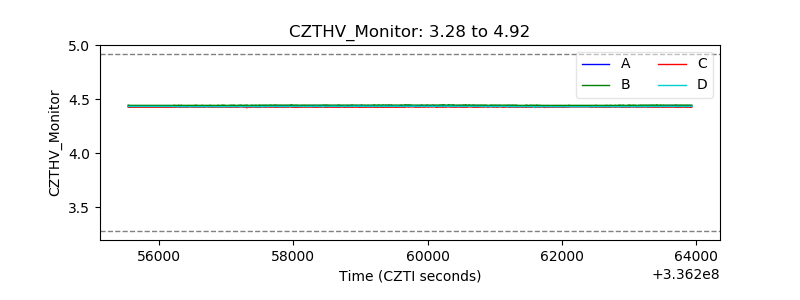 |
| D_VDD | 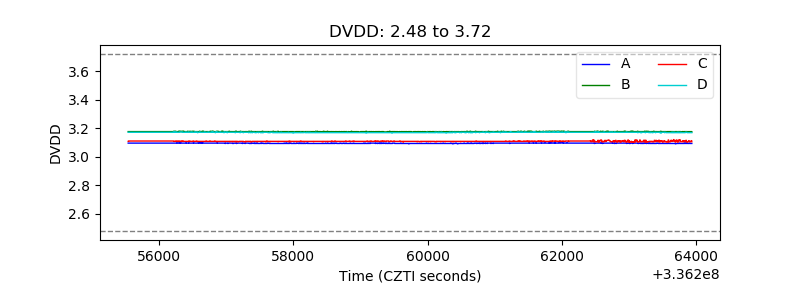 |
| Temperature 1 | 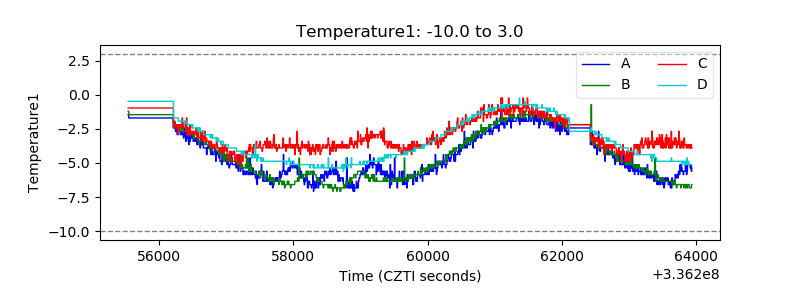 |
| Veto HV Monitor | 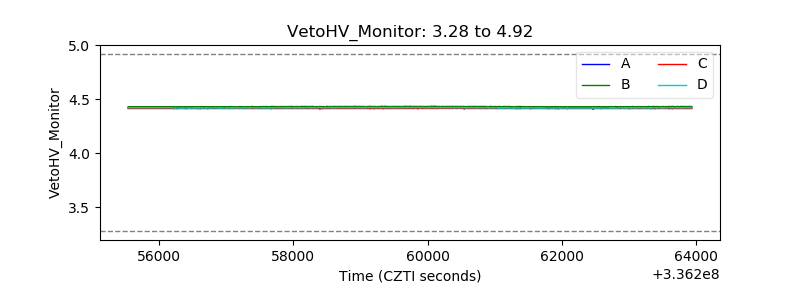 |
| Veto LLD | 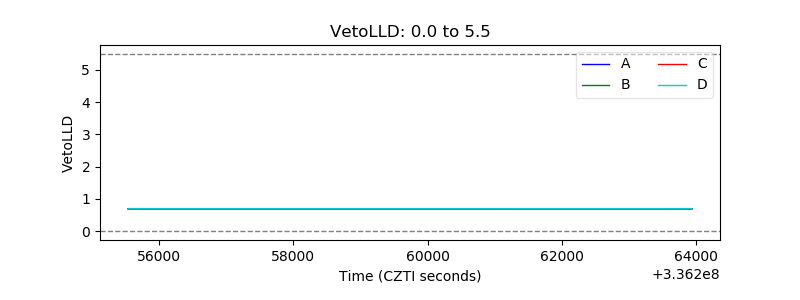 |
| Alpha Counter | 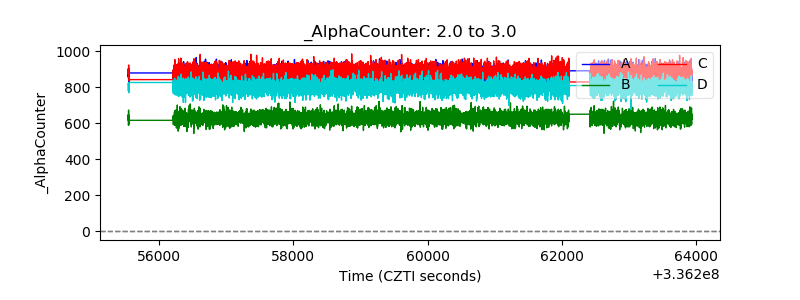 |
| _CPM_Rate | 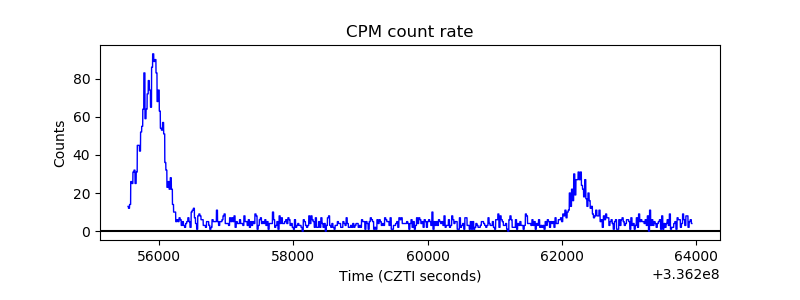 |
| CZT Counter | 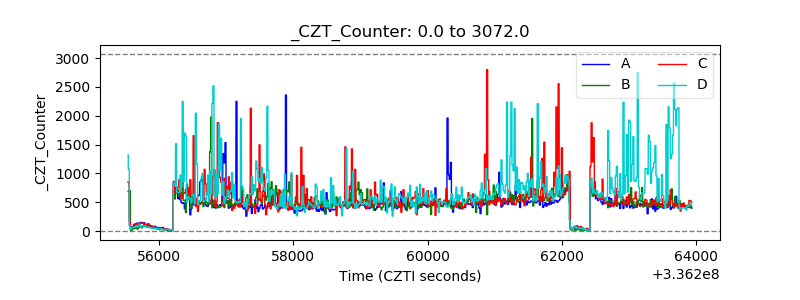 |
| +2.5 Volts monitor | 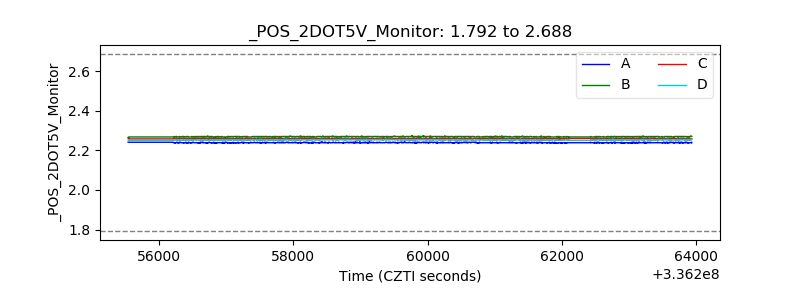 |
| +5 Volts monitor |  |
| _ROLL_ROT | 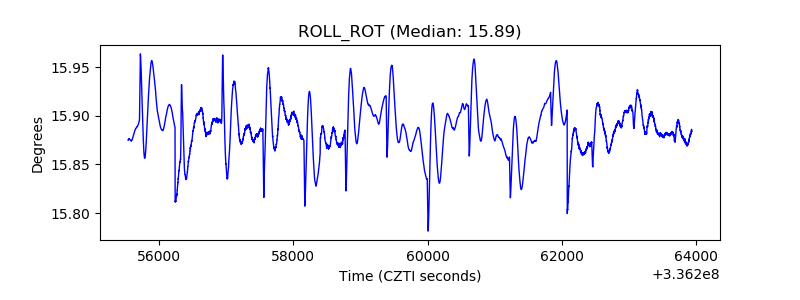 |
| _Roll_DEC | 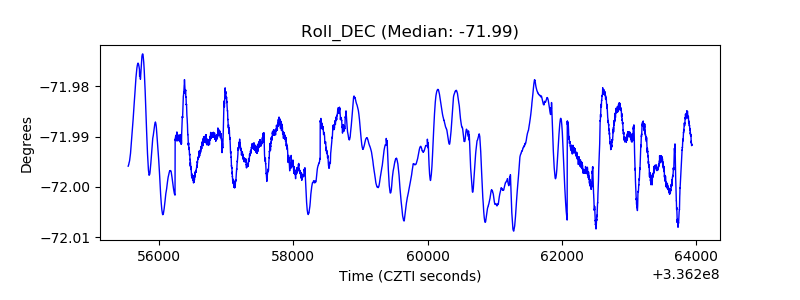 |
| _Roll_RA | 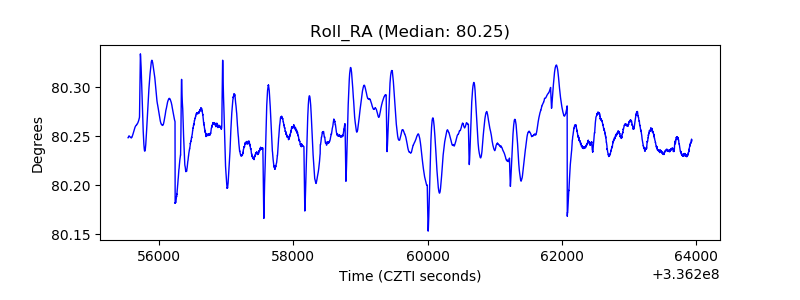 |
| Veto Counter | 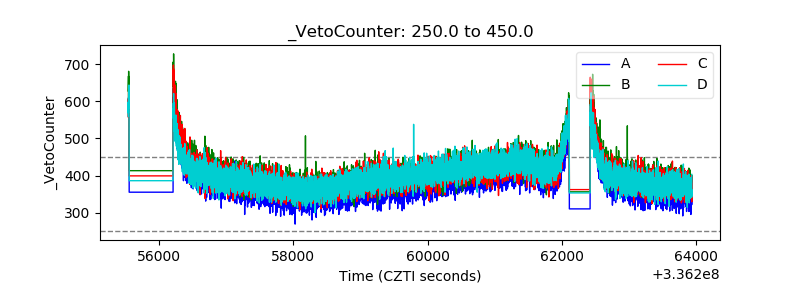 |