| Param | Original file | Final file |
|---|---|---|
| Filename | modeM0/AS1A09_095T02_9000003846_26581cztM0_level2.evt | modeM0/AS1A09_095T02_9000003846_26581cztM0_level2_quad_clean.evt |
| Size (bytes) | 705,479,040 | 120,625,920 |
| Size | 672.8 MB | 115.0 MB |
| Events in quadrant A | 3,665,355 | 808,115 |
| Events in quadrant B | 4,515,682 | 809,984 |
| Events in quadrant C | 4,506,031 | 775,617 |
| Events in quadrant D | 8,147,760 | 714,343 |
| Mode M9 | |||
|---|---|---|---|
| Quadrant | BADHDUFLAG | Total packets | Discarded packets |
| A | 0 | 6 | 0 |
| B | 0 | 6 | 0 |
| C | 0 | 6 | 0 |
| D | 0 | 6 | 0 |
| Mode M0 | |||
|---|---|---|---|
| Quadrant | BADHDUFLAG | Total packets | Discarded packets |
| A | 0 | 16102 | 0 |
| B | 0 | 18728 | 0 |
| C | 0 | 18270 | 0 |
| D | 0 | 29697 | 0 |
| Quadrant | Total seconds | Saturated seconds | Saturation percentage |
|---|---|---|---|
| A | 7832 | 100 | 1.276813% |
| B | 7833 | 181 | 2.310737% |
| C | 7832 | 302 | 3.855975% |
| D | 7832 | 1571 | 20.058733% |
Noise dominated data is calculated using 1-second bins in cleaned event files. If a bin has >2000 counts, and if more than 50% of those come from <1% of pixels, then it is considered to be noise-dominated and hence unusable.
| Quadrant | # 1 sec bins | Bins with >0 counts | Bins with >2000 counts | High rate bins dominated by noise | Noise dominated (total time) | Noise dominated (detector-on time) | Marked lightcurve |
|---|---|---|---|---|---|---|---|
| A | 8437 | 7834 | 0 | 0 | 0.00% | 0.00% | 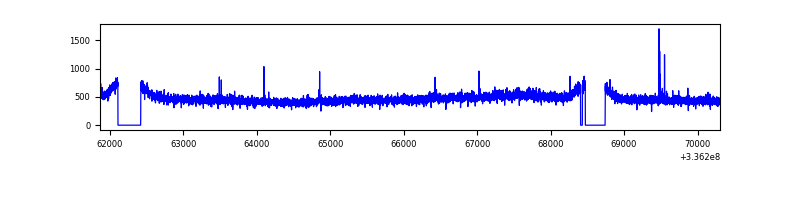 |
| B | 8438 | 7835 | 12 | 12 | 0.14% | 0.15% | 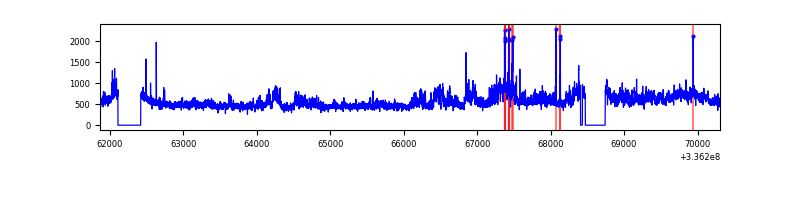 |
| C | 8437 | 7833 | 94 | 94 | 1.11% | 1.20% | 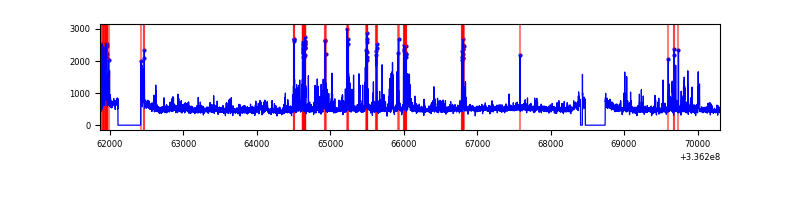 |
| D | 8437 | 7834 | 1257 | 1257 | 14.90% | 16.05% | 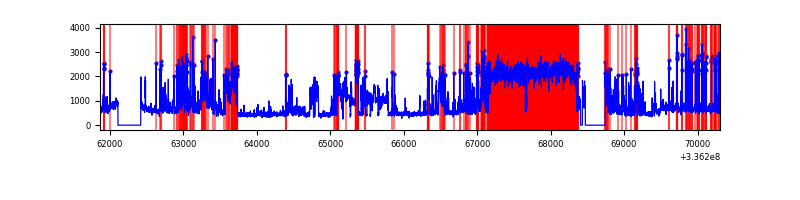 |
Top three noisy pixels from each quadrant. If the there are fewer than three noisy pixels in the level2.evt file, extra rows are filled as -1
| Pixel properties | Quadrant properties | ||||||
|---|---|---|---|---|---|---|---|
| Quadrant | DetID | PixID | Counts | Sigma | Mean | Median | Sigma |
| A | 0 | 13 | 20853 | 105.52 | 940 | 918 | 188.9 |
| A | 13 | 254 | 12698 | 62.35 | 940 | 918 | 188.9 |
| A | 3 | 137 | 8939 | 42.45 | 940 | 918 | 188.9 |
| B | 0 | 189 | 670482 | 3787.45 | 936 | 911 | 176.8 |
| B | 5 | 172 | 59868 | 333.49 | 936 | 911 | 176.8 |
| B | 3 | 112 | 53645 | 298.29 | 936 | 911 | 176.8 |
| C | 4 | 254 | 571665 | 2711.55 | 896 | 902 | 210.5 |
| C | 3 | 233 | 169758 | 802.19 | 896 | 902 | 210.5 |
| C | 14 | 238 | 143985 | 679.75 | 896 | 902 | 210.5 |
| D | 7 | 80 | 2761800 | 13257.34 | 856 | 828 | 208.3 |
| D | 1 | 52 | 1424076 | 6834.0 | 856 | 828 | 208.3 |
| D | 2 | 250 | 536590 | 2572.56 | 856 | 828 | 208.3 |
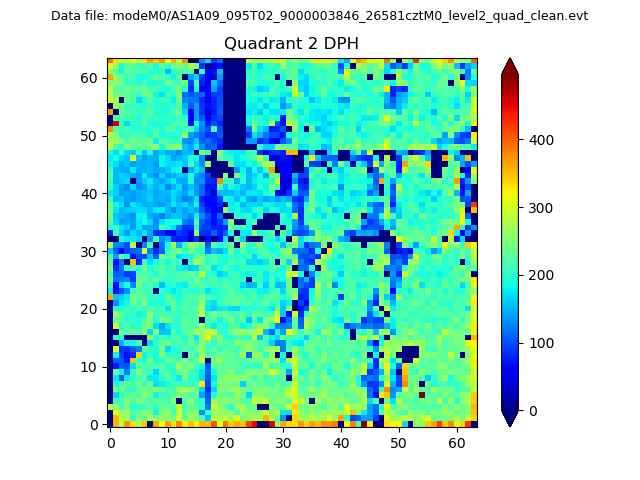
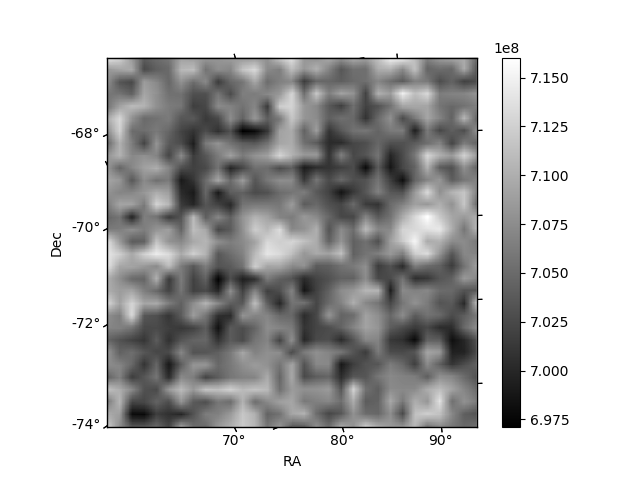
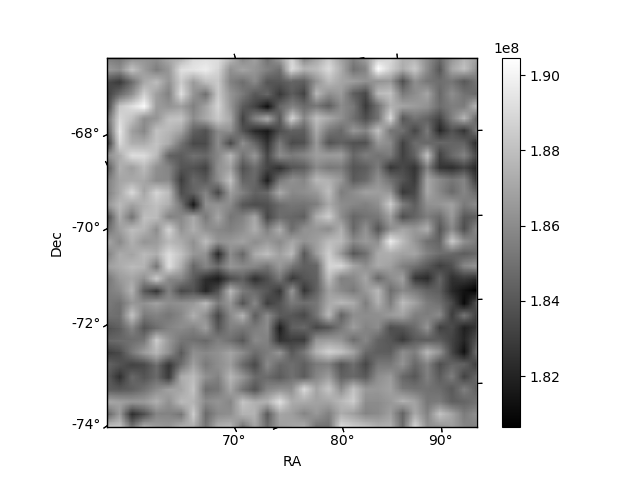
Histogram calculated using DETX and DETY for each event in the final _common_clean file
| Quadrant A | 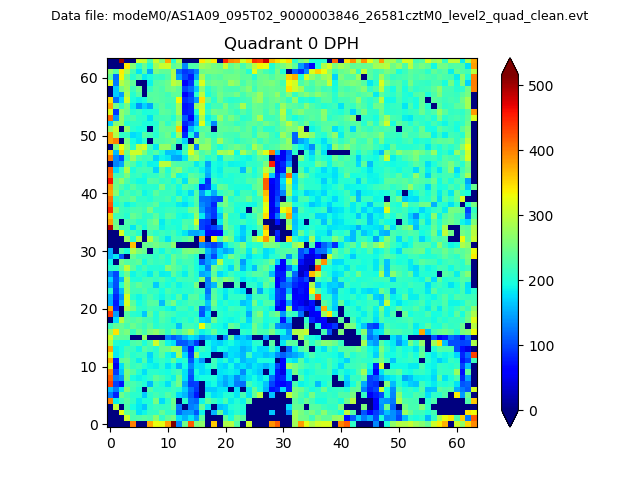 |
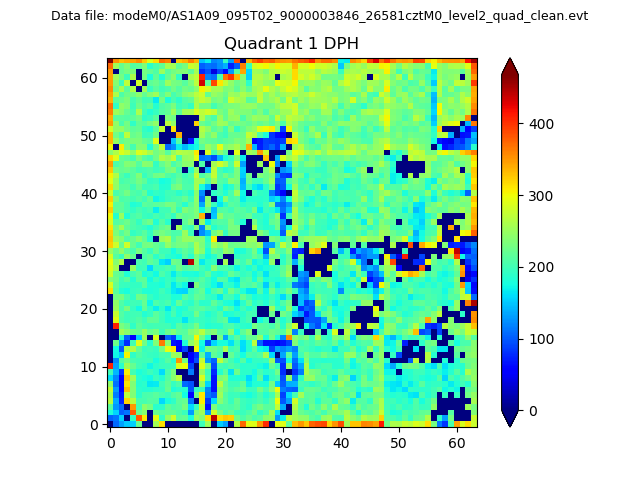 |
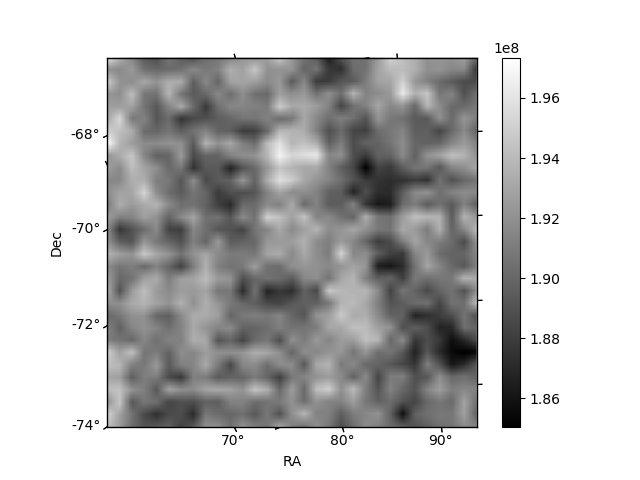
Quadrant B |
|---|---|---|---|
| Quadrant D | 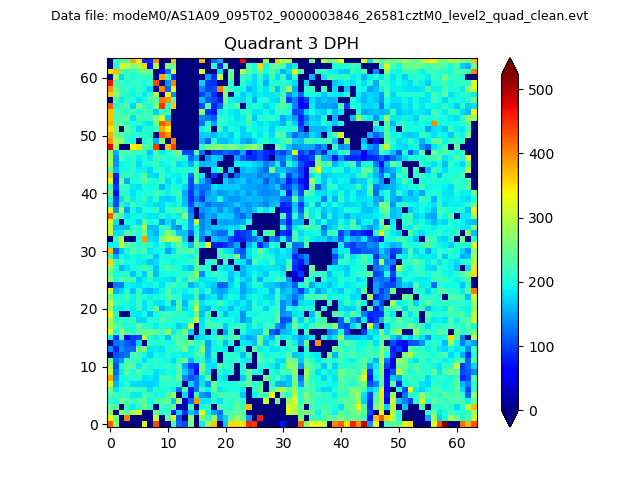 |
 |
Quadrant C |
| Plot type | Count rate plots | Images |
|---|---|---|
| Comparison with Poisson distribution Blue bars denote a histogram of data divided into 1 sec bins. Red curve is a Poisson curve with rate = median count rate of data. |
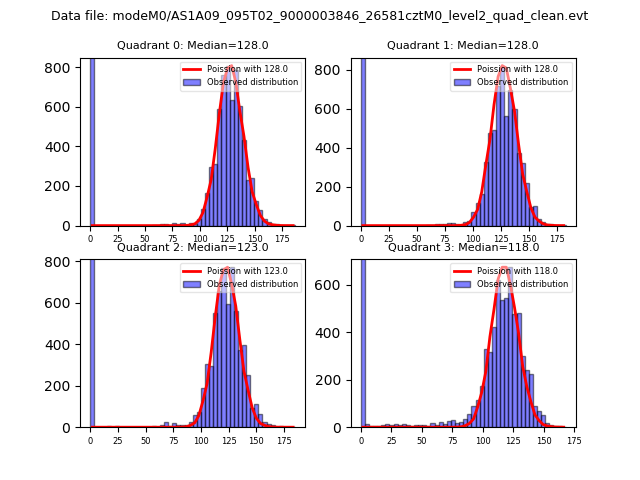 |
 |
| Quadrant-wise count rates Data is divided into 100 sec bins |
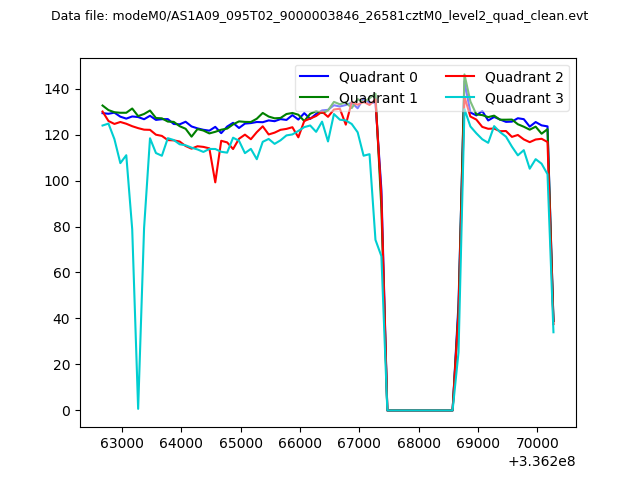 |
|
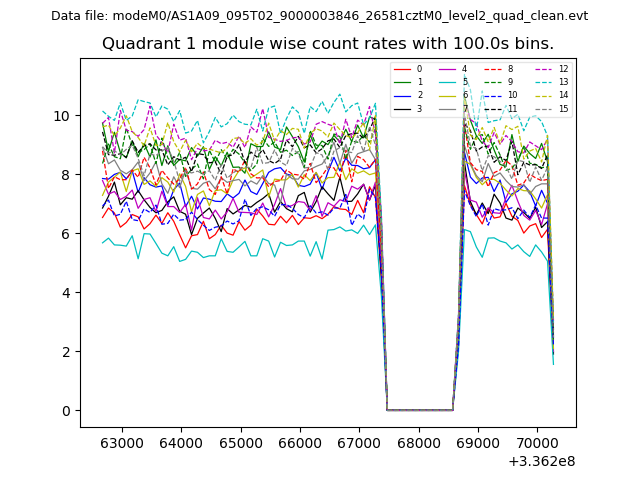
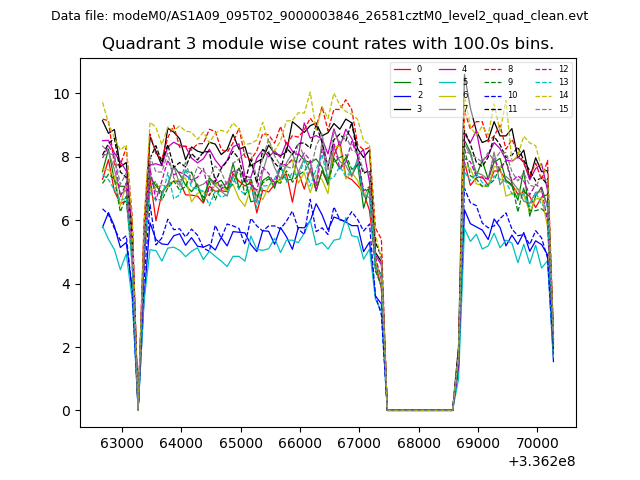
| Module-wise count rates for Quadrant A Data is divided into 100 sec bins |
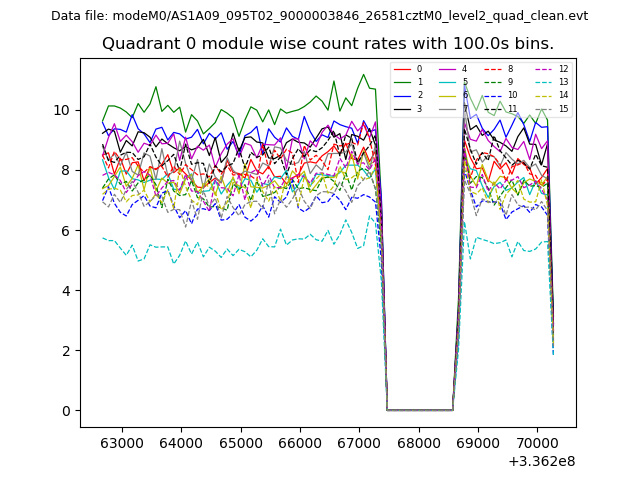 |
 |
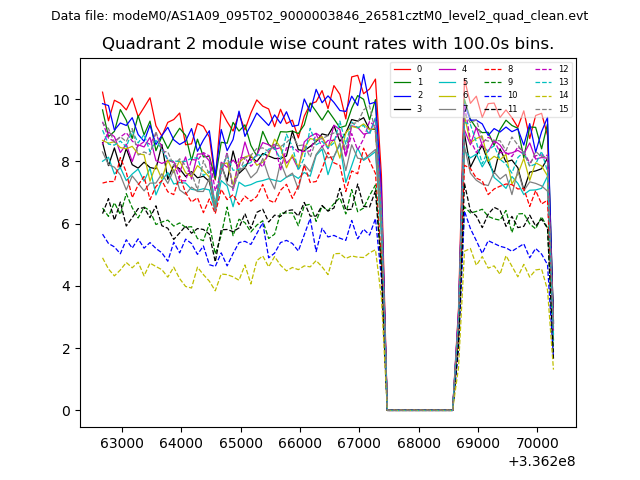
| Module-wise count rates for Quadrant B Data is divided into 100 sec bins |
 |
 |
| Module-wise count rates for Quadrant C Data is divided into 100 sec bins |
 |
 |
| Module-wise count rates for Quadrant D Data is divided into 100 sec bins |
 |
 |
| Parameter | Plot |
|---|---|
| CZT HV Monitor | 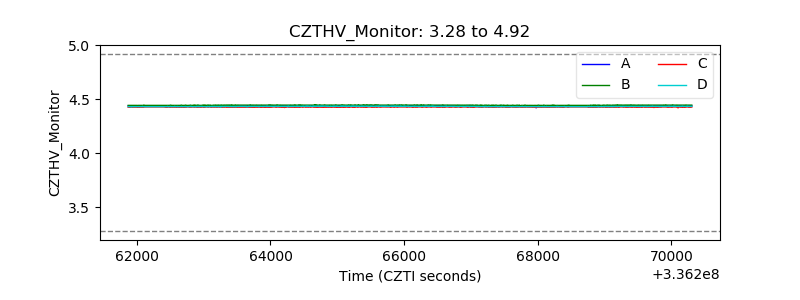 |
| D_VDD | 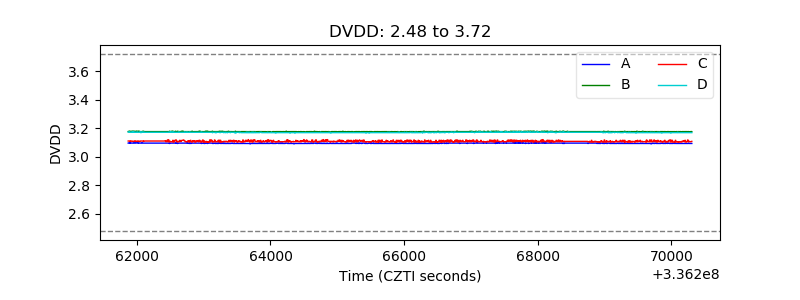 |
| Temperature 1 | 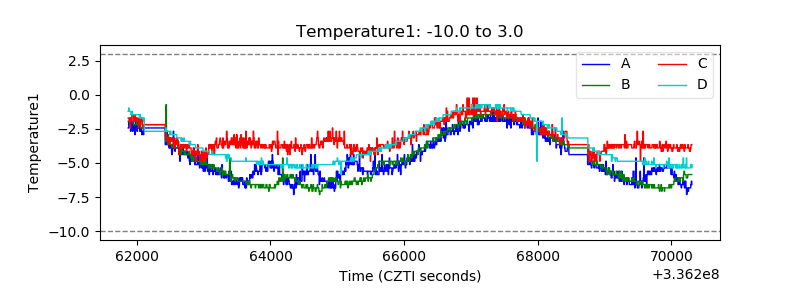 |
| Veto HV Monitor | 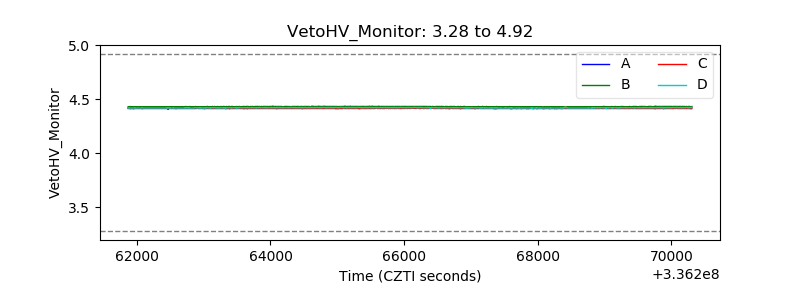 |
| Veto LLD | 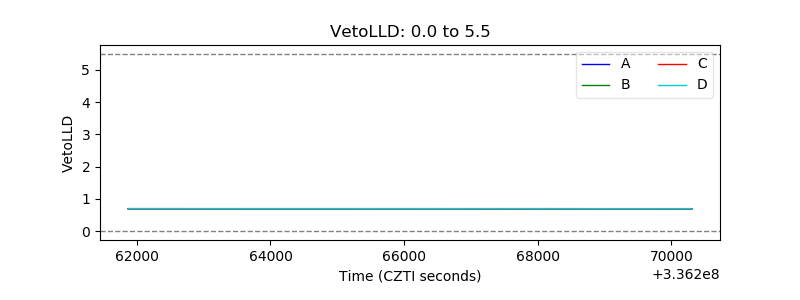 |
| Alpha Counter | 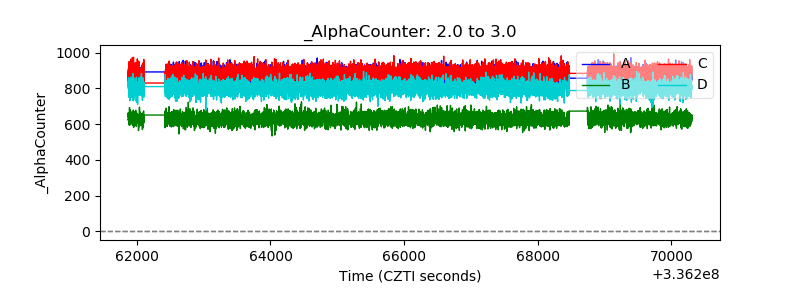 |
| _CPM_Rate |  |
| CZT Counter | 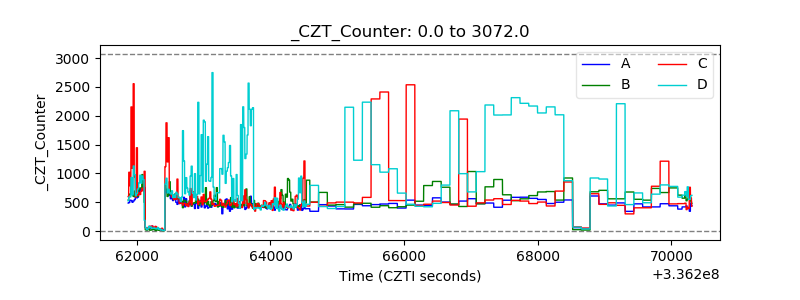 |
| +2.5 Volts monitor | 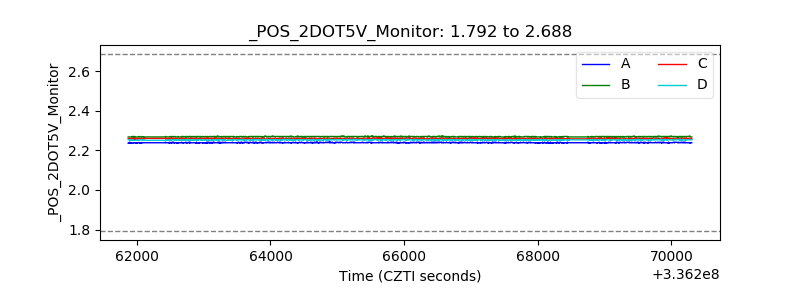 |
| +5 Volts monitor |  |
| _ROLL_ROT | 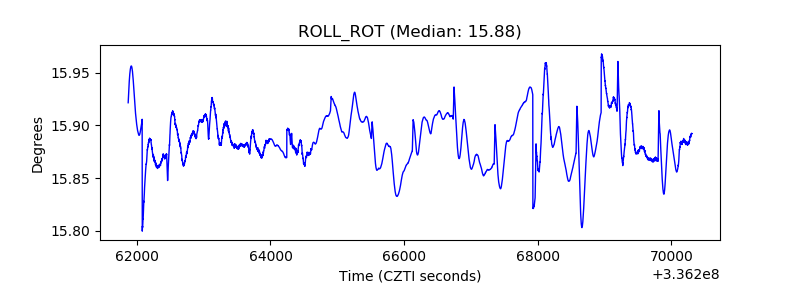 |
| _Roll_DEC | 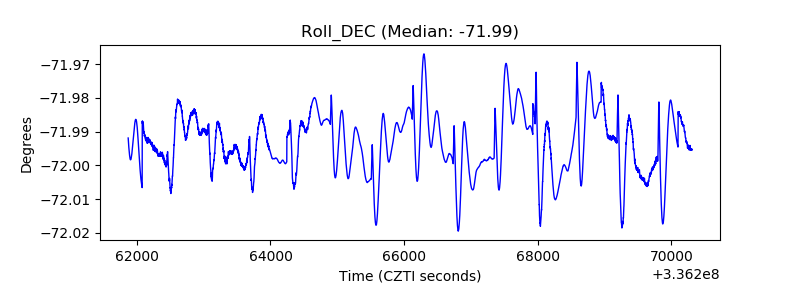 |
| _Roll_RA | 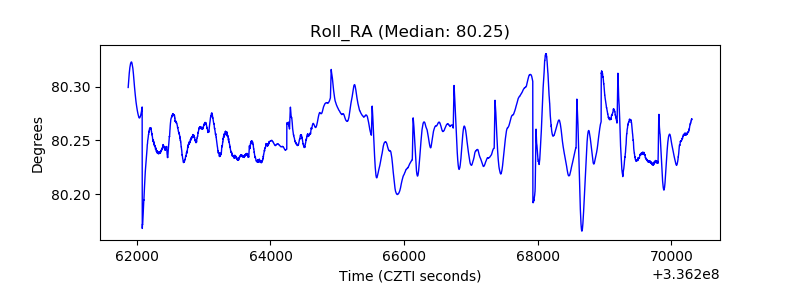 |
| Veto Counter | 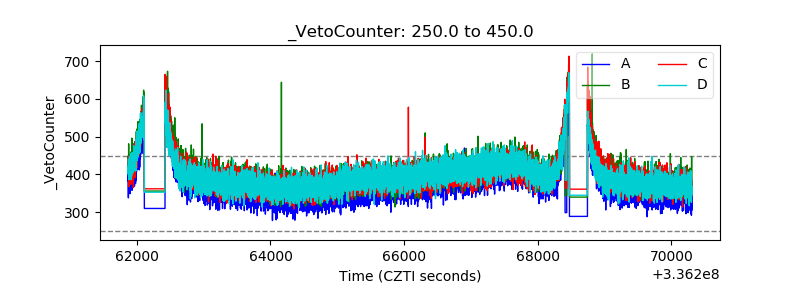 |