| Param | Original file | Final file |
|---|---|---|
| Filename | modeM0/AS1A09_095T02_9000003846_26587cztM0_level2.evt | modeM0/AS1A09_095T02_9000003846_26587cztM0_level2_quad_clean.evt |
| Size (bytes) | 1,661,178,240 | 284,359,680 |
| Size | 1.5 GB | 271.2 MB |
| Events in quadrant A | 9,025,707 | 1,887,419 |
| Events in quadrant B | 12,864,035 | 1,885,592 |
| Events in quadrant C | 13,076,571 | 1,764,173 |
| Events in quadrant D | 14,082,541 | 1,787,124 |
| Mode M9 | |||
|---|---|---|---|
| Quadrant | BADHDUFLAG | Total packets | Discarded packets |
| A | 0 | 22 | 0 |
| B | 0 | 22 | 0 |
| C | 0 | 22 | 0 |
| D | 0 | 22 | 0 |
| Mode M0 | |||
|---|---|---|---|
| Quadrant | BADHDUFLAG | Total packets | Discarded packets |
| A | 0 | 38808 | 0 |
| B | 0 | 51342 | 0 |
| C | 0 | 50677 | 0 |
| D | 0 | 54473 | 0 |
| Quadrant | Total seconds | Saturated seconds | Saturation percentage |
|---|---|---|---|
| A | 18700 | 175 | 0.935829% |
| B | 18700 | 615 | 3.288770% |
| C | 18700 | 1723 | 9.213904% |
| D | 18701 | 1541 | 8.240201% |
Noise dominated data is calculated using 1-second bins in cleaned event files. If a bin has >2000 counts, and if more than 50% of those come from <1% of pixels, then it is considered to be noise-dominated and hence unusable.
| Quadrant | # 1 sec bins | Bins with >0 counts | Bins with >2000 counts | High rate bins dominated by noise | Noise dominated (total time) | Noise dominated (detector-on time) | Marked lightcurve |
|---|---|---|---|---|---|---|---|
| A | 20840 | 18701 | 21 | 21 | 0.10% | 0.11% | 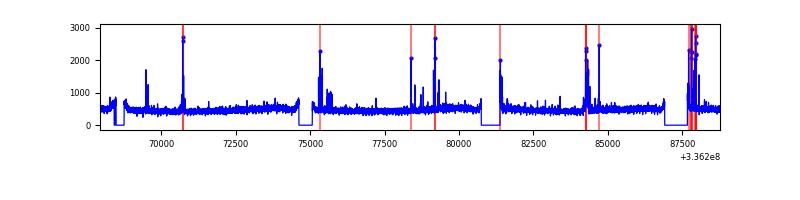 |
| B | 20840 | 18703 | 239 | 239 | 1.15% | 1.28% | 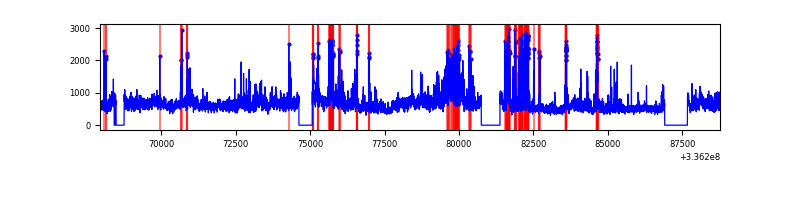 |
| C | 20840 | 18700 | 1050 | 1050 | 5.04% | 5.61% | 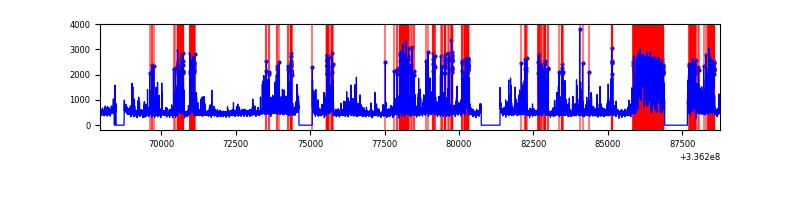 |
| D | 20841 | 18702 | 1351 | 1351 | 6.48% | 7.22% | 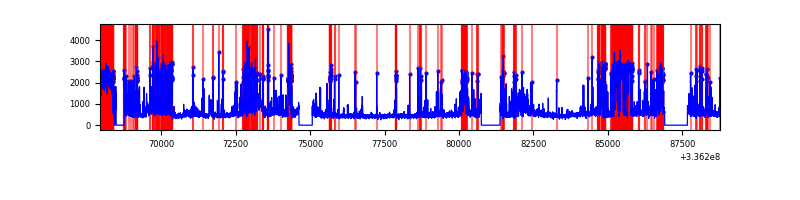 |
Top three noisy pixels from each quadrant. If the there are fewer than three noisy pixels in the level2.evt file, extra rows are filled as -1
| Pixel properties | Quadrant properties | ||||||
|---|---|---|---|---|---|---|---|
| Quadrant | DetID | PixID | Counts | Sigma | Mean | Median | Sigma |
| A | 0 | 13 | 332351 | 744.11 | 2228 | 2175 | 443.7 |
| A | 5 | 168 | 102873 | 226.94 | 2228 | 2175 | 443.7 |
| A | 13 | 254 | 30401 | 63.61 | 2228 | 2175 | 443.7 |
| B | 0 | 189 | 2776572 | 6729.45 | 2200 | 2147 | 412.3 |
| B | 3 | 64 | 964688 | 2334.67 | 2200 | 2147 | 412.3 |
| B | 3 | 112 | 226797 | 544.9 | 2200 | 2147 | 412.3 |
| C | 4 | 254 | 4263759 | 8767.89 | 2080 | 2091 | 486.1 |
| C | 3 | 233 | 332988 | 680.78 | 2080 | 2091 | 486.1 |
| C | 14 | 238 | 330977 | 676.65 | 2080 | 2091 | 486.1 |
| D | 7 | 80 | 4333396 | 8485.62 | 2110 | 2051 | 510.4 |
| D | 1 | 52 | 870940 | 1702.26 | 2110 | 2051 | 510.4 |
| D | 2 | 250 | 568414 | 1109.57 | 2110 | 2051 | 510.4 |
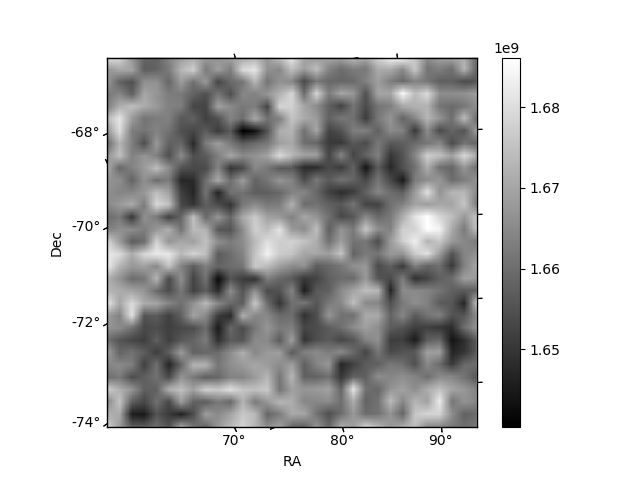
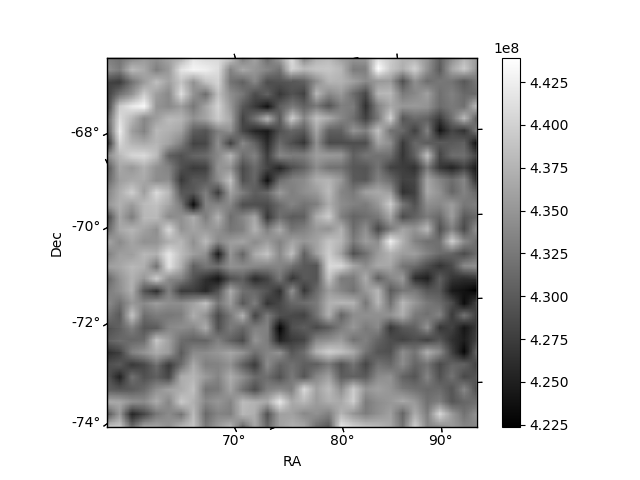
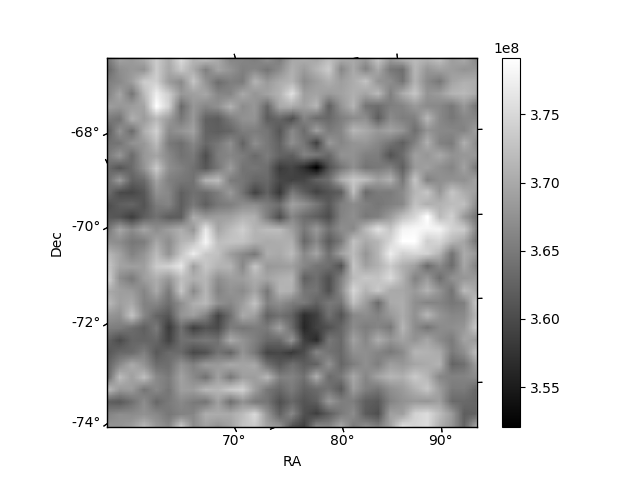
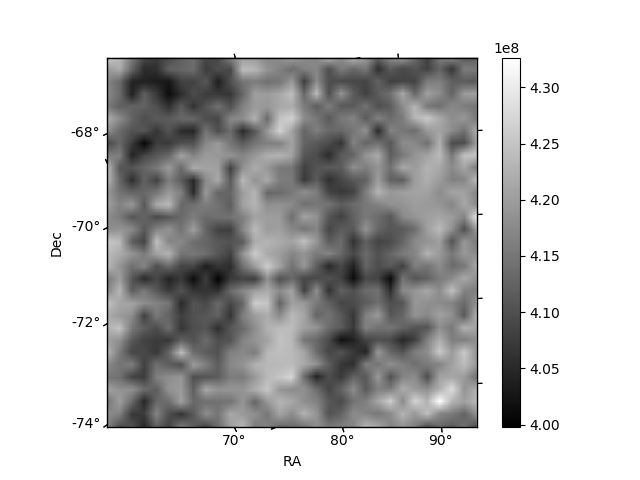
Histogram calculated using DETX and DETY for each event in the final _common_clean file
| Quadrant A | 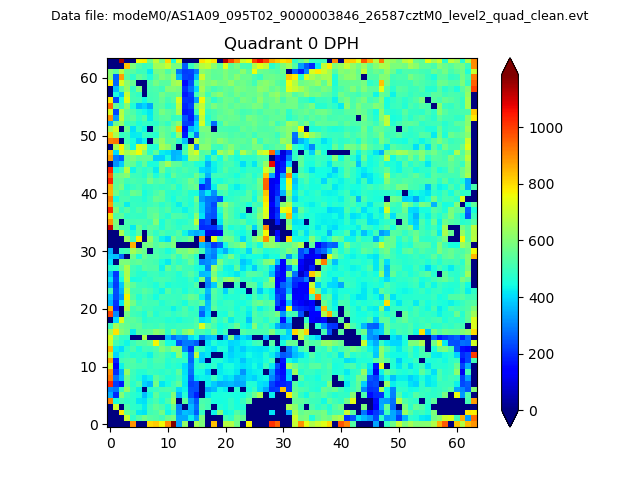 |
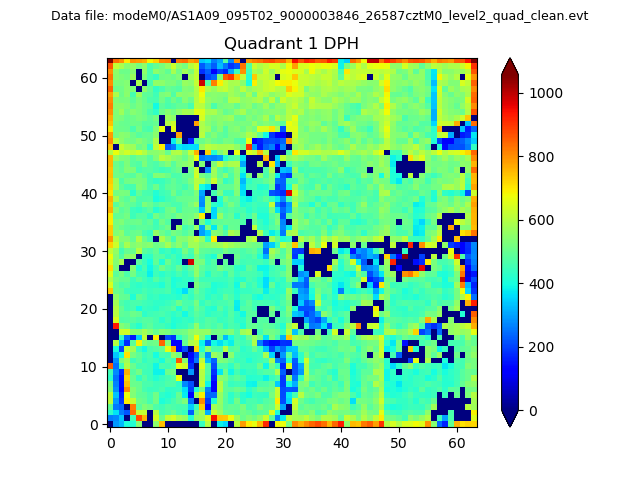 |
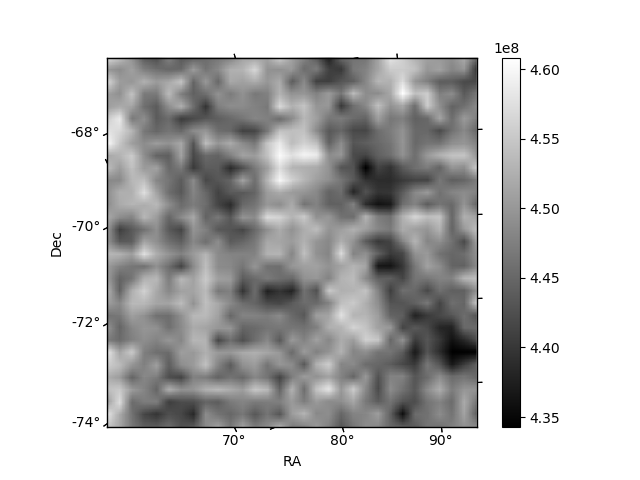
Quadrant B |
|---|---|---|---|
| Quadrant D | 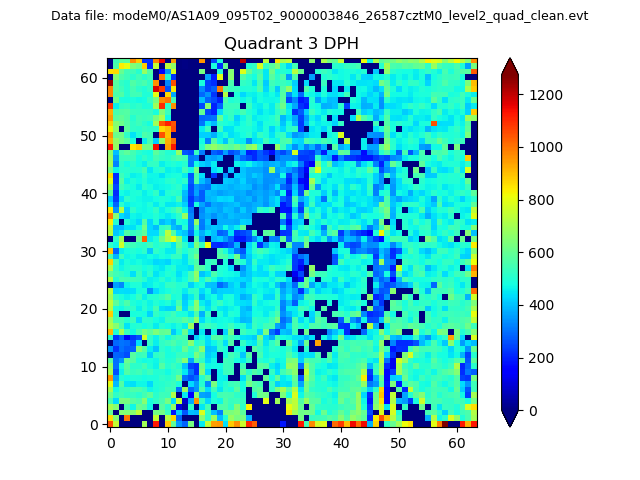 |
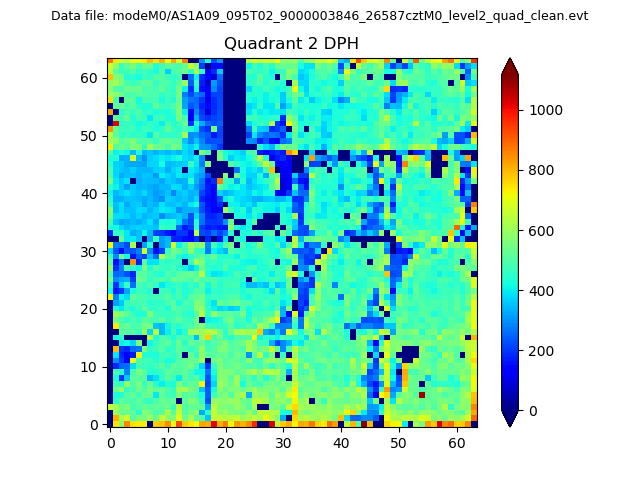 |
Quadrant C |
| Plot type | Count rate plots | Images |
|---|---|---|
| Comparison with Poisson distribution Blue bars denote a histogram of data divided into 1 sec bins. Red curve is a Poisson curve with rate = median count rate of data. |
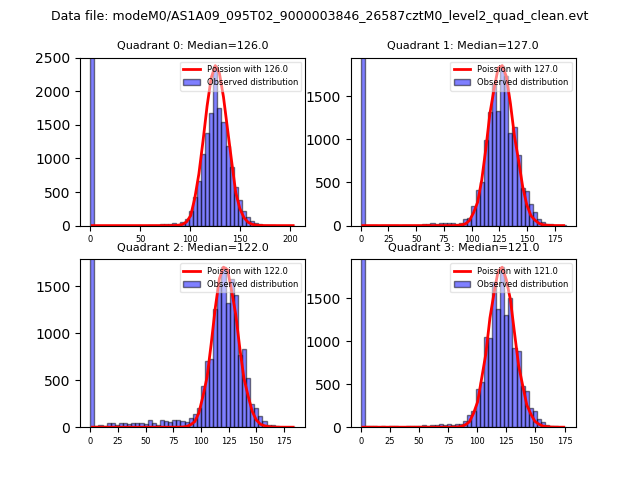 |
 |
| Quadrant-wise count rates Data is divided into 100 sec bins |
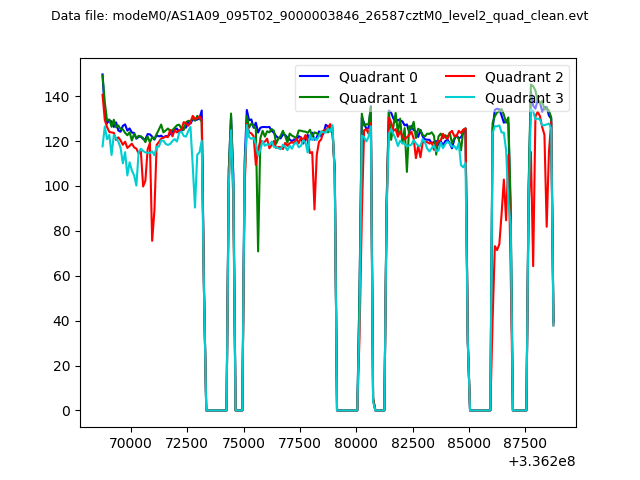 |
|
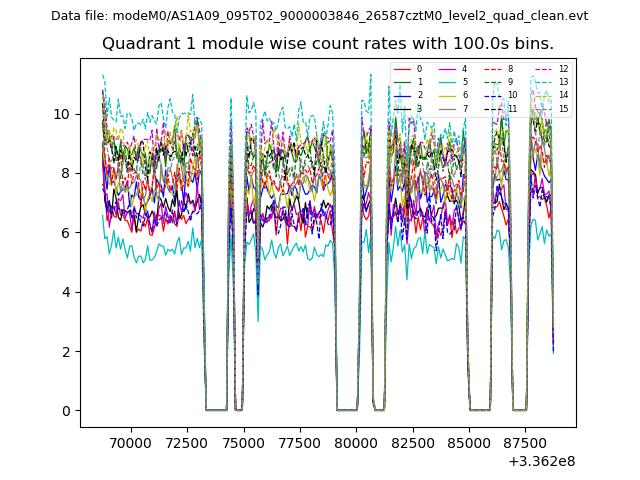
| Module-wise count rates for Quadrant A Data is divided into 100 sec bins |
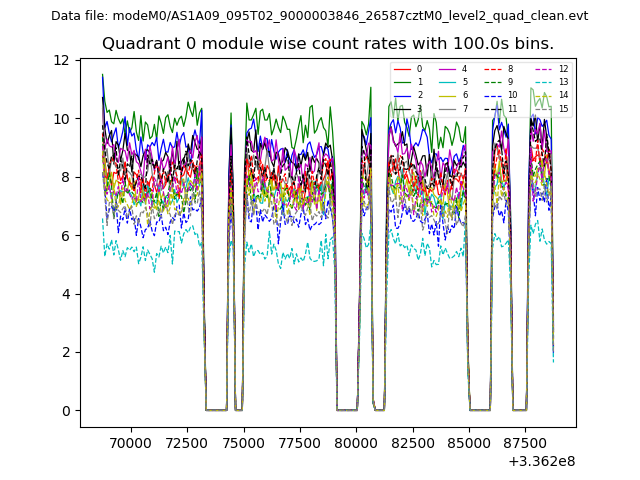 |
 |
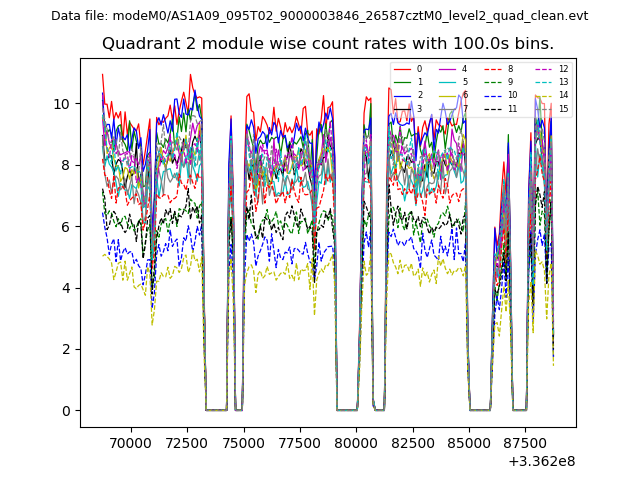
| Module-wise count rates for Quadrant B Data is divided into 100 sec bins |
 |
 |
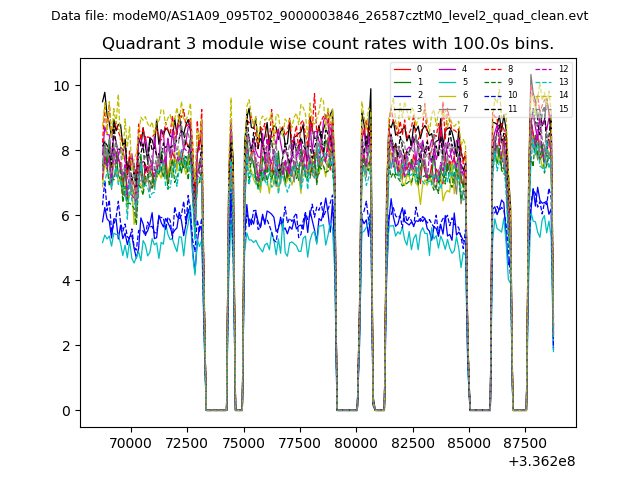
| Module-wise count rates for Quadrant C Data is divided into 100 sec bins |
 |
 |
| Module-wise count rates for Quadrant D Data is divided into 100 sec bins |
 |
 |
| Parameter | Plot |
|---|---|
| CZT HV Monitor | 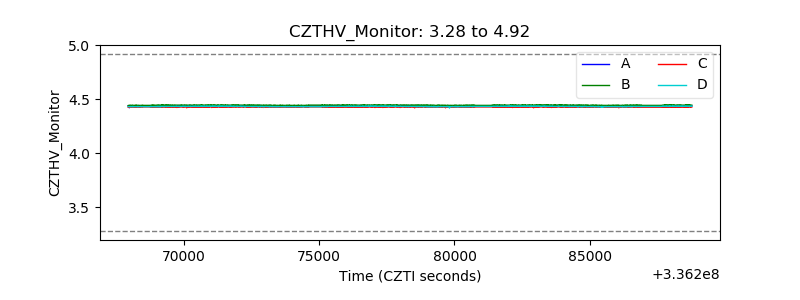 |
| D_VDD | 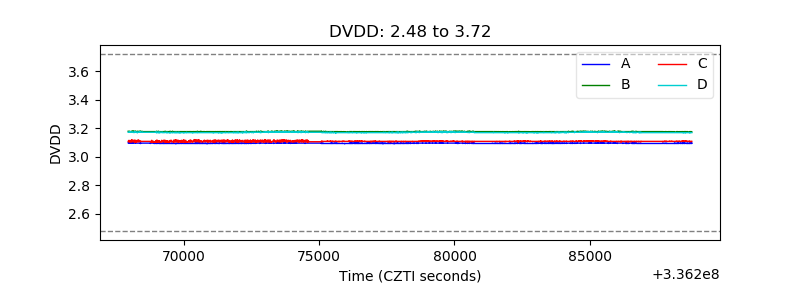 |
| Temperature 1 | 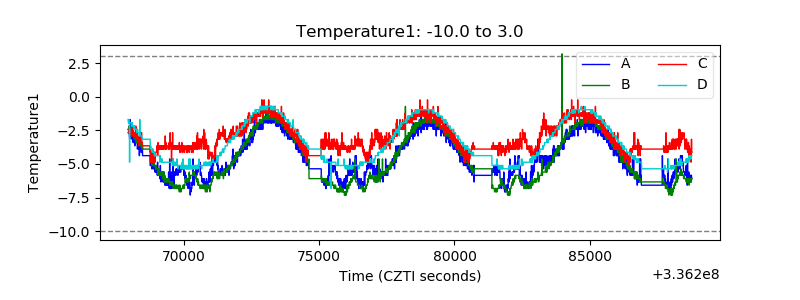 |
| Veto HV Monitor | 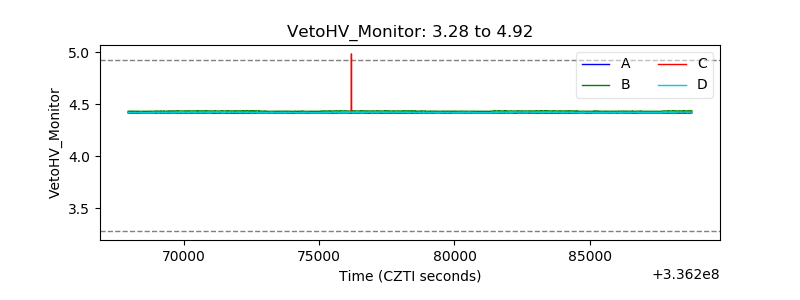 |
| Veto LLD | 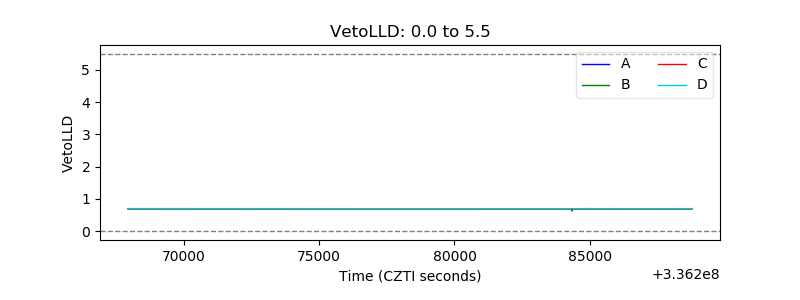 |
| Alpha Counter |  |
| _CPM_Rate | 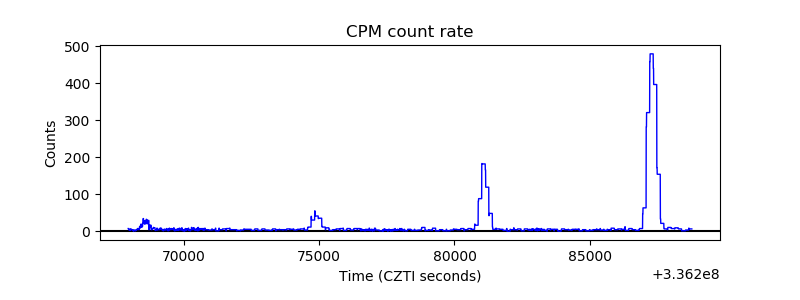 |
| CZT Counter | 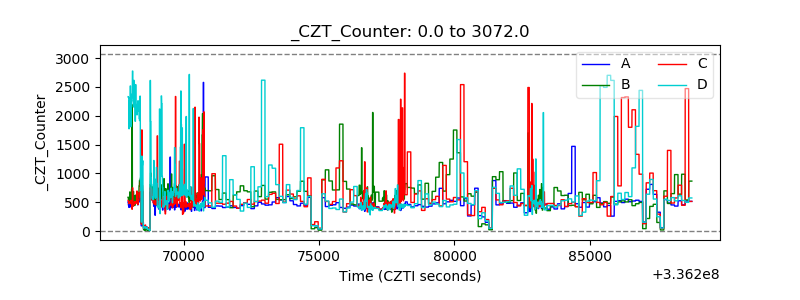 |
| +2.5 Volts monitor | 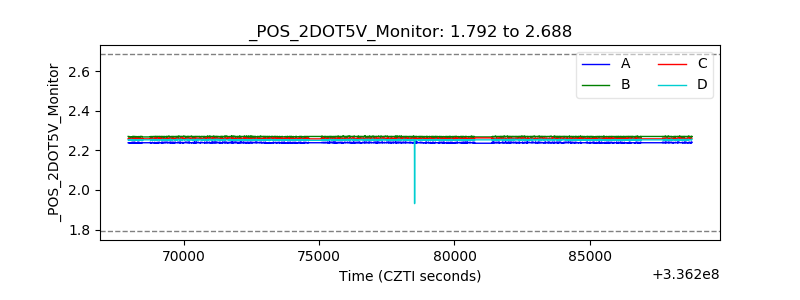 |
| +5 Volts monitor |  |
| _ROLL_ROT | 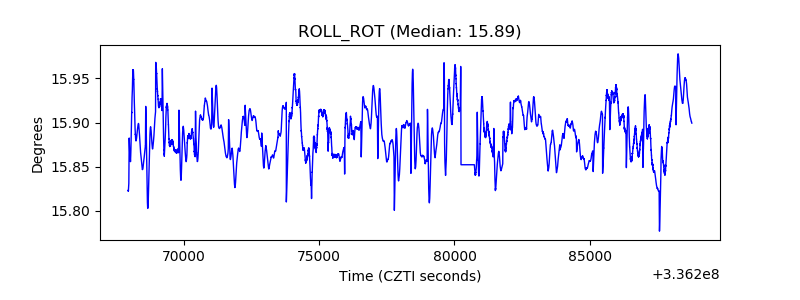 |
| _Roll_DEC | 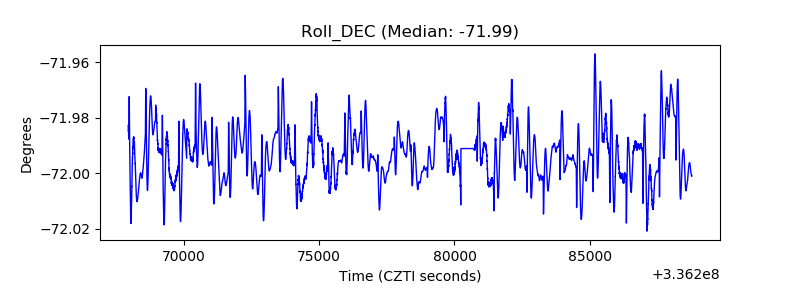 |
| _Roll_RA | 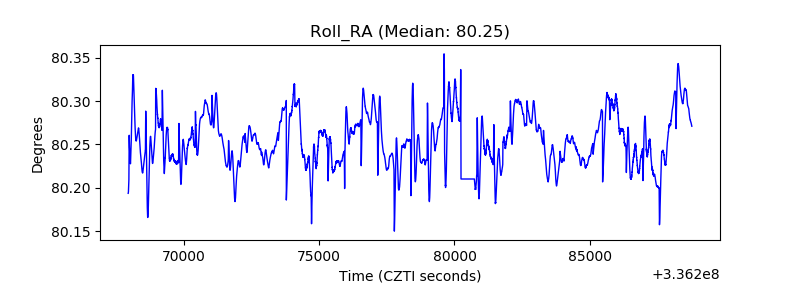 |
| Veto Counter | 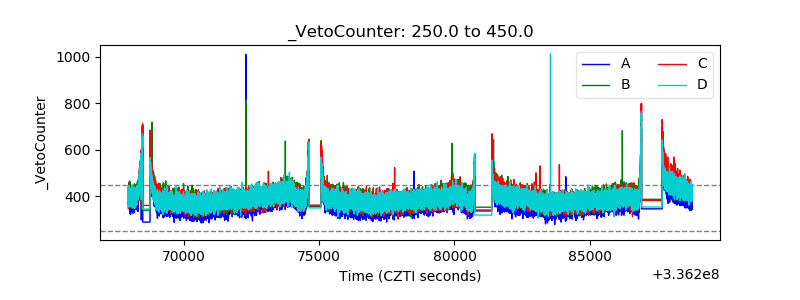 |