| Param | Original file | Final file |
|---|---|---|
| Filename | modeM0/AS1A09_095T02_9000003846_26588cztM0_level2.evt | modeM0/AS1A09_095T02_9000003846_26588cztM0_level2_quad_clean.evt |
| Size (bytes) | 1,507,420,800 | 278,395,200 |
| Size | 1.4 GB | 265.5 MB |
| Events in quadrant A | 8,609,718 | 1,878,866 |
| Events in quadrant B | 10,592,902 | 1,892,449 |
| Events in quadrant C | 10,175,287 | 1,818,801 |
| Events in quadrant D | 15,164,054 | 1,705,124 |
| Mode M9 | |||
|---|---|---|---|
| Quadrant | BADHDUFLAG | Total packets | Discarded packets |
| A | 0 | 33 | 0 |
| B | 0 | 33 | 0 |
| C | 0 | 33 | 0 |
| D | 0 | 33 | 0 |
| Mode M0 | |||
|---|---|---|---|
| Quadrant | BADHDUFLAG | Total packets | Discarded packets |
| A | 0 | 36044 | 0 |
| B | 0 | 42304 | 0 |
| C | 0 | 40896 | 0 |
| D | 0 | 56171 | 0 |
| Quadrant | Total seconds | Saturated seconds | Saturation percentage |
|---|---|---|---|
| A | 16487 | 163 | 0.988658% |
| B | 16487 | 375 | 2.274519% |
| C | 16487 | 643 | 3.900042% |
| D | 16488 | 2058 | 12.481805% |
Noise dominated data is calculated using 1-second bins in cleaned event files. If a bin has >2000 counts, and if more than 50% of those come from <1% of pixels, then it is considered to be noise-dominated and hence unusable.
| Quadrant | # 1 sec bins | Bins with >0 counts | Bins with >2000 counts | High rate bins dominated by noise | Noise dominated (total time) | Noise dominated (detector-on time) | Marked lightcurve |
|---|---|---|---|---|---|---|---|
| A | 19732 | 16487 | 67 | 67 | 0.34% | 0.41% | 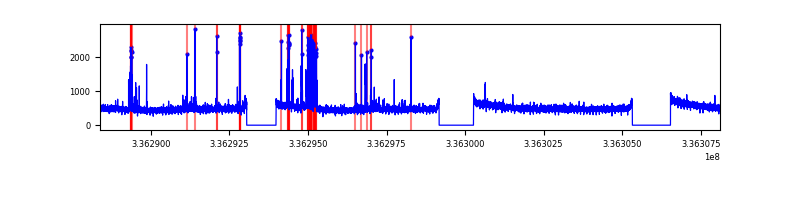 |
| B | 19732 | 16487 | 205 | 205 | 1.04% | 1.24% | 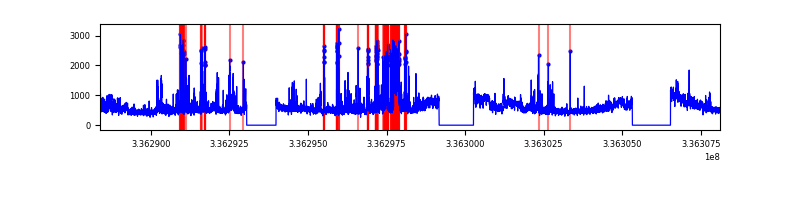 |
| C | 19732 | 16487 | 257 | 257 | 1.30% | 1.56% | 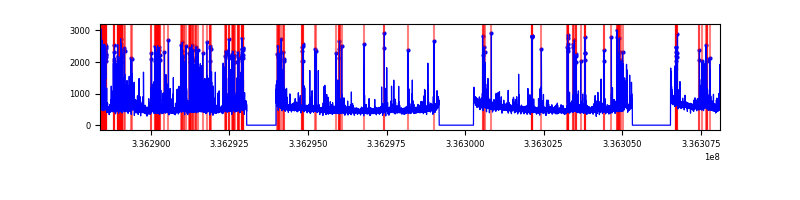 |
| D | 19733 | 16488 | 2015 | 2015 | 10.21% | 12.22% | 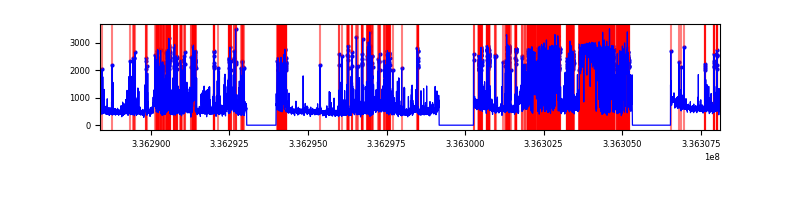 |
Top three noisy pixels from each quadrant. If the there are fewer than three noisy pixels in the level2.evt file, extra rows are filled as -1
| Pixel properties | Quadrant properties | ||||||
|---|---|---|---|---|---|---|---|
| Quadrant | DetID | PixID | Counts | Sigma | Mean | Median | Sigma |
| A | 0 | 13 | 527546 | 1291.54 | 2065 | 2025 | 406.9 |
| A | 5 | 168 | 116690 | 281.81 | 2065 | 2025 | 406.9 |
| A | 13 | 254 | 26762 | 60.79 | 2065 | 2025 | 406.9 |
| B | 3 | 64 | 1260424 | 3364.16 | 2027 | 1978 | 374.1 |
| B | 0 | 189 | 1134342 | 3027.11 | 2027 | 1978 | 374.1 |
| B | 3 | 112 | 135555 | 357.09 | 2027 | 1978 | 374.1 |
| C | 4 | 254 | 1284035 | 2858.36 | 1961 | 1974 | 448.5 |
| C | 3 | 233 | 490389 | 1088.92 | 1961 | 1974 | 448.5 |
| C | 15 | 208 | 378099 | 838.57 | 1961 | 1974 | 448.5 |
| D | 7 | 80 | 5646676 | 12226.02 | 1925 | 1870 | 461.7 |
| D | 1 | 52 | 1288594 | 2786.9 | 1925 | 1870 | 461.7 |
| D | 2 | 250 | 599856 | 1295.17 | 1925 | 1870 | 461.7 |
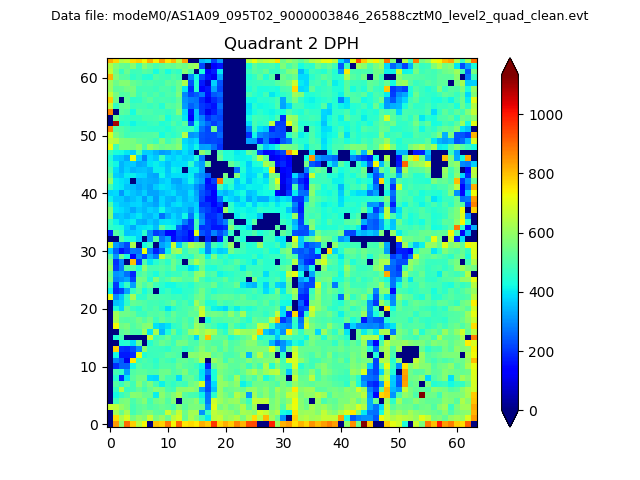
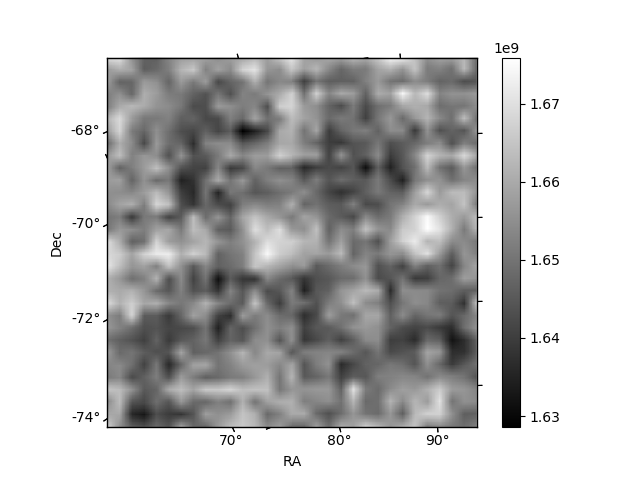
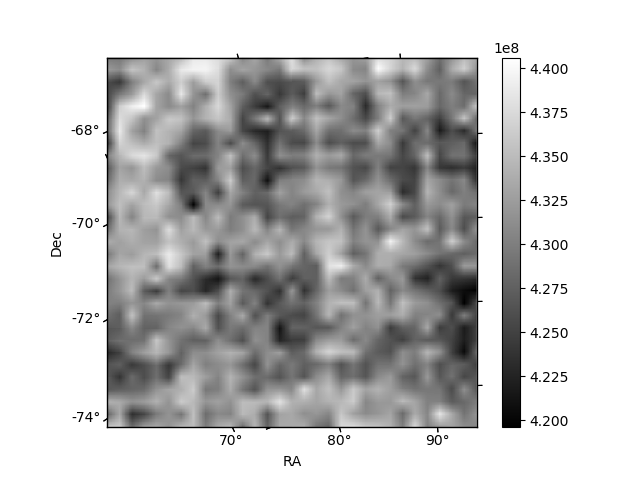
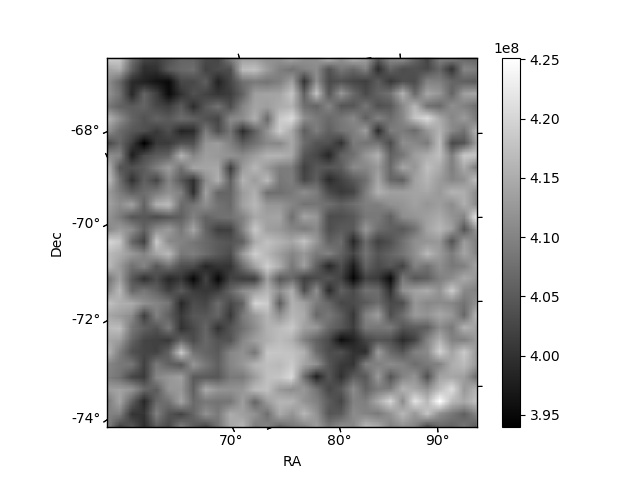
Histogram calculated using DETX and DETY for each event in the final _common_clean file
| Quadrant A | 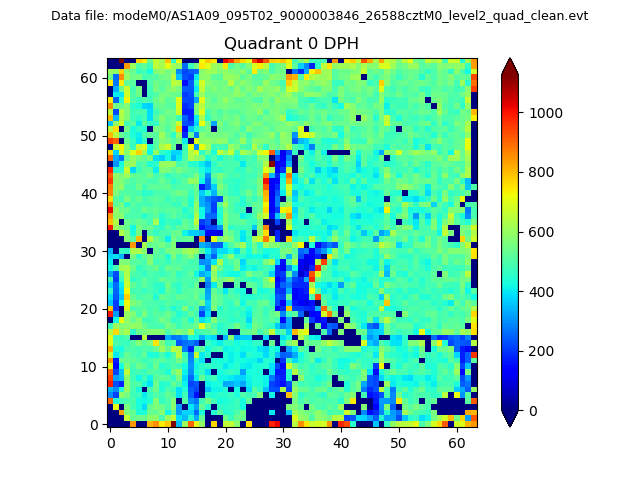 |
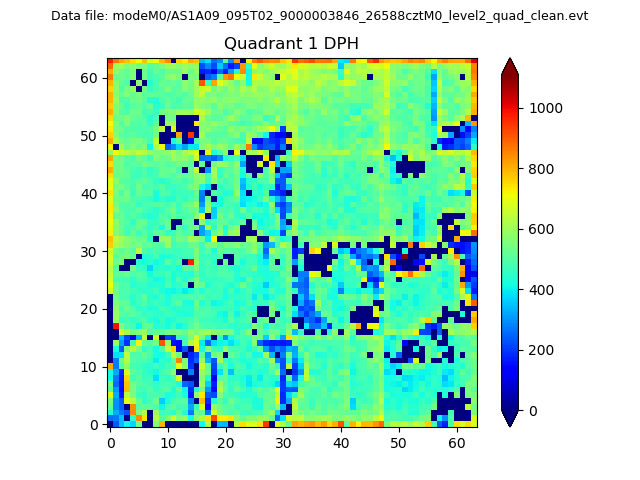 |
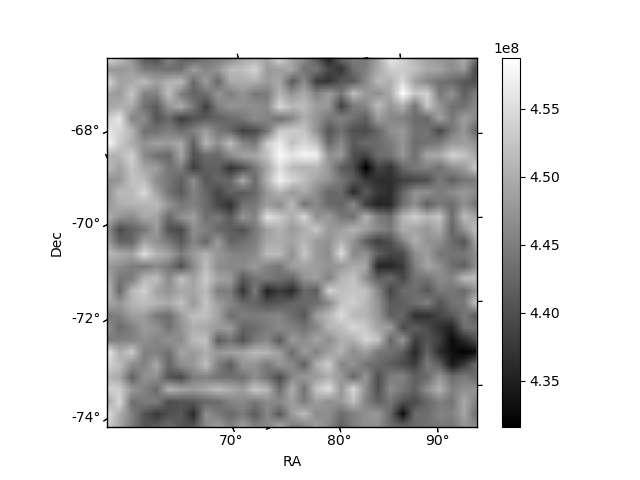
Quadrant B |
|---|---|---|---|
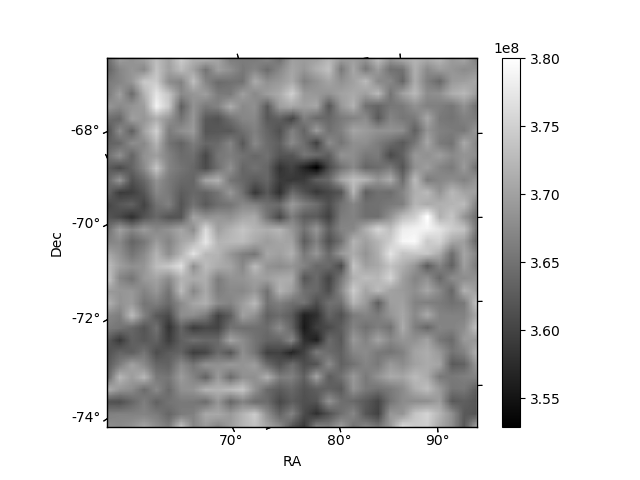
| Quadrant D | 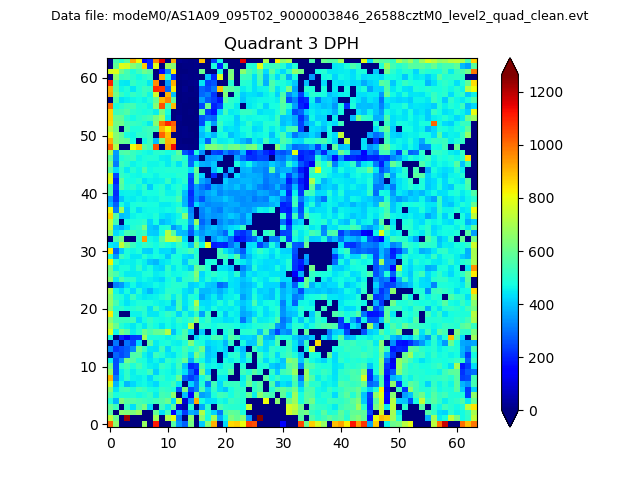 |
 |
Quadrant C |
| Plot type | Count rate plots | Images |
|---|---|---|
| Comparison with Poisson distribution Blue bars denote a histogram of data divided into 1 sec bins. Red curve is a Poisson curve with rate = median count rate of data. |
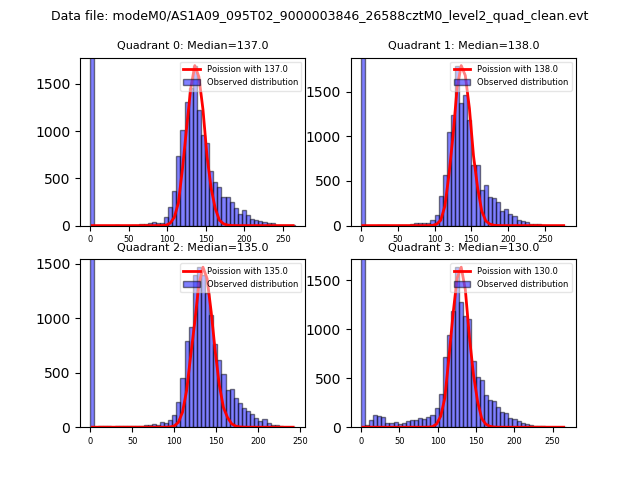 |
 |
| Quadrant-wise count rates Data is divided into 100 sec bins |
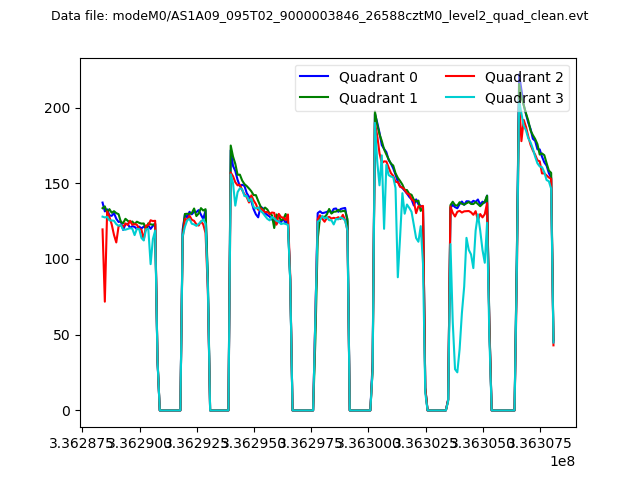 |
|
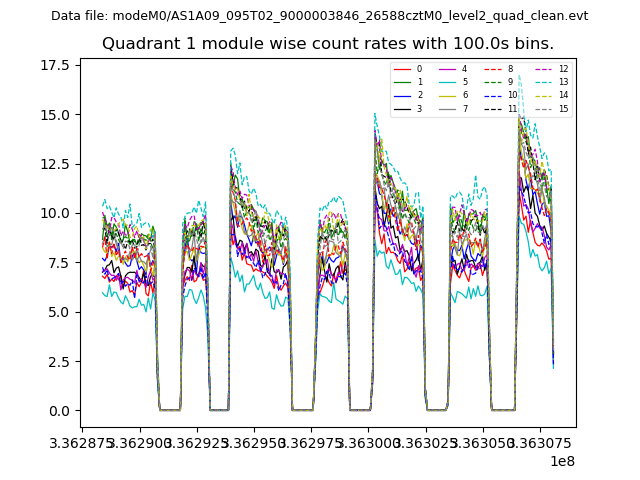
| Module-wise count rates for Quadrant A Data is divided into 100 sec bins |
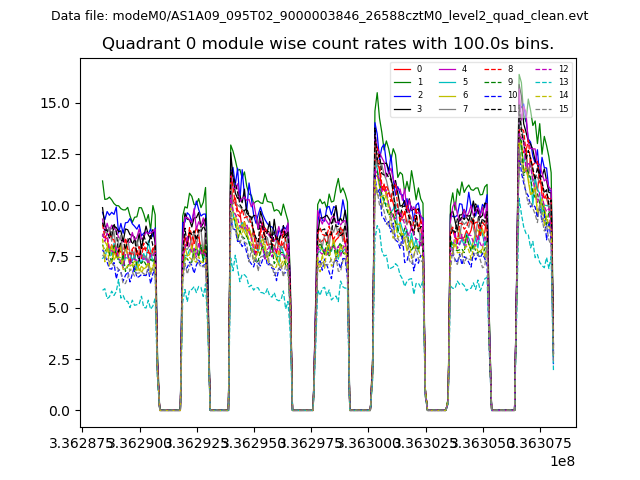 |
 |
| Module-wise count rates for Quadrant B Data is divided into 100 sec bins |
 |
 |
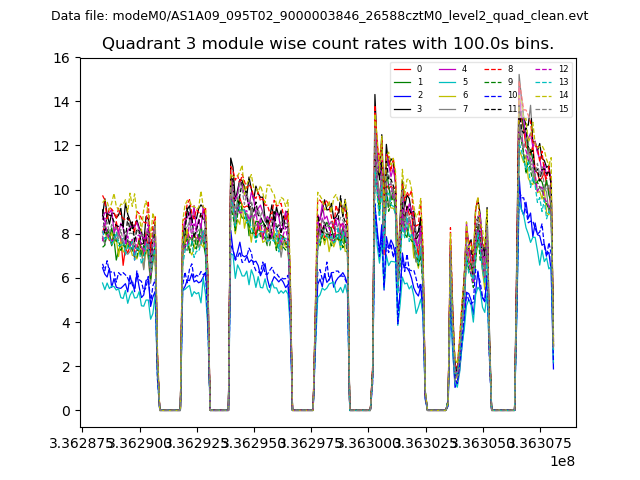
| Module-wise count rates for Quadrant C Data is divided into 100 sec bins |
 |
 |
| Module-wise count rates for Quadrant D Data is divided into 100 sec bins |
 |
 |
| Parameter | Plot |
|---|---|
| CZT HV Monitor | 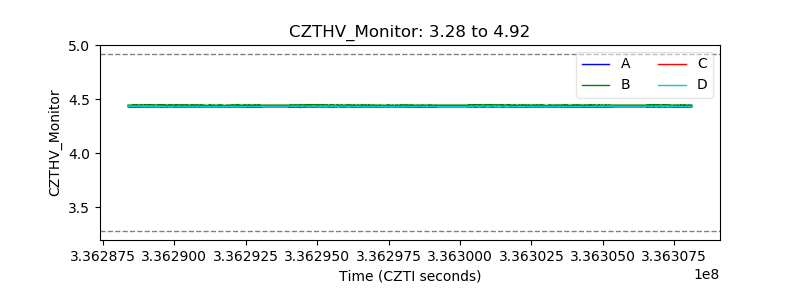 |
| D_VDD | 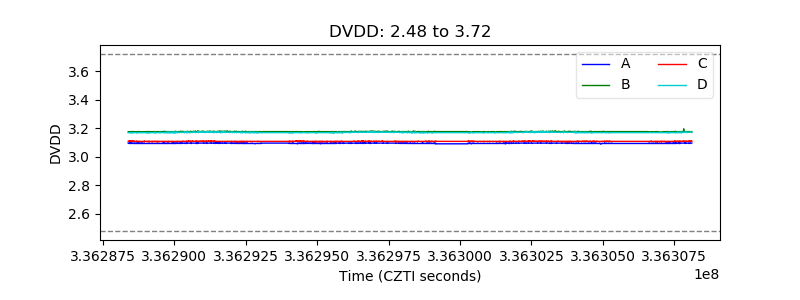 |
| Temperature 1 | 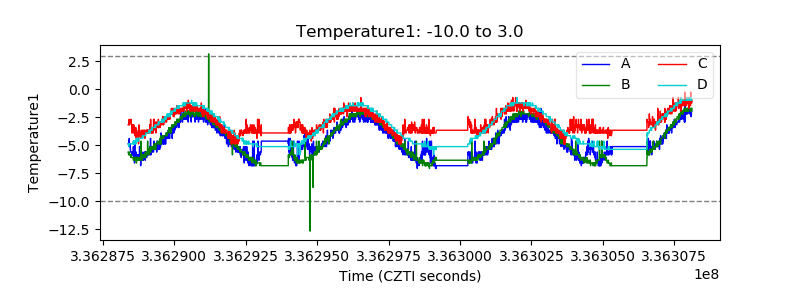 |
| Veto HV Monitor | 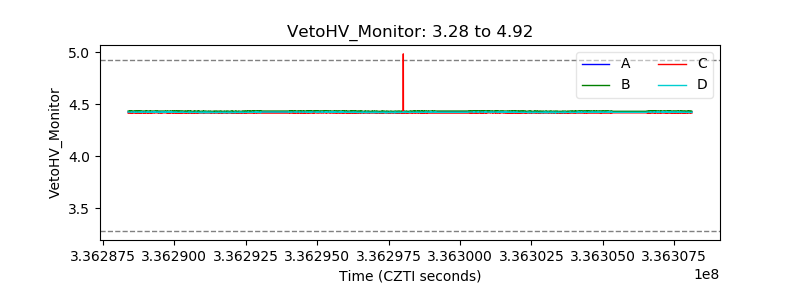 |
| Veto LLD | 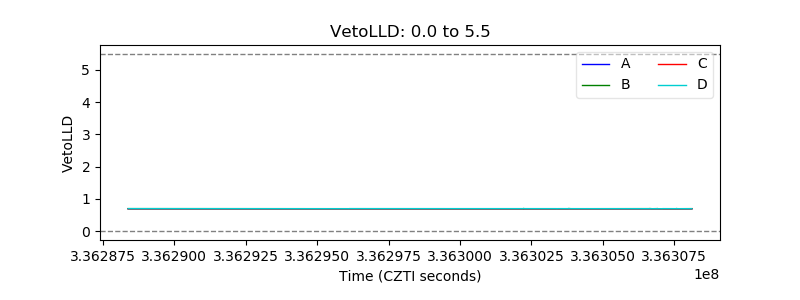 |
| Alpha Counter | 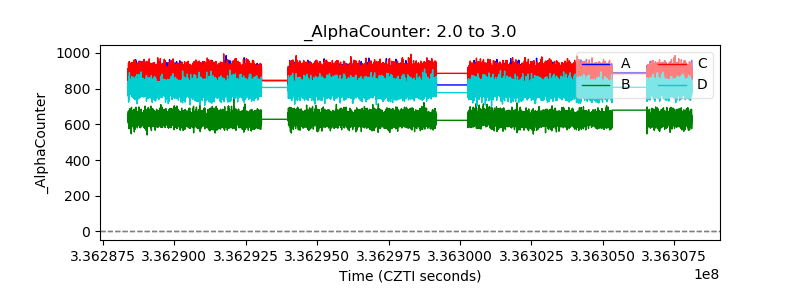 |
| _CPM_Rate | 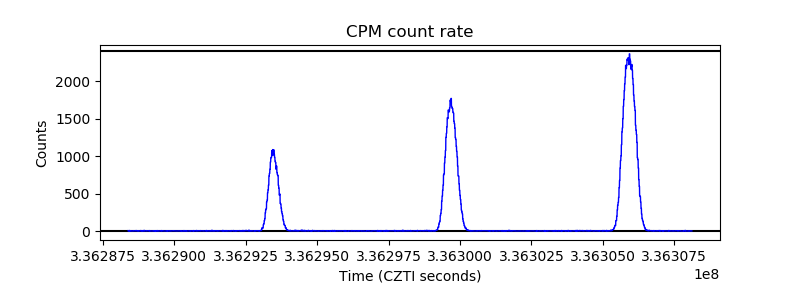 |
| CZT Counter | 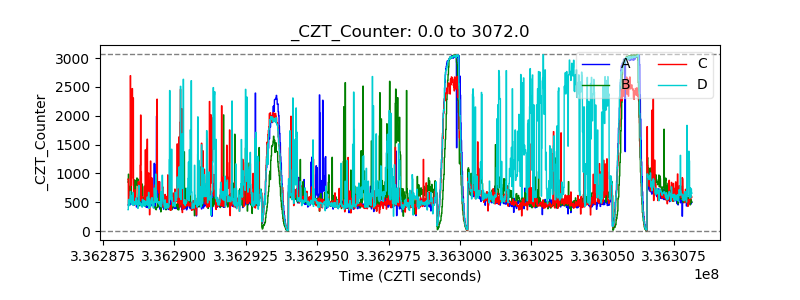 |
| +2.5 Volts monitor |  |
| +5 Volts monitor |  |
| _ROLL_ROT | 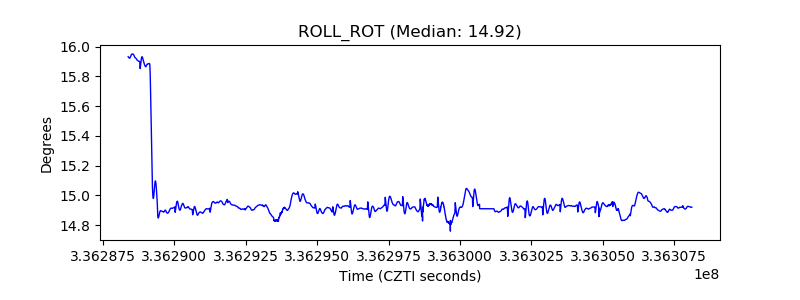 |
| _Roll_DEC | 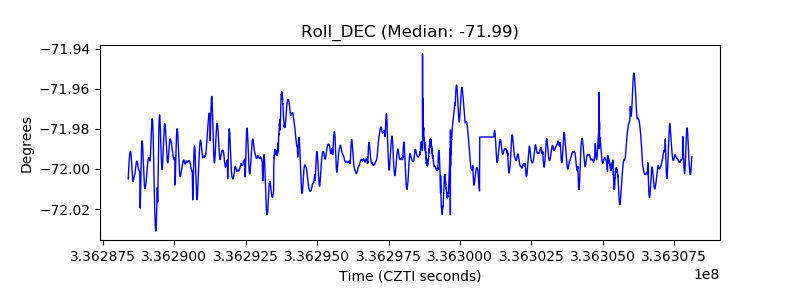 |
| _Roll_RA | 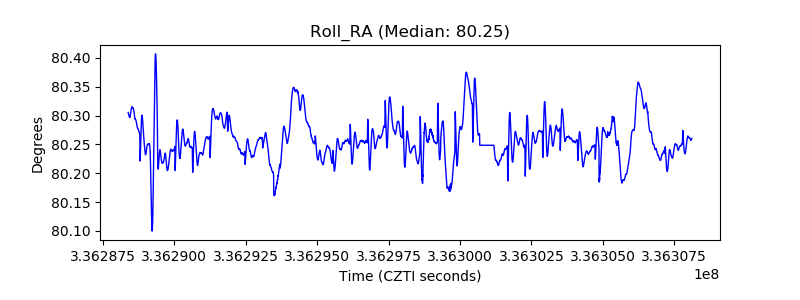 |
| Veto Counter | 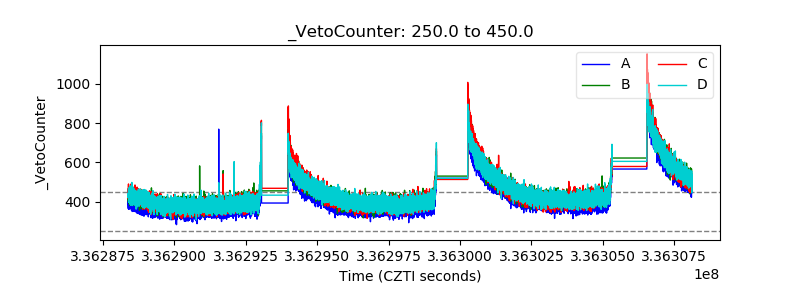 |