| Param | Original file | Final file |
|---|---|---|
| Filename | modeM0/AS1A09_095T02_9000003846_26589cztM0_level2.evt | modeM0/AS1A09_095T02_9000003846_26589cztM0_level2_quad_clean.evt |
| Size (bytes) | 520,194,240 | 117,884,160 |
| Size | 496.1 MB | 112.4 MB |
| Events in quadrant A | 3,320,726 | 807,058 |
| Events in quadrant B | 4,052,578 | 808,701 |
| Events in quadrant C | 3,705,764 | 767,808 |
| Events in quadrant D | 4,258,345 | 757,452 |
| Mode M9 | |||
|---|---|---|---|
| Quadrant | BADHDUFLAG | Total packets | Discarded packets |
| A | 0 | 13 | 0 |
| B | 0 | 13 | 0 |
| C | 0 | 13 | 0 |
| D | 0 | 13 | 0 |
| Mode M0 | |||
|---|---|---|---|
| Quadrant | BADHDUFLAG | Total packets | Discarded packets |
| A | 0 | 13698 | 0 |
| B | 0 | 16123 | 0 |
| C | 0 | 15054 | 0 |
| D | 0 | 16746 | 0 |
| Quadrant | Total seconds | Saturated seconds | Saturation percentage |
|---|---|---|---|
| A | 6154 | 70 | 1.137472% |
| B | 6155 | 133 | 2.160845% |
| C | 6154 | 148 | 2.404940% |
| D | 6154 | 200 | 3.249919% |
Noise dominated data is calculated using 1-second bins in cleaned event files. If a bin has >2000 counts, and if more than 50% of those come from <1% of pixels, then it is considered to be noise-dominated and hence unusable.
| Quadrant | # 1 sec bins | Bins with >0 counts | Bins with >2000 counts | High rate bins dominated by noise | Noise dominated (total time) | Noise dominated (detector-on time) | Marked lightcurve |
|---|---|---|---|---|---|---|---|
| A | 7424 | 6154 | 1 | 1 | 0.01% | 0.02% | 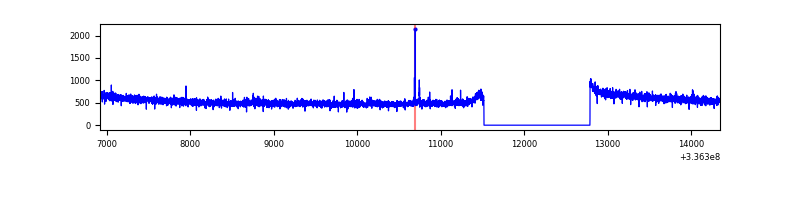 |
| B | 7425 | 6155 | 35 | 35 | 0.47% | 0.57% | 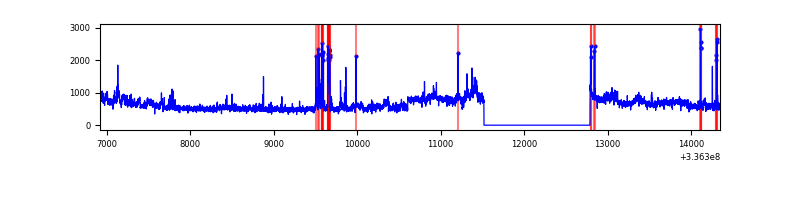 |
| C | 7424 | 6154 | 31 | 31 | 0.42% | 0.50% | 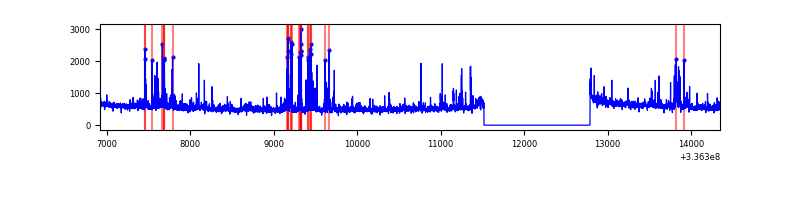 |
| D | 7423 | 6153 | 120 | 120 | 1.62% | 1.95% | 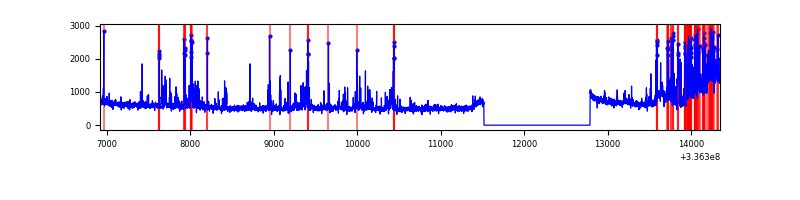 |
Top three noisy pixels from each quadrant. If the there are fewer than three noisy pixels in the level2.evt file, extra rows are filled as -1
| Pixel properties | Quadrant properties | ||||||
|---|---|---|---|---|---|---|---|
| Quadrant | DetID | PixID | Counts | Sigma | Mean | Median | Sigma |
| A | 5 | 168 | 21754 | 125.71 | 848 | 836 | 166.4 |
| A | 0 | 13 | 18044 | 103.41 | 848 | 836 | 166.4 |
| A | 9 | 130 | 12865 | 72.29 | 848 | 836 | 166.4 |
| B | 0 | 189 | 595160 | 3942.75 | 825 | 810 | 150.7 |
| B | 3 | 64 | 154813 | 1021.61 | 825 | 810 | 150.7 |
| B | 0 | 229 | 26327 | 169.27 | 825 | 810 | 150.7 |
| C | 4 | 254 | 259008 | 1439.89 | 793 | 799 | 179.3 |
| C | 14 | 238 | 131502 | 728.86 | 793 | 799 | 179.3 |
| C | 15 | 208 | 111662 | 618.22 | 793 | 799 | 179.3 |
| D | 1 | 52 | 468616 | 2368.94 | 817 | 793 | 197.5 |
| D | 7 | 80 | 433987 | 2193.58 | 817 | 793 | 197.5 |
| D | 2 | 250 | 155753 | 784.68 | 817 | 793 | 197.5 |
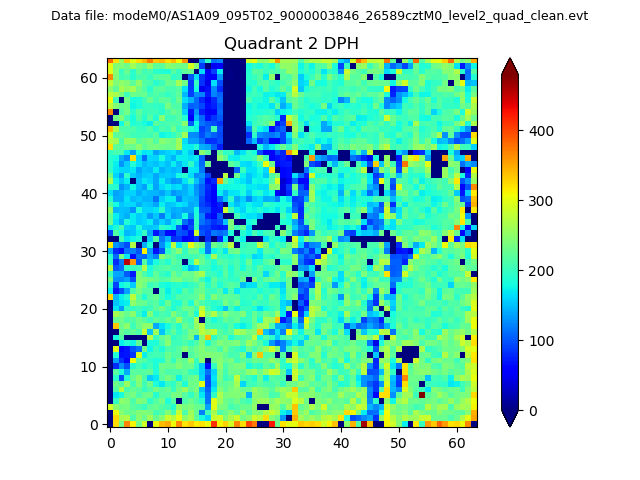
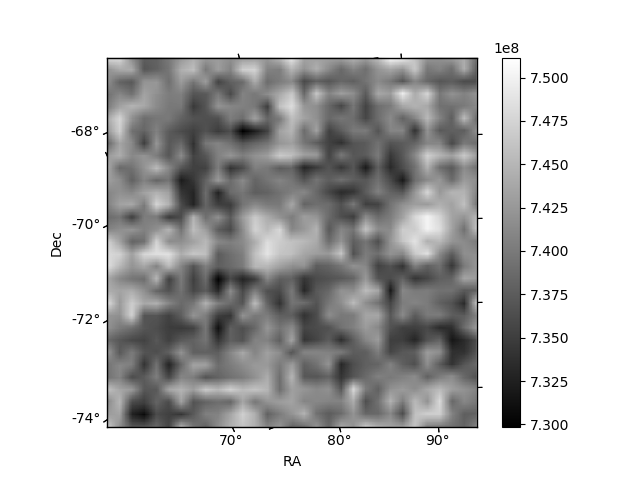
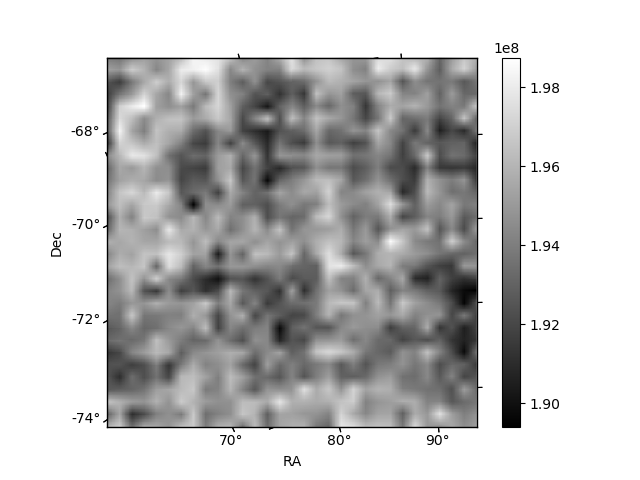
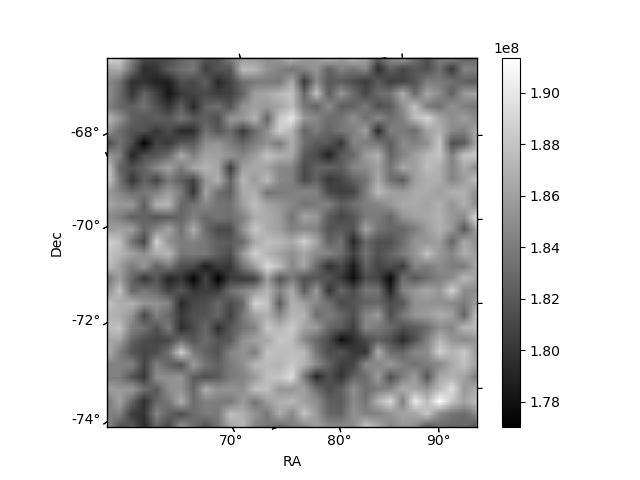
Histogram calculated using DETX and DETY for each event in the final _common_clean file
| Quadrant A | 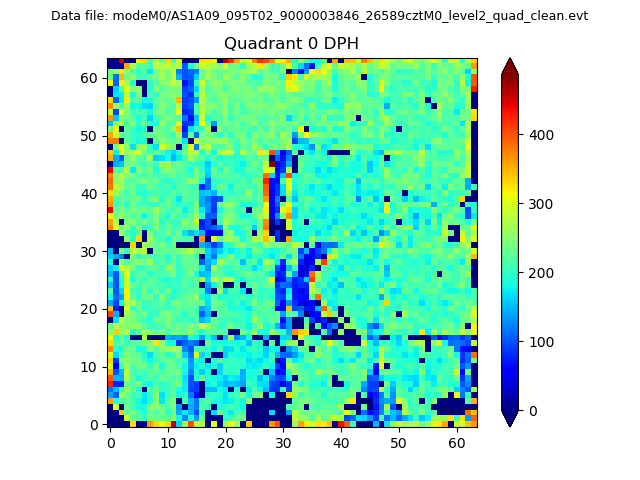 |
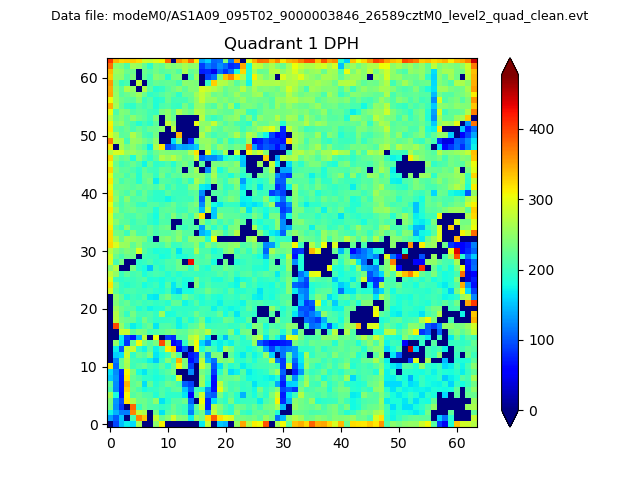 |
Quadrant B |
|---|---|---|---|
| Quadrant D | 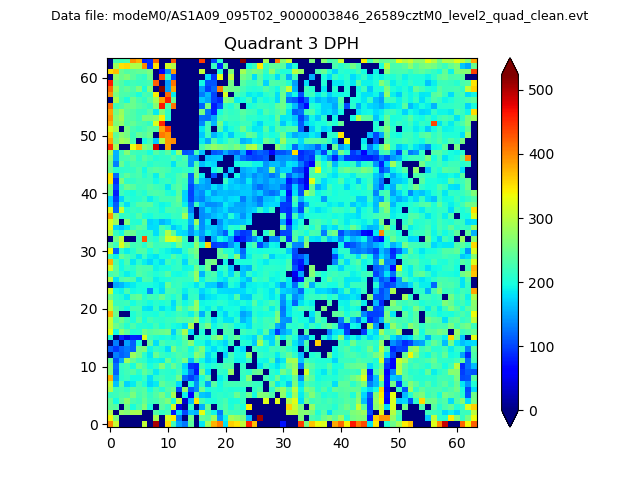 |
 |
Quadrant C |
| Plot type | Count rate plots | Images |
|---|---|---|
| Comparison with Poisson distribution Blue bars denote a histogram of data divided into 1 sec bins. Red curve is a Poisson curve with rate = median count rate of data. |
 |
 |
| Quadrant-wise count rates Data is divided into 100 sec bins |
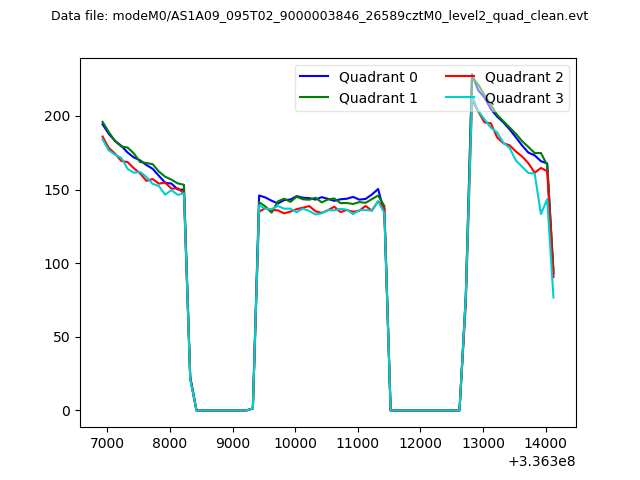 |
|
| Module-wise count rates for Quadrant A Data is divided into 100 sec bins |
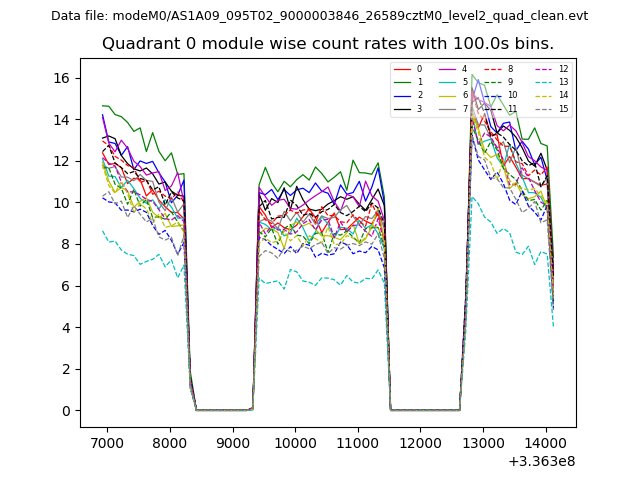 |
 |
| Module-wise count rates for Quadrant B Data is divided into 100 sec bins |
 |
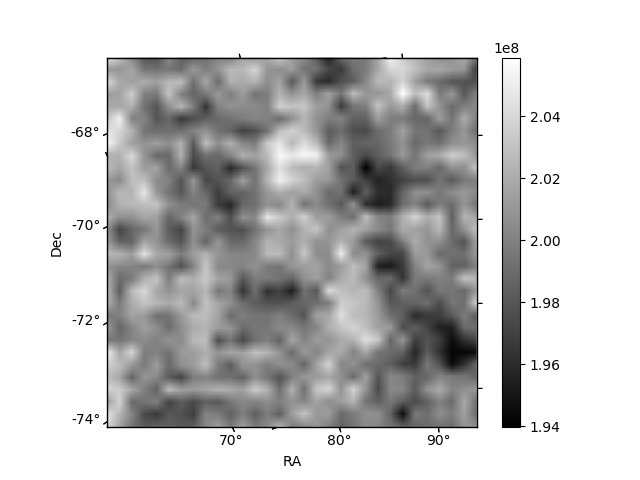 |
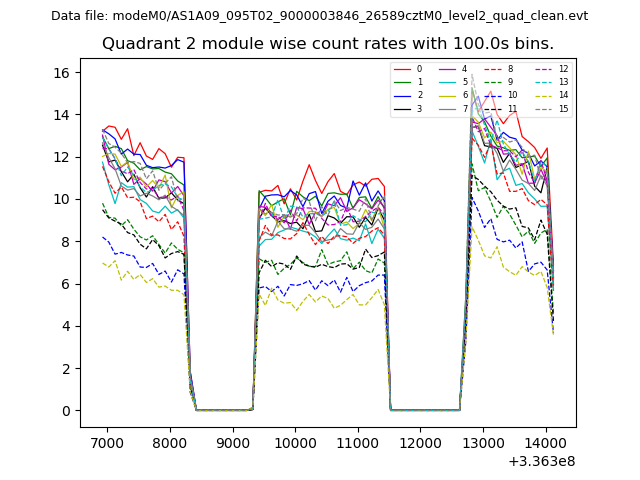
| Module-wise count rates for Quadrant C Data is divided into 100 sec bins |
 |
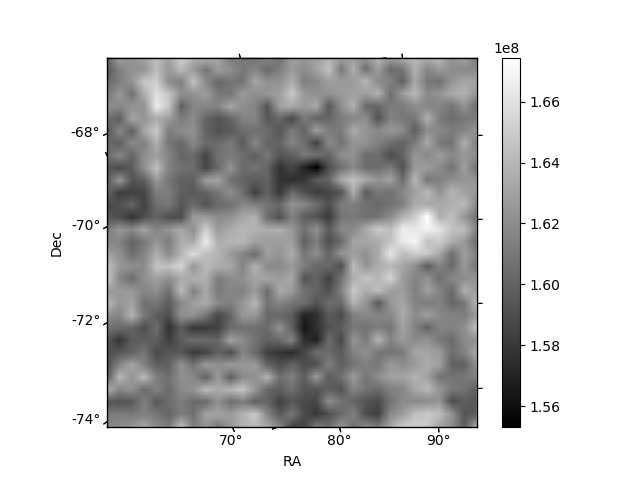 |
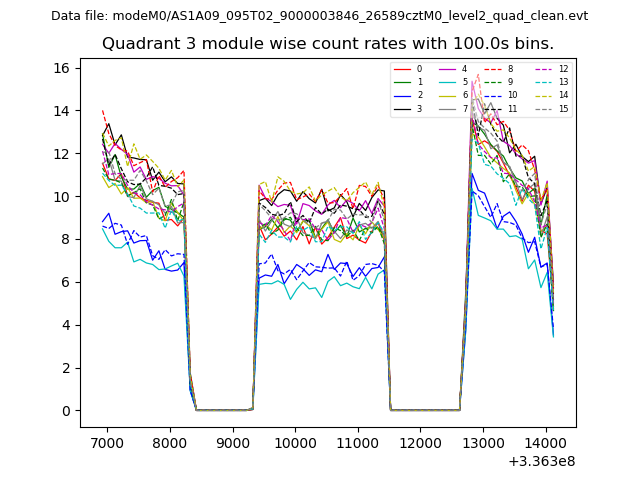
| Module-wise count rates for Quadrant D Data is divided into 100 sec bins |
 |
 |
| Parameter | Plot |
|---|---|
| CZT HV Monitor | 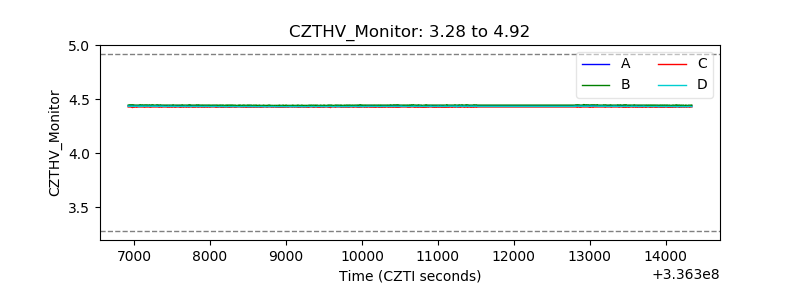 |
| D_VDD | 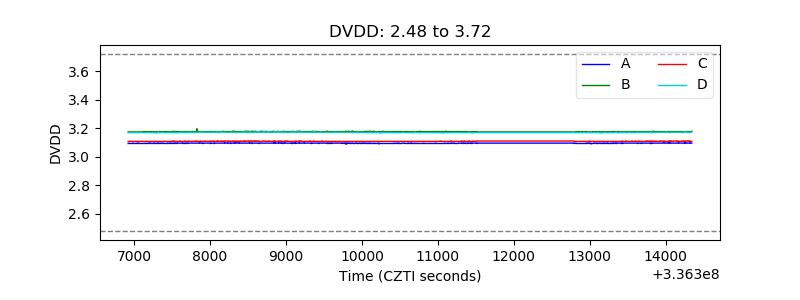 |
| Temperature 1 | 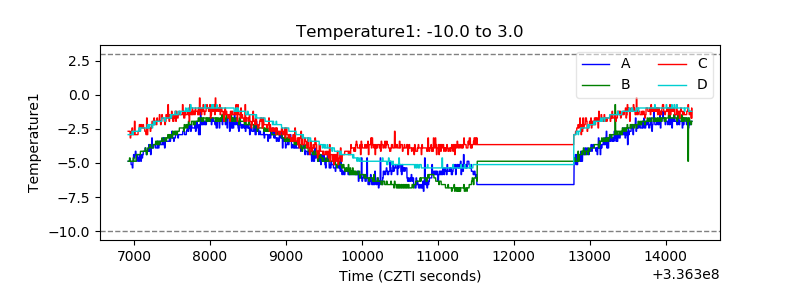 |
| Veto HV Monitor | 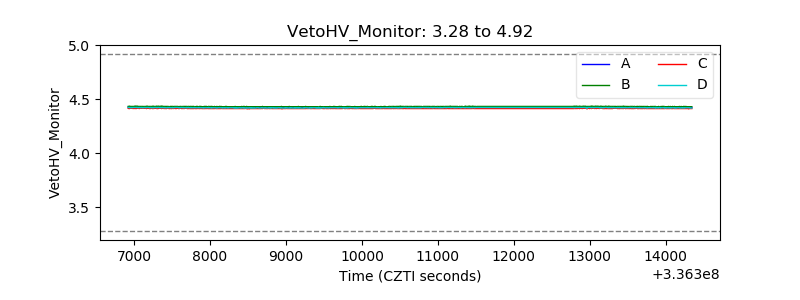 |
| Veto LLD | 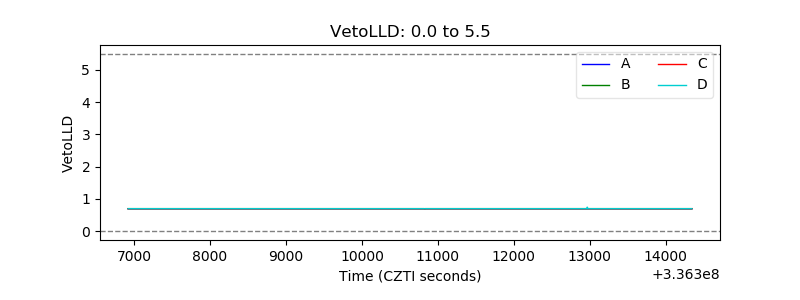 |
| Alpha Counter | 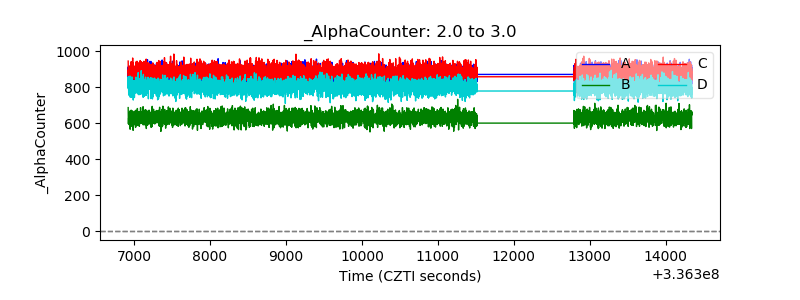 |
| _CPM_Rate |  |
| CZT Counter | 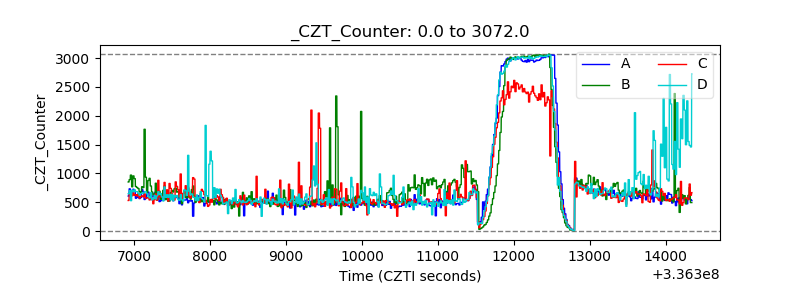 |
| +2.5 Volts monitor | 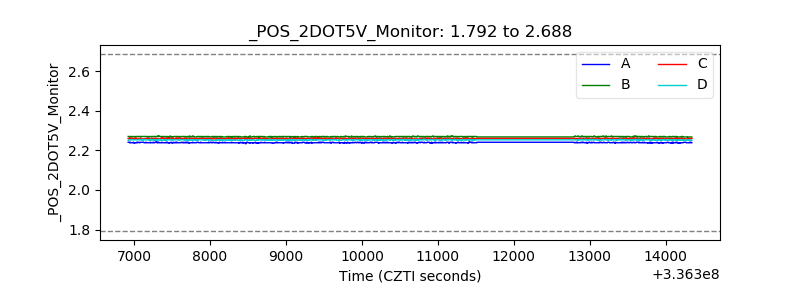 |
| +5 Volts monitor |  |
| _ROLL_ROT | 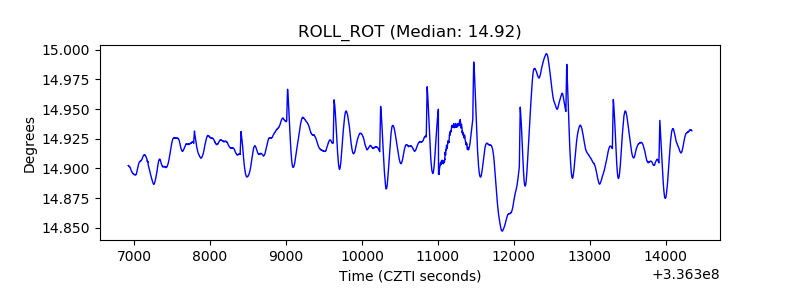 |
| _Roll_DEC | 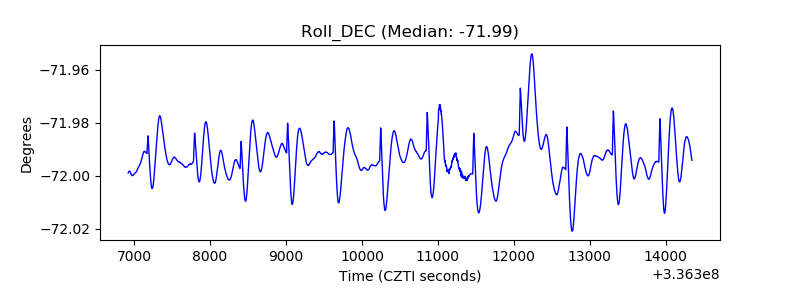 |
| _Roll_RA | 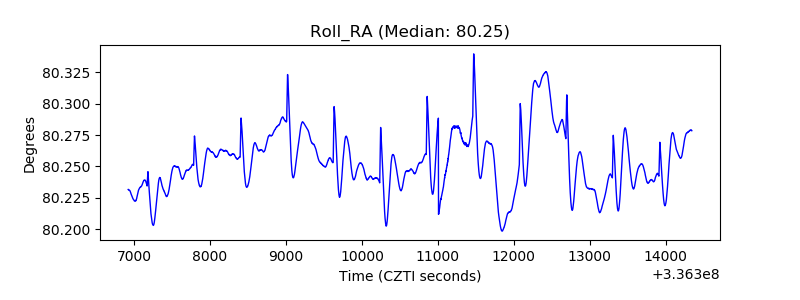 |
| Veto Counter | 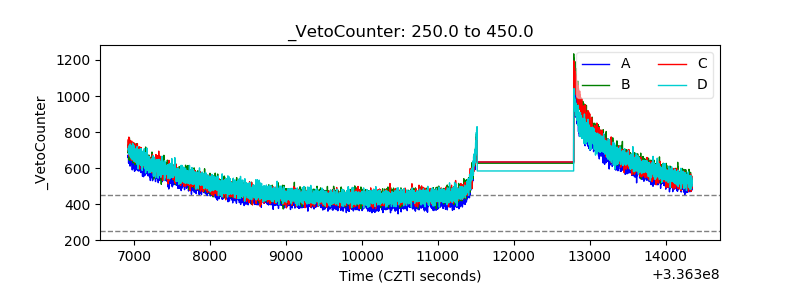 |